Optical Biometry Devices Market Analysis, Size, and Forecast 2026-2030: North America (US, Canada, and Mexico), Europe (Germany, UK, and France), APAC (China, India, and Japan), South America (Brazil, Argentina, and Colombia), Middle East and Africa (Saudi Arabia, UAE, and Turkey), Asia, Rest of World (ROW)

Optical Biometry Devices Market Analysis, Size, and Forecast 2026-2030:
North America (US, Canada, and Mexico), Europe (Germany, UK, and France), APAC (China, India, and Japan), South America (Brazil, Argentina, and Colombia), Middle East and Africa (Saudi Arabia, UAE, and Turkey), Asia, Rest of World (ROW)

Published: Dec 2025 291 Pages SKU: IRTNTR46451

Market Overview at a Glance

$106.1 Mn
Market Opportunity
5.4%
CAGR 2025 - 2030
35.6%
North America Growth
$162 Mn
Hospitals segment 2024

Optical Biometry Devices Market Size 2026-2030

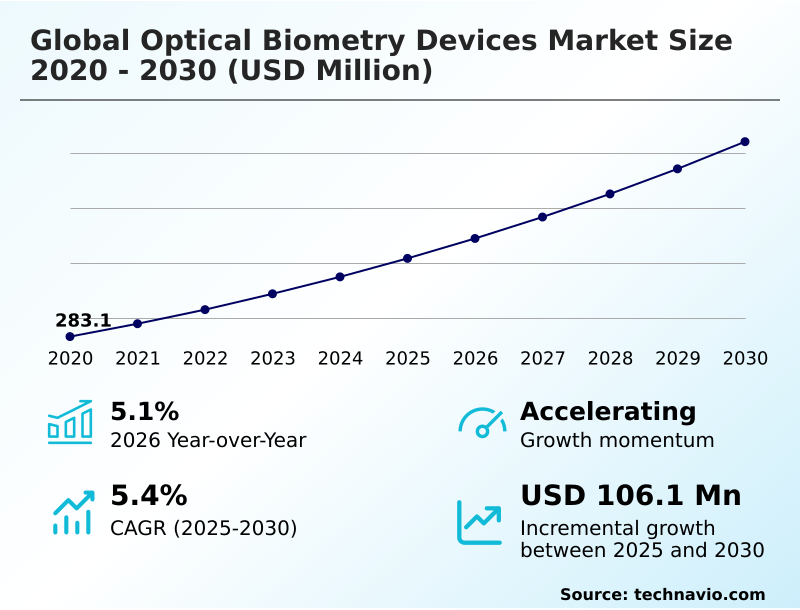
The optical biometry devices market size is valued to increase by USD 106.1 million, at a CAGR of 5.4% from 2025 to 2030. Rise in prevalence of cataract among geriatric population will drive the optical biometry devices market.

Major Market Trends & Insights

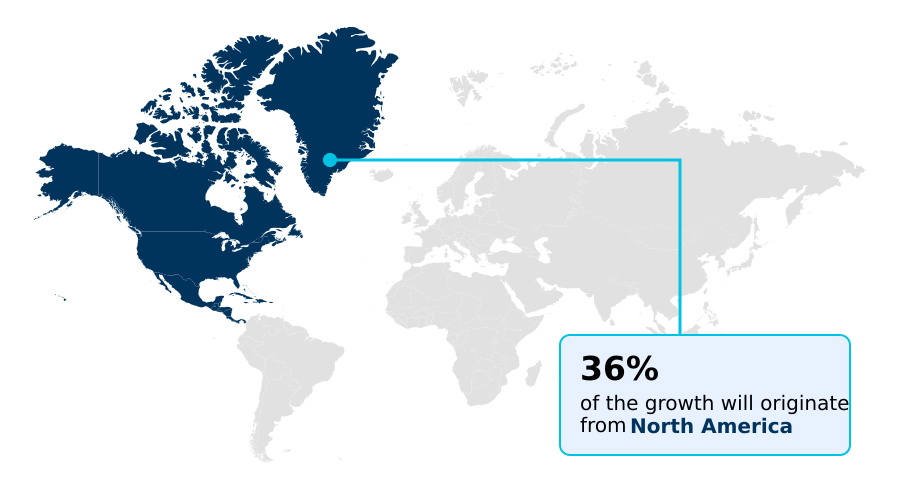
  • North America dominated the market and accounted for a 35.6% growth during the forecast period.
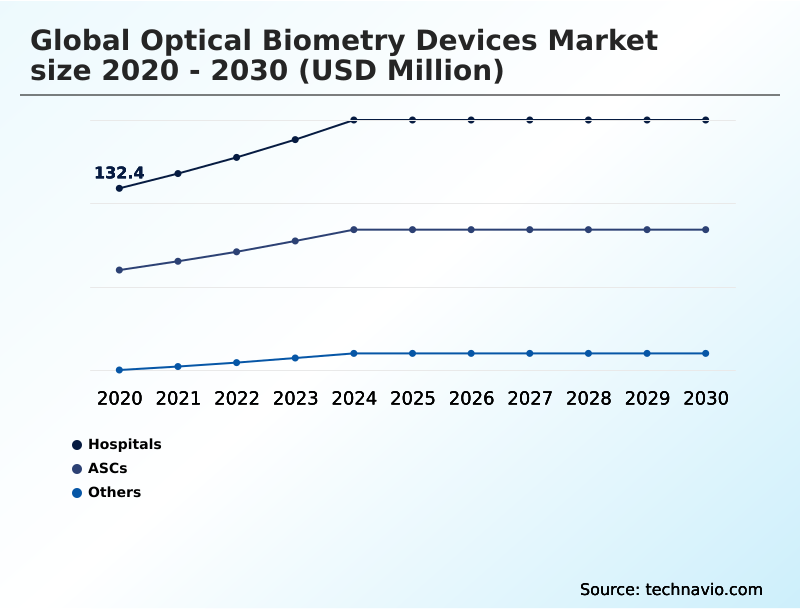
  • By End-user - Hospitals segment was valued at USD 162 million in 2024
  • By Product - SS-OCT-based optical biometers segment accounted for the largest market revenue share in 2024

Market Size & Forecast

  • Market Opportunities: USD 177.2 million
  • Market Future Opportunities: USD 106.1 million
  • CAGR from 2025 to 2030 : 5.4%

Market Summary

  • The optical biometry devices market is defined by the pursuit of surgical precision and improved clinical workflows. A primary driver is the increasing volume of cataract surgeries, which demands accurate preoperative assessments to meet patient expectations for excellent visual outcomes, especially with premium intraocular lenses.
  • Technological evolution is a dominant trend, with a clear migration from traditional ultrasound methods to non-contact optical technologies that offer superior accuracy and patient comfort. Devices now integrate multiple functionalities, moving beyond simple measurements to provide comprehensive ocular analysis.
  • For instance, a high-volume ambulatory surgical center must weigh the investment in a new biometer against its ability to streamline patient flow, reduce measurement time, and provide the robust data needed for complex refractive calculations, thereby ensuring both operational efficiency and clinical excellence.
  • However, the market is not without its challenges; supply chain vulnerabilities for critical optical components and the inherent limitations of technology in eyes with dense media opacities constrain universal adoption and create pressures on manufacturing and pricing.

What will be the Size of the Optical Biometry Devices Market during the forecast period?

Get Key Insights on Market Forecast (PDF) Request Free Sample

How is the Optical Biometry Devices Market Segmented?

The optical biometry devices industry research report provides comprehensive data (region-wise segment analysis), with forecasts and estimates in "USD million" for the period 2026-2030, as well as historical data from 2020-2024 for the following segments.

  • End-user
    • Hospitals
    • ASCs
    • Others
  • Product
    • SS-OCT-based optical biometers
    • OLCR-based optical biometers
    • PCI-based optical biometers
  • Product type
    • Non-contact type
    • Contact type
  • Geography
    • North America
      • US
      • Canada
      • Mexico
    • Europe
      • Germany
      • UK
      • France
    • Asia
    • Rest of World (ROW)

By End-user Insights

The hospitals segment is estimated to witness significant growth during the forecast period.

Hospitals represent a cornerstone of the optical biometry devices market, driven by high surgical volumes and the need for precision in complex cases.

These facilities require robust systems for accurate intraocular lens calculation and phacoemulsification planning to ensure optimal postoperative refractive outcome. The integration of high-resolution cross-sectional imaging and automated keratometry supports superior refractive error analysis and toric IOL alignment.

Advanced biometric data management platforms are essential for handling measurements like axial length measurement, corneal curvature, anterior chamber depth, lens thickness measurement, and white-to-white distance.

By leveraging precise intraocular lens calculation, facilities report a reduction in postoperative refractive surprises by up to 30%, improving both patient satisfaction and operational efficiency within ophthalmology departments.

Request Free Sample

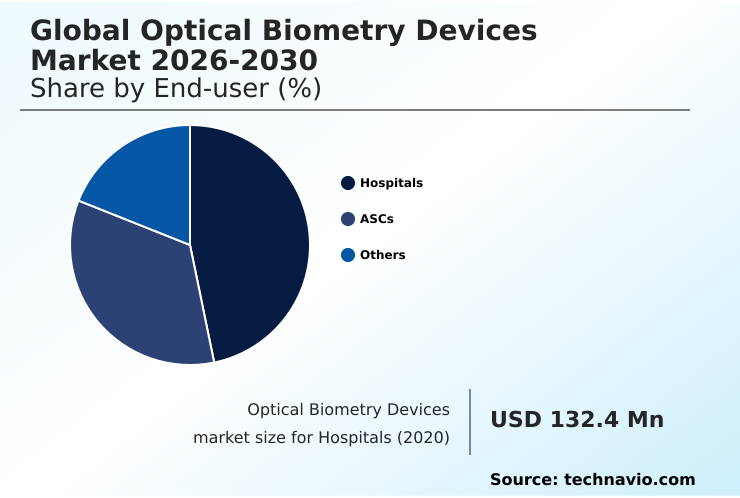
The Hospitals segment was valued at USD 162 million in 2024 and showed a gradual increase during the forecast period.

Request Free Sample

Regional Analysis

North America is estimated to contribute 35.6% to the growth of the global market during the forecast period.Technavio’s analysts have elaborately explained the regional trends and drivers that shape the market during the forecast period.

See How Optical Biometry Devices Market Demand is Rising in North America Request Free Sample

The market's geographic landscape is led by North America, which is projected to contribute over 35% of incremental growth, driven by advanced healthcare infrastructure and high adoption of technologies like swept-source optical coherence tomography.

Europe shows a strong growth trajectory, expanding faster than North America, with a focus on non-contact tonometry and wavefront aberrometry.

Meanwhile, Asia is emerging as a high-growth region due to rising healthcare expenditure and a focus on improving ocular surface analysis and pachymetry mapping.

Across regions, there is a consistent demand for precise pupil diameter measurement and tools to assess posterior corneal astigmatism, reflecting a global push for higher standards in ophthalmic diagnostics.
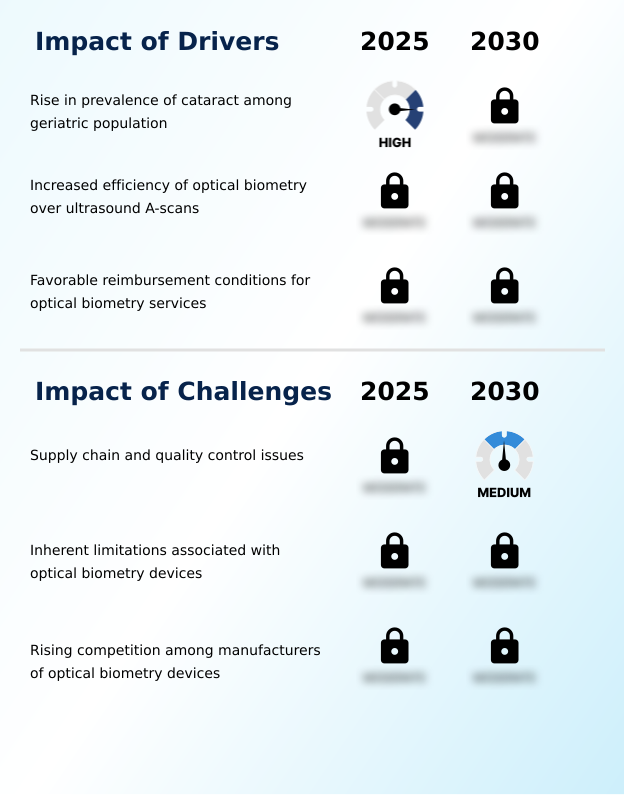
Market Dynamics

Our researchers analyzed the data with 2025 as the base year, along with the key drivers, trends, and challenges. A holistic analysis of drivers will help companies refine their marketing strategies to gain a competitive advantage.

  • Achieving optimal surgical outcomes in the global optical biometry devices market 2026-2030 hinges on addressing nuanced clinical challenges. The accuracy of non-contact optical biometry is paramount, particularly for optical biometry for premium iol selection, where even minor errors can impact patient satisfaction.
  • A key industry debate involves comparing ss-oct and olcr biometry, with facilities evaluating which technology best manages the challenges in dense cataract biometry. Furthermore, the growing population of patients with prior refractive surgery makes optical biometry in post-lasik eyes a critical capability, requiring specialized calculation formulas.
  • Workflow efficiency with automated biometers is a major consideration for high-volume clinics, as is the continuous need for intraocular lens constant optimization to refine results. Specialized applications, such as biometry for pediatric ophthalmology, demand unique instrument features and operator skill. The role of ai in iol power calculation is transformative, aiming to significantly reduce the incidence of postoperative refractive surprise.
  • Success in reducing refractive surprise with biometry depends on a holistic approach that includes ss-oct versus pci accuracy comparison for different cases, precise planning for biometry for toric lens implantation, and effectively managing irregular corneas with biometry. Clinicians must also account for the impact of dry eye on biometry.
  • The ability to perform posterior capsule opacification measurement and integrate biometry with femtosecond lasers represents the next frontier. Ultimately, biometry data for refractive surgery planning underscores the technology's expanding scope. Facilities adopting comprehensive biometric data analysis report up to 50% greater consistency in surgical outcomes.
  • The cost-effectiveness of advanced biometers, the potential of tele-ophthalmology and remote biometry, and the constant need for validating new iol calculation formulas will continue to shape procurement and clinical practice.

What are the key market drivers leading to the rise in the adoption of Optical Biometry Devices Industry?

  • The rising prevalence of cataracts among the geriatric population is a key driver for the optical biometry devices market.

  • A key driver is the pursuit of superior surgical precision, supported by advanced software and algorithms. The adoption of ray tracing technology and sophisticated point spread function analysis is improving the refractive predictability enhancement of modern biometers.
  • These systems are moving beyond legacy haigis and srk/t formulas to incorporate newer models like the barrett universal ii formula and olsen formula, which are refined by machine learning algorithms.
  • This evolution facilitates a more streamlined diagnostic workflow, with integrated electronic medical record connectivity improving data management.
  • The emphasis on measurement repeatability and preoperative assessment precision helps reduce optical signal attenuation issues, leading to a 20% improvement in measurement success rates in challenging eyes.

What are the market trends shaping the Optical Biometry Devices Industry?

  • A significant market trend is the rise in technological advances within optical biometry devices. These innovations are enhancing measurement accuracy and streamlining clinical workflows.

  • Technological advancements are a primary trend, with a notable shift toward systems utilizing partial coherence interferometry and optical low-coherence reflectometry. These platforms offer enhanced astigmatism analysis and precise z-axis position tracking. Innovations in corneal topography integration and anterior segment tomography provide comprehensive ocular assessments, including retinal thickness analysis and measurement of lens tilt and decentration.
  • The focus on operator-independent alignment and dynamic cyclotorsion compensation has improved high-speed data acquisition, with some systems achieving a 15% faster scan time. Furthermore, superior signal-to-noise ratio optimization and digital imaging integration are streamlining workflows, contributing to more efficient and reliable diagnostics in modern ophthalmology practices.

What challenges does the Optical Biometry Devices Industry face during its growth?

  • Supply chain disruptions and stringent quality control requirements present key challenges affecting industry growth.

  • Key market challenges stem from technological limitations and data management complexities. Overcoming issues related to ocular media opacity remains a hurdle for many interferometry-based systems, requiring frequent biometry device calibration to maintain accuracy. The increasing reliance on AI-assisted diagnostics and complex signal processing algorithms necessitates stringent biometric data validation and automated quality check protocols.
  • Ensuring patient data security is a growing concern as more clinical decision support tools become cloud-connected. Furthermore, achieving accurate aqueous depth measurement, central corneal thickness, and vitreous length calculation in all patient types is an ongoing R&D challenge, with IOL constant personalization requiring extensive surgical outcome analysis and robust data sets for optimization.

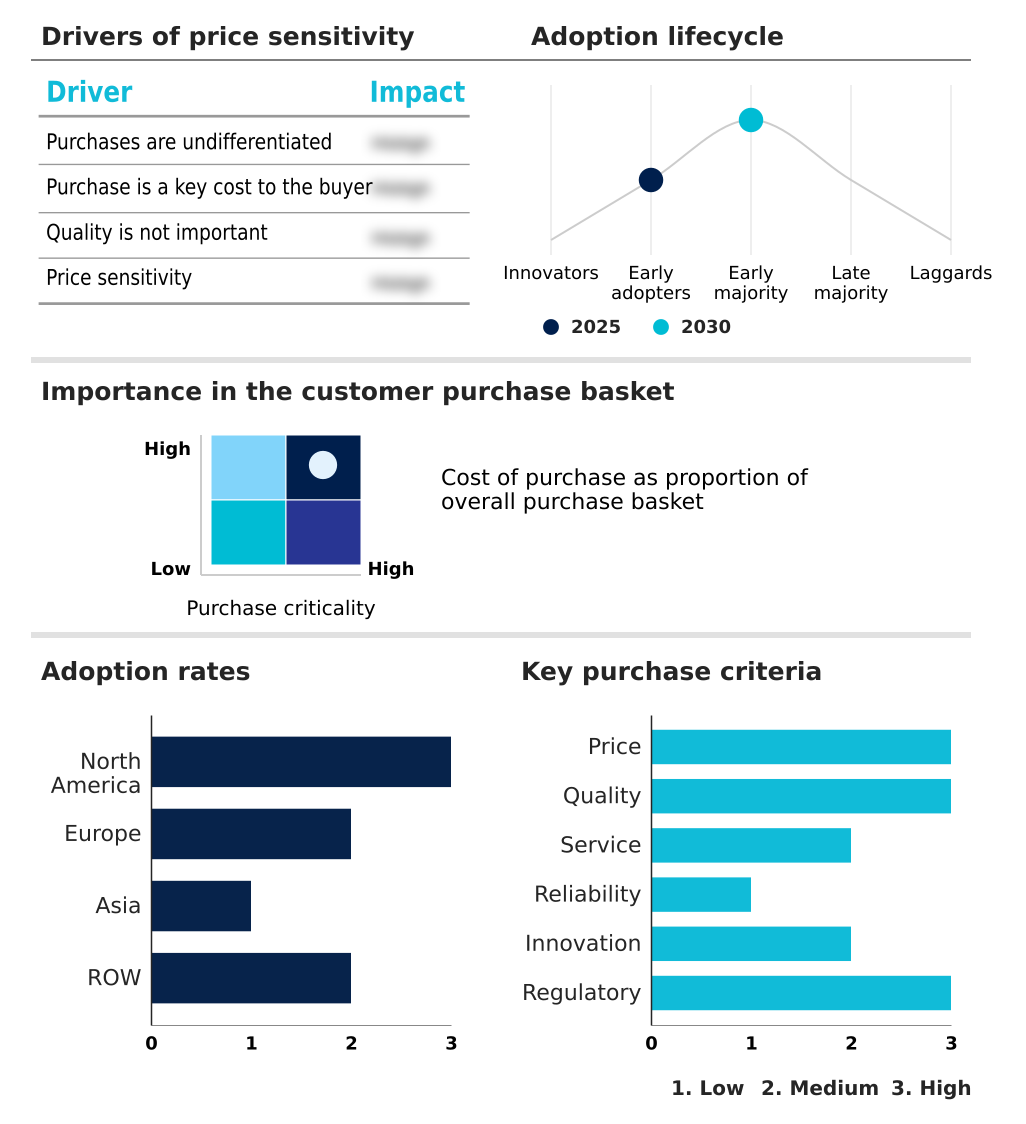
Exclusive Technavio Analysis on Customer Landscape

The optical biometry devices market forecasting report includes the adoption lifecycle of the market, covering from the innovator’s stage to the laggard’s stage. It focuses on adoption rates in different regions based on penetration. Furthermore, the optical biometry devices market report also includes key purchase criteria and drivers of price sensitivity to help companies evaluate and develop their market growth analysis strategies.

Customer Landscape of Optical Biometry Devices Industry

Competitive Landscape

Companies are implementing various strategies, such as strategic alliances, optical biometry devices market forecast, partnerships, mergers and acquisitions, geographical expansion, and product/service launches, to enhance their presence in the industry.

AMETEK Inc. - The vendor landscape features specialized firms and diversified corporations delivering advanced instruments for precise ocular measurements, which enhance surgical planning and improve clinical outcomes in ophthalmology.

The industry research and growth report includes detailed analyses of the competitive landscape of the market and information about key companies, including:

  • AMETEK Inc.
  • Bausch Lomb Corp.
  • Baxter International Inc.
  • Canon Inc.
  • Carl Zeiss AG
  • Haag Streit AG
  • HEINE Optotechnik GmbH
  • HOYA CORP.
  • Metall Zug AG
  • Nidek Co. Ltd.
  • OCULUS Optikgerate GmbH
  • Optovue Inc.
  • Revenio Group Oyj
  • Santec Corp.
  • Tomey Corp.
  • Topcon Corp.
  • US Ophthalmic LLC
  • VISIONIX USA INC.
  • Ziemer Group

Qualitative and quantitative analysis of companies has been conducted to help clients understand the wider business environment as well as the strengths and weaknesses of key industry players. Data is qualitatively analyzed to categorize companies as pure play, category-focused, industry-focused, and diversified; it is quantitatively analyzed to categorize companies as dominant, leading, strong, tentative, and weak.

Recent Development and News in Optical biometry devices market

  • In January 2025, Heidelberg Engineering introduced an upgraded biometry platform that incorporates faster optical coherence scanning, an improved keratometry module, and advanced AI-based refractive calculations designed to support modern cataract surgery planning.
  • In March 2025, Nidek expanded its ophthalmic portfolio by introducing a compact biometry system optimized for ASC environments, delivering faster measurement cycles and intuitive touch screen interfaces that support high patient turnover.
  • In March 2025, Haag Streit reported increased installations of its optical biometry systems across European surgical centers, citing strong demand for improved efficiency over conventional ultrasound-based diagnostics.
  • In April 2025, Topcon Healthcare noted an increase in demand for its devices in regions where updated reimbursement schedules for cataract diagnostics were implemented, demonstrating how financial policy changes support adoption trends.
  • In May 2025, Ziemer Group encountered increased competitive pressure in key Asian markets from newly introduced biometry systems offered at lower price points, prompting the company to expand distributor partnerships.

Dive into Technavio’s robust research methodology, blending expert interviews, extensive data synthesis, and validated models for unparalleled Optical Biometry Devices Market insights. See full methodology.

Market Scope
Page number 291
Base year 2025
Historic period 2020-2024
Forecast period 2026-2030
Growth momentum & CAGR Accelerate at a CAGR of 5.4%
Market growth 2026-2030 USD 106.1 million
Market structure Fragmented
YoY growth 2025-2026(%) 5.1%
Key countries US, Canada, Mexico, Germany, UK, France, Italy, The Netherlands, Spain, China, India, Japan, South Korea, Thailand, Indonesia, Brazil, Saudi Arabia, Argentina, UAE, Colombia, Turkey, South Africa and Israel
Competitive landscape Leading Companies, Market Positioning of Companies, Competitive Strategies, and Industry Risks

Request Free Sample

Research Analyst Overview

  • The core of the optical biometry devices market is the shift toward high-precision diagnostics. Boardroom decisions on capital expenditure now center on acquiring platforms featuring swept-source optical coherence tomography and interferometry-based systems for superior anterior segment tomography. These devices enable not just basic biometry but also retinal thickness analysis, pachymetry mapping, and ocular surface analysis using high-resolution cross-sectional imaging.
  • The integration of corneal topography integration and wavefront aberrometry is critical for phacoemulsification planning and accurate toric IOL alignment, addressing posterior corneal astigmatism and dynamic cyclotorsion compensation. Advanced software leverages ray tracing technology, point spread function analysis, and modern gaussian optics formulas like the barrett universal ii formula and olsen formula, departing from older haigis and srk/t formulas.
  • AI-assisted diagnostics and machine learning algorithms drive biometric data validation and improve refractive error analysis. These platforms have demonstrated a reduction in prediction error by over 20% in challenging cases.
  • Functionalities extend to non-contact tonometry, pupil diameter measurement, central corneal thickness assessment, aqueous depth measurement, and vitreous length calculation, all managed via sophisticated biometric data management systems with automated quality check and advanced signal processing algorithms to measure lens tilt and decentration.

What are the Key Data Covered in this Optical Biometry Devices Market Research and Growth Report?

  • What is the expected growth of the Optical Biometry Devices Market between 2026 and 2030?

    • USD 106.1 million, at a CAGR of 5.4%

  • What segmentation does the market report cover?

    • The report is segmented by End-user (Hospitals, ASCs, and Others), Product (SS-OCT-based optical biometers, OLCR-based optical biometers, and PCI-based optical biometers), Product Type (Non-contact type, and Contact type) and Geography (North America, Europe, Asia, Rest of World (ROW))

  • Which regions are analyzed in the report?

    • North America, Europe, Asia and Rest of World (ROW)

  • What are the key growth drivers and market challenges?

    • Rise in prevalence of cataract among geriatric population, Supply chain and quality control issues

  • Who are the major players in the Optical Biometry Devices Market?

    • AMETEK Inc., Bausch Lomb Corp., Baxter International Inc., Canon Inc., Carl Zeiss AG, Haag Streit AG, HEINE Optotechnik GmbH, HOYA CORP., Metall Zug AG, Nidek Co. Ltd., OCULUS Optikgerate GmbH, Optovue Inc., Revenio Group Oyj, Santec Corp., Tomey Corp., Topcon Corp., US Ophthalmic LLC, VISIONIX USA INC. and Ziemer Group

Market Research Insights

  • Market dynamics are shaped by the need for enhanced diagnostic precision and operational efficiency. The integration of advanced surgical planning software improves biometric measurement accuracy, which is critical for emmetropia targeting and successful post-refractive surgery calculation. Non-contact systems with reliable patient fixation monitoring are gaining favor, as they can achieve dense cataract penetration more effectively than older technologies.
  • This focus on advanced technology is delivering tangible results, with some facilities reporting a 25% reduction in postoperative refractive surprises. Furthermore, the ability to streamline preoperative assessments contributes to an improvement in clinical throughput by up to 40%, optimizing resource allocation in high-volume surgical centers.

We can help! Our analysts can customize this optical biometry devices market research report to meet your requirements.

Get in touch

1. Executive Summary

1.1 Market overview

Executive Summary - Chart on Market Overview
Executive Summary - Data Table on Market Overview
Executive Summary - Chart on Global Market Characteristics
Executive Summary - Chart on Market by Geography
Executive Summary - Chart on Market Segmentation by End-user
Executive Summary - Chart on Market Segmentation by Product
Executive Summary - Chart on Market Segmentation by Product Type
Executive Summary - Chart on Incremental Growth
Executive Summary - Data Table on Incremental Growth
Executive Summary - Chart on Company Market Positioning

2. Technavio Analysis

2.1 Analysis of price sensitivity, lifecycle, customer purchase basket, adoption rates, and purchase criteria

2.2 Criticality of inputs and Factors of differentiation

Chart on Overview on criticality of inputs and factors of differentiation

2.3 Factors of disruption

Chart on Overview on factors of disruption

2.4 Impact of drivers and challenges

Chart on Impact of drivers and challenges in 2025 and 2030

3. Market Landscape

3.1 Market ecosystem

Chart on Parent Market
Data Table on - Parent Market

3.2 Market characteristics

Chart on Market characteristics analysis

3.3 Value chain analysis

Chart on Value chain analysis

4. Market Sizing

4.1 Market definition

Data Table on Offerings of companies included in the market definition

4.2 Market segment analysis

Market segments

4.3 Market size 2025

4.4 Market outlook: Forecast for 2025-2030

Chart on Global - Market size and forecast 2025-2030 ($ million)
Data Table on Global - Market size and forecast 2025-2030 ($ million)
Chart on Global Market: Year-over-year growth 2025-2030 (%)
Data Table on Global Market: Year-over-year growth 2025-2030 (%)

5. Historic Market Size

5.1 Global Optical Biometry Devices Market 2020 - 2024

Historic Market Size - Data Table on Global Optical Biometry Devices Market 2020 - 2024 ($ million)

5.2 End-user segment analysis 2020 - 2024

Historic Market Size - End-user Segment 2020 - 2024 ($ million)

5.3 Product segment analysis 2020 - 2024

Historic Market Size - Product Segment 2020 - 2024 ($ million)

5.4 Product Type segment analysis 2020 - 2024

Historic Market Size - Product Type Segment 2020 - 2024 ($ million)

5.5 Geography segment analysis 2020 - 2024

Historic Market Size - Geography Segment 2020 - 2024 ($ million)

5.6 Country segment analysis 2020 - 2024

Historic Market Size - Country Segment 2020 - 2024 ($ million)

6. Qualitative Analysis

6.1 AI impact on Global Optical Biometry Devices Market

7. Five Forces Analysis

7.1 Five forces summary

Five forces analysis - Comparison between 2025 and 2030

7.2 Bargaining power of buyers

Bargaining power of buyers - Impact of key factors 2025 and 2030

7.3 Bargaining power of suppliers

Bargaining power of suppliers - Impact of key factors in 2025 and 2030

7.4 Threat of new entrants

Threat of new entrants - Impact of key factors in 2025 and 2030

7.5 Threat of substitutes

Threat of substitutes - Impact of key factors in 2025 and 2030

7.6 Threat of rivalry

Threat of rivalry - Impact of key factors in 2025 and 2030

7.7 Market condition

Chart on Market condition - Five forces 2025 and 2030

8. Market Segmentation by End-user

8.1 Market segments

Chart on End-user - Market share 2025-2030 (%)
Data Table on End-user - Market share 2025-2030 (%)

8.2 Comparison by End-user

Chart on Comparison by End-user
Data Table on Comparison by End-user

8.3 Hospitals - Market size and forecast 2025-2030

Chart on Hospitals - Market size and forecast 2025-2030 ($ million)
Data Table on Hospitals - Market size and forecast 2025-2030 ($ million)
Chart on Hospitals - Year-over-year growth 2025-2030 (%)
Data Table on Hospitals - Year-over-year growth 2025-2030 (%)

8.4 ASCs - Market size and forecast 2025-2030

Chart on ASCs - Market size and forecast 2025-2030 ($ million)
Data Table on ASCs - Market size and forecast 2025-2030 ($ million)
Chart on ASCs - Year-over-year growth 2025-2030 (%)
Data Table on ASCs - Year-over-year growth 2025-2030 (%)

8.5 Others - Market size and forecast 2025-2030

Chart on Others - Market size and forecast 2025-2030 ($ million)
Data Table on Others - Market size and forecast 2025-2030 ($ million)
Chart on Others - Year-over-year growth 2025-2030 (%)
Data Table on Others - Year-over-year growth 2025-2030 (%)

8.6 Market opportunity by End-user

Market opportunity by End-user ($ million)
Data Table on Market opportunity by End-user ($ million)

9. Market Segmentation by Product

9.1 Market segments

Chart on Product - Market share 2025-2030 (%)
Data Table on Product - Market share 2025-2030 (%)

9.2 Comparison by Product

Chart on Comparison by Product
Data Table on Comparison by Product

9.3 SS-OCT-based optical biometers - Market size and forecast 2025-2030

Chart on SS-OCT-based optical biometers - Market size and forecast 2025-2030 ($ million)
Data Table on SS-OCT-based optical biometers - Market size and forecast 2025-2030 ($ million)
Chart on SS-OCT-based optical biometers - Year-over-year growth 2025-2030 (%)
Data Table on SS-OCT-based optical biometers - Year-over-year growth 2025-2030 (%)

9.4 OLCR-based optical biometers - Market size and forecast 2025-2030

Chart on OLCR-based optical biometers - Market size and forecast 2025-2030 ($ million)
Data Table on OLCR-based optical biometers - Market size and forecast 2025-2030 ($ million)
Chart on OLCR-based optical biometers - Year-over-year growth 2025-2030 (%)
Data Table on OLCR-based optical biometers - Year-over-year growth 2025-2030 (%)

9.5 PCI-based optical biometers - Market size and forecast 2025-2030

Chart on PCI-based optical biometers - Market size and forecast 2025-2030 ($ million)
Data Table on PCI-based optical biometers - Market size and forecast 2025-2030 ($ million)
Chart on PCI-based optical biometers - Year-over-year growth 2025-2030 (%)
Data Table on PCI-based optical biometers - Year-over-year growth 2025-2030 (%)

9.6 Market opportunity by Product

Market opportunity by Product ($ million)
Data Table on Market opportunity by Product ($ million)

10. Market Segmentation by Product Type

10.1 Market segments

Chart on Product Type - Market share 2025-2030 (%)
Data Table on Product Type - Market share 2025-2030 (%)

10.2 Comparison by Product Type

Chart on Comparison by Product Type
Data Table on Comparison by Product Type

10.3 Non-contact type - Market size and forecast 2025-2030

Chart on Non-contact type - Market size and forecast 2025-2030 ($ million)
Data Table on Non-contact type - Market size and forecast 2025-2030 ($ million)
Chart on Non-contact type - Year-over-year growth 2025-2030 (%)
Data Table on Non-contact type - Year-over-year growth 2025-2030 (%)

10.4 Contact type - Market size and forecast 2025-2030

Chart on Contact type - Market size and forecast 2025-2030 ($ million)
Data Table on Contact type - Market size and forecast 2025-2030 ($ million)
Chart on Contact type - Year-over-year growth 2025-2030 (%)
Data Table on Contact type - Year-over-year growth 2025-2030 (%)

10.5 Market opportunity by Product Type

Market opportunity by Product Type ($ million)
Data Table on Market opportunity by Product Type ($ million)

11. Customer Landscape

11.1 Customer landscape overview

Analysis of price sensitivity, lifecycle, customer purchase basket, adoption rates, and purchase criteria

12. Geographic Landscape

12.1 Geographic segmentation

Chart on Market share by geography 2025-2030 (%)
Data Table on Market share by geography 2025-2030 (%)

12.2 Geographic comparison

Chart on Geographic comparison
Data Table on Geographic comparison

12.3 North America - Market size and forecast 2025-2030

Chart on North America - Market size and forecast 2025-2030 ($ million)
Data Table on North America - Market size and forecast 2025-2030 ($ million)
Chart on North America - Year-over-year growth 2025-2030 (%)
Data Table on North America - Year-over-year growth 2025-2030 (%)
Chart on Regional Comparison - North America
Data Table on Regional Comparison - North America

12.3.1 US - Market size and forecast 2025-2030

Chart on US - Market size and forecast 2025-2030 ($ million)
Data Table on US - Market size and forecast 2025-2030 ($ million)
Chart on US - Year-over-year growth 2025-2030 (%)
Data Table on US - Year-over-year growth 2025-2030 (%)

12.3.2 Canada - Market size and forecast 2025-2030

Chart on Canada - Market size and forecast 2025-2030 ($ million)
Data Table on Canada - Market size and forecast 2025-2030 ($ million)
Chart on Canada - Year-over-year growth 2025-2030 (%)
Data Table on Canada - Year-over-year growth 2025-2030 (%)

12.3.3 Mexico - Market size and forecast 2025-2030

Chart on Mexico - Market size and forecast 2025-2030 ($ million)
Data Table on Mexico - Market size and forecast 2025-2030 ($ million)
Chart on Mexico - Year-over-year growth 2025-2030 (%)
Data Table on Mexico - Year-over-year growth 2025-2030 (%)

12.4 Europe - Market size and forecast 2025-2030

Chart on Europe - Market size and forecast 2025-2030 ($ million)
Data Table on Europe - Market size and forecast 2025-2030 ($ million)
Chart on Europe - Year-over-year growth 2025-2030 (%)
Data Table on Europe - Year-over-year growth 2025-2030 (%)
Chart on Regional Comparison - Europe
Data Table on Regional Comparison - Europe

12.4.1 Germany - Market size and forecast 2025-2030

Chart on Germany - Market size and forecast 2025-2030 ($ million)
Data Table on Germany - Market size and forecast 2025-2030 ($ million)
Chart on Germany - Year-over-year growth 2025-2030 (%)
Data Table on Germany - Year-over-year growth 2025-2030 (%)

12.4.2 UK - Market size and forecast 2025-2030

Chart on UK - Market size and forecast 2025-2030 ($ million)
Data Table on UK - Market size and forecast 2025-2030 ($ million)
Chart on UK - Year-over-year growth 2025-2030 (%)
Data Table on UK - Year-over-year growth 2025-2030 (%)

12.4.3 France - Market size and forecast 2025-2030

Chart on France - Market size and forecast 2025-2030 ($ million)
Data Table on France - Market size and forecast 2025-2030 ($ million)
Chart on France - Year-over-year growth 2025-2030 (%)
Data Table on France - Year-over-year growth 2025-2030 (%)

12.4.4 Italy - Market size and forecast 2025-2030

Chart on Italy - Market size and forecast 2025-2030 ($ million)
Data Table on Italy - Market size and forecast 2025-2030 ($ million)
Chart on Italy - Year-over-year growth 2025-2030 (%)
Data Table on Italy - Year-over-year growth 2025-2030 (%)

12.4.5 The Netherlands - Market size and forecast 2025-2030

Chart on The Netherlands - Market size and forecast 2025-2030 ($ million)
Data Table on The Netherlands - Market size and forecast 2025-2030 ($ million)
Chart on The Netherlands - Year-over-year growth 2025-2030 (%)
Data Table on The Netherlands - Year-over-year growth 2025-2030 (%)

12.4.6 Spain - Market size and forecast 2025-2030

Chart on Spain - Market size and forecast 2025-2030 ($ million)
Data Table on Spain - Market size and forecast 2025-2030 ($ million)
Chart on Spain - Year-over-year growth 2025-2030 (%)
Data Table on Spain - Year-over-year growth 2025-2030 (%)

12.5 Asia - Market size and forecast 2025-2030

Chart on Asia - Market size and forecast 2025-2030 ($ million)
Data Table on Asia - Market size and forecast 2025-2030 ($ million)
Chart on Asia - Year-over-year growth 2025-2030 (%)
Data Table on Asia - Year-over-year growth 2025-2030 (%)
Chart on Regional Comparison - Asia
Data Table on Regional Comparison - Asia

12.5.1 China - Market size and forecast 2025-2030

Chart on China - Market size and forecast 2025-2030 ($ million)
Data Table on China - Market size and forecast 2025-2030 ($ million)
Chart on China - Year-over-year growth 2025-2030 (%)
Data Table on China - Year-over-year growth 2025-2030 (%)

12.5.2 India - Market size and forecast 2025-2030

Chart on India - Market size and forecast 2025-2030 ($ million)
Data Table on India - Market size and forecast 2025-2030 ($ million)
Chart on India - Year-over-year growth 2025-2030 (%)
Data Table on India - Year-over-year growth 2025-2030 (%)

12.5.3 Japan - Market size and forecast 2025-2030

Chart on Japan - Market size and forecast 2025-2030 ($ million)
Data Table on Japan - Market size and forecast 2025-2030 ($ million)
Chart on Japan - Year-over-year growth 2025-2030 (%)
Data Table on Japan - Year-over-year growth 2025-2030 (%)

12.5.4 South Korea - Market size and forecast 2025-2030

Chart on South Korea - Market size and forecast 2025-2030 ($ million)
Data Table on South Korea - Market size and forecast 2025-2030 ($ million)
Chart on South Korea - Year-over-year growth 2025-2030 (%)
Data Table on South Korea - Year-over-year growth 2025-2030 (%)

12.5.5 Thailand - Market size and forecast 2025-2030

Chart on Thailand - Market size and forecast 2025-2030 ($ million)
Data Table on Thailand - Market size and forecast 2025-2030 ($ million)
Chart on Thailand - Year-over-year growth 2025-2030 (%)
Data Table on Thailand - Year-over-year growth 2025-2030 (%)

12.5.6 Indonesia - Market size and forecast 2025-2030

Chart on Indonesia - Market size and forecast 2025-2030 ($ million)
Data Table on Indonesia - Market size and forecast 2025-2030 ($ million)
Chart on Indonesia - Year-over-year growth 2025-2030 (%)
Data Table on Indonesia - Year-over-year growth 2025-2030 (%)

12.6 Rest of World (ROW) - Market size and forecast 2025-2030

Chart on Rest of World (ROW) - Market size and forecast 2025-2030 ($ million)
Data Table on Rest of World (ROW) - Market size and forecast 2025-2030 ($ million)
Chart on Rest of World (ROW) - Year-over-year growth 2025-2030 (%)
Data Table on Rest of World (ROW) - Year-over-year growth 2025-2030 (%)
Chart on Regional Comparison - Rest of World (ROW)
Data Table on Regional Comparison - Rest of World (ROW)

12.6.1 Brazil - Market size and forecast 2025-2030

Chart on Brazil - Market size and forecast 2025-2030 ($ million)
Data Table on Brazil - Market size and forecast 2025-2030 ($ million)
Chart on Brazil - Year-over-year growth 2025-2030 (%)
Data Table on Brazil - Year-over-year growth 2025-2030 (%)

12.6.2 Saudi Arabia - Market size and forecast 2025-2030

Chart on Saudi Arabia - Market size and forecast 2025-2030 ($ million)
Data Table on Saudi Arabia - Market size and forecast 2025-2030 ($ million)
Chart on Saudi Arabia - Year-over-year growth 2025-2030 (%)
Data Table on Saudi Arabia - Year-over-year growth 2025-2030 (%)

12.6.3 Argentina - Market size and forecast 2025-2030

Chart on Argentina - Market size and forecast 2025-2030 ($ million)
Data Table on Argentina - Market size and forecast 2025-2030 ($ million)
Chart on Argentina - Year-over-year growth 2025-2030 (%)
Data Table on Argentina - Year-over-year growth 2025-2030 (%)

12.6.4 UAE - Market size and forecast 2025-2030

Chart on UAE - Market size and forecast 2025-2030 ($ million)
Data Table on UAE - Market size and forecast 2025-2030 ($ million)
Chart on UAE - Year-over-year growth 2025-2030 (%)
Data Table on UAE - Year-over-year growth 2025-2030 (%)

12.6.5 Colombia - Market size and forecast 2025-2030

Chart on Colombia - Market size and forecast 2025-2030 ($ million)
Data Table on Colombia - Market size and forecast 2025-2030 ($ million)
Chart on Colombia - Year-over-year growth 2025-2030 (%)
Data Table on Colombia - Year-over-year growth 2025-2030 (%)

12.6.6 Turkey - Market size and forecast 2025-2030

Chart on Turkey - Market size and forecast 2025-2030 ($ million)
Data Table on Turkey - Market size and forecast 2025-2030 ($ million)
Chart on Turkey - Year-over-year growth 2025-2030 (%)
Data Table on Turkey - Year-over-year growth 2025-2030 (%)

12.6.7 South Africa - Market size and forecast 2025-2030

Chart on South Africa - Market size and forecast 2025-2030 ($ million)
Data Table on South Africa - Market size and forecast 2025-2030 ($ million)
Chart on South Africa - Year-over-year growth 2025-2030 (%)
Data Table on South Africa - Year-over-year growth 2025-2030 (%)

12.6.8 Israel - Market size and forecast 2025-2030

Chart on Israel - Market size and forecast 2025-2030 ($ million)
Data Table on Israel - Market size and forecast 2025-2030 ($ million)
Chart on Israel - Year-over-year growth 2025-2030 (%)
Data Table on Israel - Year-over-year growth 2025-2030 (%)

12.7 Market opportunity by geography

Market opportunity by geography ($ million)
Data Tables on Market opportunity by geography ($ million)

13. Drivers, Challenges, and Opportunity

13.1 Market drivers

Rise in prevalence of cataract among geriatric population
Increased efficiency of optical biometry over ultrasound A-scans
Favorable reimbursement conditions for optical biometry services

13.2 Market challenges

Supply chain and quality control issues
Inherent limitations associated with optical biometry devices
Rising competition among manufacturers of optical biometry devices

13.3 Impact of drivers and challenges

Impact of drivers and challenges in 2025 and 2030

13.4 Market opportunities

Rise in technological advances in global optical biometry devices market
Increasing demand for ophthalmologists and low-cost eye care services
Shift toward ASCs for eye care

14. Competitive Landscape

14.1 Overview

14.2

Overview on criticality of inputs and factors of differentiation

14.3 Landscape disruption

Overview on factors of disruption

14.4 Industry risks

Impact of key risks on business

15. Competitive Analysis

15.1 Companies profiled

Companies covered

15.2 Company ranking index

15.3 Market positioning of companies

Matrix on companies position and classification

15.4 Canon Inc.

Canon Inc. - Overview
Canon Inc. - Business segments
Canon Inc. - Key offerings
Canon Inc. - Segment focus
SWOT

15.5 Carl Zeiss AG

Carl Zeiss AG - Overview
Carl Zeiss AG - Product / Service
Carl Zeiss AG - Key news
Carl Zeiss AG - Key offerings
SWOT

15.6 Haag Streit AG

Haag Streit AG - Overview
Haag Streit AG - Product / Service
Haag Streit AG - Key offerings
SWOT

15.7 HEINE Optotechnik GmbH

HEINE Optotechnik GmbH - Overview
HEINE Optotechnik GmbH - Product / Service
HEINE Optotechnik GmbH - Key offerings
SWOT

15.8 HOYA CORP.

HOYA CORP. - Overview
HOYA CORP. - Business segments
HOYA CORP. - Key offerings
HOYA CORP. - Segment focus
SWOT

15.9 Metall Zug AG

Metall Zug AG - Overview
Metall Zug AG - Business segments
Metall Zug AG - Key offerings
Metall Zug AG - Segment focus
SWOT

15.10 Nidek Co. Ltd.

Nidek Co. Ltd. - Overview
Nidek Co. Ltd. - Product / Service
Nidek Co. Ltd. - Key offerings
SWOT

15.11 OCULUS Optikgerate GmbH

OCULUS Optikgerate GmbH - Overview
OCULUS Optikgerate GmbH - Product / Service
OCULUS Optikgerate GmbH - Key offerings
SWOT

15.12 Optovue Inc.

Optovue Inc. - Overview
Optovue Inc. - Product / Service
Optovue Inc. - Key offerings
SWOT

15.13 Revenio Group Oyj

Revenio Group Oyj - Overview
Revenio Group Oyj - Product / Service
Revenio Group Oyj - Key offerings
SWOT

15.14 Santec Corp.

Santec Corp. - Overview
Santec Corp. - Product / Service
Santec Corp. - Key offerings
SWOT

15.15 Tomey Corp.

Tomey Corp. - Overview
Tomey Corp. - Product / Service
Tomey Corp. - Key offerings
SWOT

15.16 Topcon Corp.

Topcon Corp. - Overview
Topcon Corp. - Business segments
Topcon Corp. - Key offerings
Topcon Corp. - Segment focus
SWOT

15.17 US Ophthalmic LLC

US Ophthalmic LLC - Overview
US Ophthalmic LLC - Product / Service
US Ophthalmic LLC - Key offerings
SWOT

15.18 VISIONIX USA INC.

VISIONIX USA INC. - Overview
VISIONIX USA INC. - Product / Service
VISIONIX USA INC. - Key offerings
SWOT

16. Appendix

16.1 Scope of the report

Market definition
Objectives
Notes and caveats

16.2 Inclusions and exclusions checklist

Inclusions checklist
Exclusions checklist

16.3 Currency conversion rates for US$

16.4 Research methodology

16.5 Data procurement

Information sources

16.6 Data validation

16.7 Validation techniques employed for market sizing

16.8 Data synthesis

16.9 360 degree market analysis

16.10 List of abbreviations

Research Methodology

Technavio presents a detailed picture of the market by way of study, synthesis, and summation of data from multiple sources. The analysts have presented the various facets of the market with a particular focus on identifying the key industry influencers. The data thus presented is comprehensive, reliable, and the result of extensive research, both primary and secondary.

INFORMATION SOURCES

Primary sources

  • Manufacturers and suppliers
  • Channel partners
  • Industry experts
  • Strategic decision makers

Secondary sources

  • Industry journals and periodicals
  • Government data
  • Financial reports of key industry players
  • Historical data
  • Press releases

DATA ANALYSIS

Data Synthesis

  • Collation of data
  • Estimation of key figures
  • Analysis of derived insights

Data Validation

  • Triangulation with data models
  • Reference against proprietary databases
  • Corroboration with industry experts

REPORT WRITING

Qualitative

  • Market drivers
  • Market challenges
  • Market trends
  • Five forces analysis

Quantitative

  • Market size and forecast
  • Market segmentation
  • Geographical insights
  • Competitive landscape

Interested in this report?

Get your sample now to see our research methodology and insights!

Download Now

Frequently Asked Questions

Optical Biometry Devices market growth will increase by USD 106.1 million during 2026-2030.

The Optical Biometry Devices market is expected to grow at a CAGR of 5.4% during 2026-2030.

Optical Biometry Devices market is segmented by End-user (Hospitals, ASCs, Others) Product (SS-OCT-based optical biometers, OLCR-based optical biometers, PCI-based optical biometers) Product type (Non-contact type, Contact type)

AMETEK Inc., Bausch Lomb Corp., Baxter International Inc., Canon Inc., Carl Zeiss AG, Haag Streit AG, HEINE Optotechnik GmbH, HOYA CORP., Metall Zug AG, Nidek Co. Ltd., OCULUS Optikgerate GmbH, Optovue Inc., Revenio Group Oyj, Santec Corp., Tomey Corp., Topcon Corp., US Ophthalmic LLC, VISIONIX USA INC., Ziemer Group are a few of the key vendors in the Optical Biometry Devices market.

North America will register the highest growth rate of 35.6% among the other regions. Therefore, the Optical Biometry Devices market in North America is expected to garner significant business opportunities for the vendors during the forecast period.

US, Canada, Mexico, Germany, UK, France, Italy, The Netherlands, Spain, China, India, Japan, South Korea, Thailand, Indonesia, Brazil, Saudi Arabia, Argentina, UAE, Colombia, Turkey, South Africa, Israel

  • Rise in prevalence of cataract among geriatric population is the driving factor this market.

The Optical Biometry Devices market vendors should focus on grabbing business opportunities from the End-user segment as it accounted for the largest market share in the base year.