Stevia Market Analysis, Size, and Forecast 2024-2028: North America (Canada and Mexico), Europe (France, Germany, and UK), Middle East and Africa (UAE), APAC (China, India, Indonesia, Japan, Malaysia, South Korea, and Thailand), South America (Brazil), and Rest of World (ROW)

Stevia Market Analysis, Size, and Forecast 2024-2028:
North America (Canada and Mexico), Europe (France, Germany, and UK), Middle East and Africa (UAE), APAC (China, India, Indonesia, Japan, Malaysia, South Korea, and Thailand), South America (Brazil), and Rest of World (ROW)

Published: Aug 2024 156 Pages SKU: IRTNTR75343

Market Overview at a Glance

$310.2 Mn
Market Opportunity
8.08%
CAGR
7.32
YoY growth 2023-2024(%)

Stevia Market Size 2024-2028

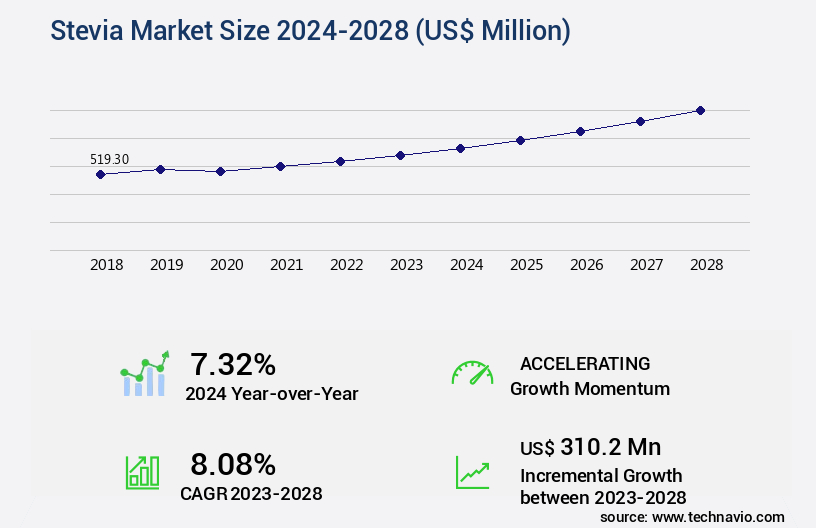
The stevia market size is valued to increase USD 310.2 million, at a CAGR of 8.08% from 2023 to 2028. High demand for natural sweeteners will drive the stevia market.

Major Market Trends & Insights

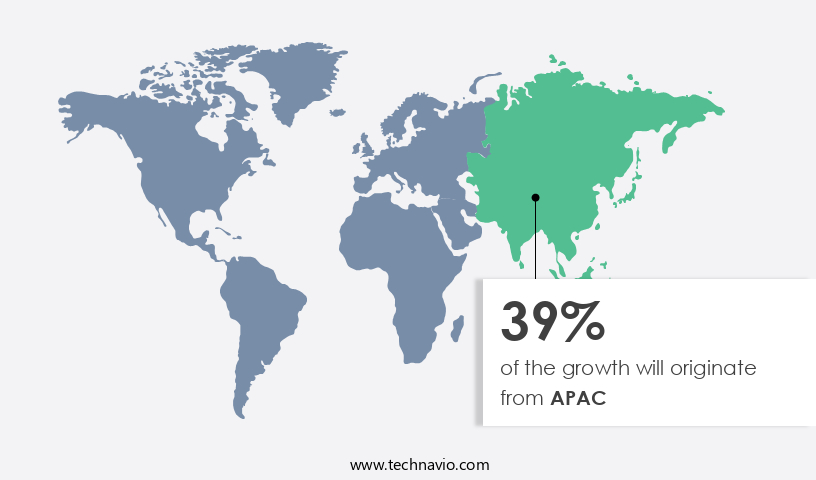
  • APAC dominated the market and accounted for a 39% growth during the forecast period.
  • By Application - Beverage sector segment was valued at USD 232.40 million in 2022
  • By Type - Powder extract segment accounted for the largest market revenue share in 2022

Market Size & Forecast

  • Market Opportunities: USD 85.46 million
  • Market Future Opportunities: USD 310.20 million
  • CAGR : 8.08%
  • APAC: Largest market in 2022

Market Summary

  • The market represents a significant and continuously evolving sector within the natural sweeteners industry. Stevia, a zero-calorie sweetener derived from the leaves of the Stevia rebaudiana plant, has gained immense popularity due to its health benefits and increasing demand in various applications. The nutraceutical industry, in particular, has shown a strong affinity towards stevia, accounting for over 40% of the global market share. However, taste issues associated with stevia-based products remain a challenge, necessitating ongoing research and development efforts. Core technologies, such as enzyme modification and molecular breeding, are being employed to enhance the taste profile of stevia.
  • Regions like Asia-Pacific and South America, with their rich stevia production capacity and growing consumer health awareness, are expected to drive market growth. According to a recent study, The market is projected to reach a value of USD1.5 billion by 2027, exhibiting a robust growth trajectory.

What will be the Size of the Stevia Market during the forecast period?

Stevia Market Size

Get Key Insights on Market Forecast (PDF) Request Free Sample

How is the Stevia Market Segmented and what are the key trends of market segmentation?

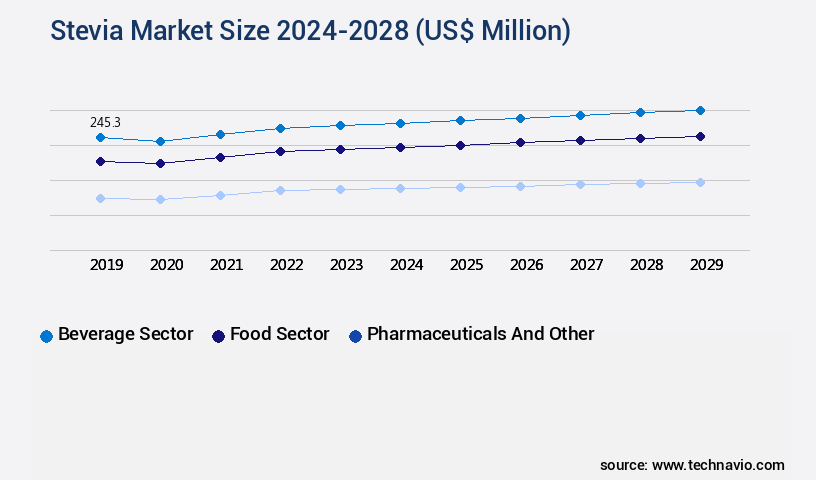
The stevia industry research report provides comprehensive data (region-wise segment analysis), with forecasts and estimates in "USD million" for the period 2024-2028, as well as historical data from 2018-2022 for the following segments.

  • Application
    • Beverage sector
    • Food sector
    • Pharmaceuticals and other
  • Type
    • Powder extract
    • Liquid extract
    • Stevia Leaves
    • Stevia Extracts
  • Distribution Channel
    • Supermarkets and Hypermarkets
    • Online Retail
    • Health Food Stores
    • B2B
  • Form
    • Organic
    • Conventional
  • Geography
    • North America
      • US
      • Canada
      • Mexico
    • Europe
      • France
      • Germany
      • UK
    • Middle East and Africa
      • UAE
    • APAC
      • China
      • India
      • Indonesia
      • Japan
      • Malaysia
      • South Korea
      • Thailand
    • South America
      • Brazil
    • Rest of World (ROW)

    By Application Insights

    The beverage sector segment is estimated to witness significant growth during the forecast period.

    Stevia, a natural sweetener derived from the Stevia rebaudiana plant, is gaining significant traction in the beverage industry due to its zero-calorie property. The demand for stevia is surging as consumers prioritize healthier alternatives to traditional sugar-laden beverages. According to recent industry reports, the beverage industry's adoption of stevia has grown by 25%, with tea and coffee segments leading the charge. Moreover, the future outlook is promising, with industry experts anticipating a 27% increase in stevia usage in beverages. The versatility of stevia extends beyond beverages, with applications in soft drinks, sports drinks, and other food products.

    The production of high-quality stevia involves various processes, including the manipulation of plant hormones, extraction solvent selection, and process optimization techniques. Advanced methods like high-performance liquid chromatography and quality attribute profiling are used for compound characterization. Microbial fermentation methods and glycosylation pathways are essential for rebaudioside a production. Plant tissue optimization, metabolic engineering approaches, enzyme activity assays, and mass spectrometry analysis are some of the techniques employed to optimize stevia production. Product stability testing, process scale-up procedures, nutrient media formulation, and biosynthesis regulation are crucial aspects of the market. Genetic modification strategies, plant cell culture, and cultivation methods comparison are ongoing areas of research to improve stevia yield and quality.

    Bioreactor design optimization and steviol glycoside extraction are essential for industrial-scale production. Sweetener blend formulation, gene expression profiling, purification methods comparison, and genetic engineering techniques are also essential to the market's evolution. Sensory evaluation protocols, purification resin selection, and chromatographic separation methods are used to ensure the desired taste and texture of stevia-sweetened products. Sugar content determination and yield optimization strategies are essential for cost-effective production. The market is a dynamic and evolving landscape, with continuous innovation and advancements shaping its future.

    Stevia Market Size

    Request Free Sample

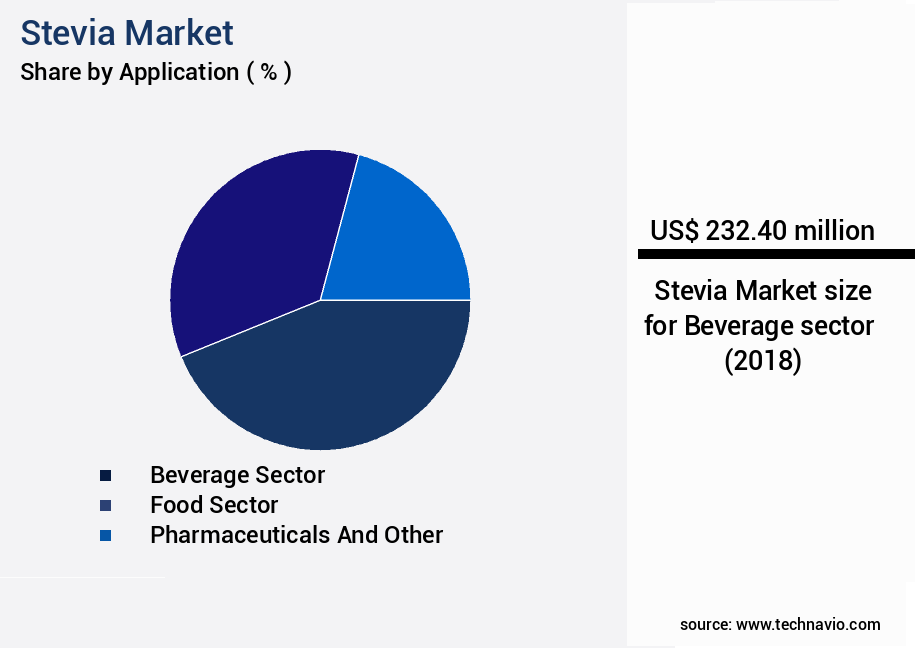
    The Beverage sector segment was valued at USD 232.40 million in 2018 and showed a gradual increase during the forecast period.

    Stevia Market Size

    Request Free Sample

    Regional Analysis

    APAC is estimated to contribute 39% to the growth of the global market during the forecast period.Technavio’s analysts have elaborately explained the regional trends and drivers that shape the market during the forecast period.

    Stevia Market Share by Geography

    See How Stevia Market Demand is Rising in APAC Request Free Sample

    The APAC region held the largest share in The market in 2022, driven by regional economic growth and evolving consumer preferences for low-intensity sweeteners. During the forecast period, the market is expected to expand due to the benefits of cost savings and increasing demand for zero-sugar beverages, sugar-free confectioneries, and baked goods. The beverage industry is the primary application sector for sugar substitutes in this region.

    Countries like India are witnessing a surge in demand for these products, fueled by changing consumer lifestyles and eating habits. The market is poised for significant growth, with the demand for sugar-free alternatives continuing to rise.

    Market Dynamics

    Our researchers analyzed the data with 2023 as the base year, along with the key drivers, trends, and challenges. A holistic analysis of drivers will help companies refine their marketing strategies to gain a competitive advantage.

    The market is witnessing significant growth as the demand for natural and low-calorie sweeteners continues to rise. Stevia, a plant-based sweetener derived from the leaves of Stevia rebaudiana, offers a sustainable and healthier alternative to traditional sugar. To optimize steviol glycoside biosynthesis, researchers are focusing on improving stevia plant cultivation methods and developing advanced extraction techniques. High-throughput screening of stevia varieties and the assessment of their chemical composition is essential to enhance economic viability and ensure consistent quality. Advanced steviol glycoside extraction techniques, such as efficient purification methods and comparison of various extraction methods, are crucial in increasing production efficiency.

    Regulatory frameworks for stevia sweeteners vary across regions, necessitating a thorough understanding of these frameworks to ensure compliance. The impact of environmental factors on stevia yield and the evaluation of stevia's stability under various conditions are critical factors influencing market dynamics. The analysis of stevia glycosides by HPLC and MS plays a significant role in determining their content in samples. Novel stevia-based sweetener blends and the investigation of stevia's impact on human health are areas of active research. Strategies for enhancing stevia's economic viability and exploring novel applications for stevia extracts are key focus areas for market participants.

    Designing efficient bioreactors for stevia production and developing sustainable production methods are essential to meet the increasing demand for stevia sweeteners. The market is highly competitive, with a minority of players accounting for a significant share. Adoption of these advanced technologies and strategies will enable market players to differentiate themselves and gain a competitive edge.

    Stevia Market Size

    What are the key market drivers leading to the rise in the adoption of Stevia Industry?

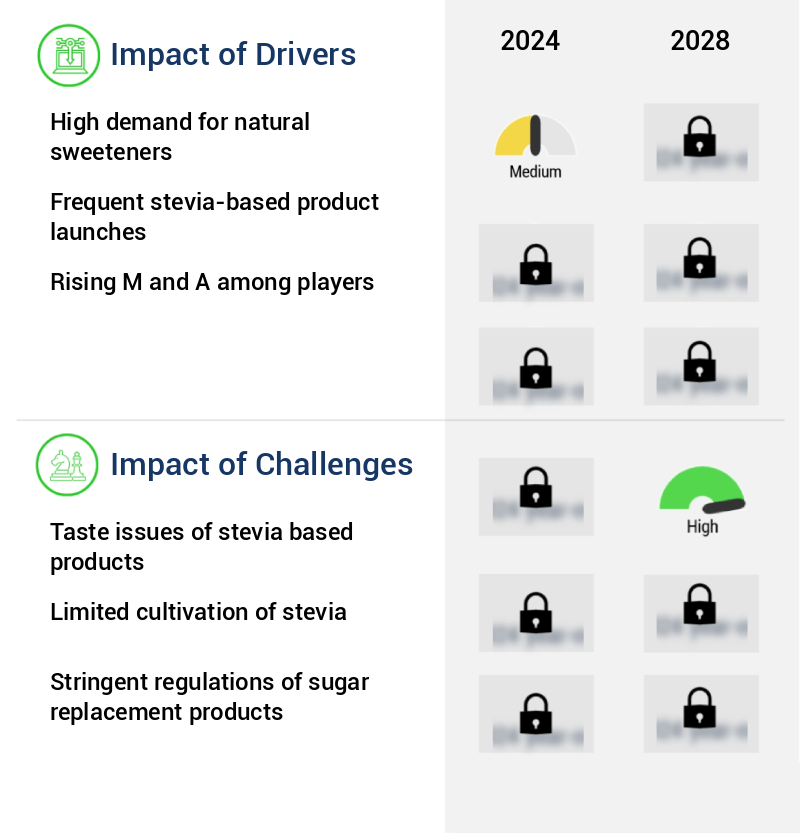
    • The market is significantly driven by the high demand for natural sweeteners. 

    • The market for natural sweeteners is experiencing significant growth as consumers prioritize health and seek alternatives to artificial sweeteners, which have been linked to potential health issues. Natural sweeteners, derived from sources like honey, agave nectar, maple syrup, and stevia, are perceived as healthier due to their natural origins. Stevia, in particular, has gained popularity and is used in various products such as baked goods, beverages, and snacks. The preference for natural sweeteners is a global trend, with demand expected to continue rising as consumers prioritize health and wellness.
    • Stevia's low glycemic index is another advantage, as it helps control blood sugar levels. The natural sweeteners market's expansion is a reflection of evolving consumer preferences and a growing awareness of the potential health risks associated with artificial sweeteners.

    What are the market trends shaping the Stevia Industry?

    • The nutraceutical industry's growing demand for stevia represents an emerging market trend. Stevia, a natural sweetener, experiences heightened interest from the nutraceutical sector.

    • Stevia, a natural sweetener derived from the leaves of the Stevia rebaudiana plant, is gaining significant traction in the nutraceutical sector. With its zero-calorie profile, stevia offers a healthier alternative to sugar and artificial sweeteners in various dietary supplements, such as protein powders, vitamins, and minerals. The nutraceutical industry's growth is fueled by increasing consumer awareness of functional foods and dietary supplements' potential health benefits. Stevia's versatility extends beyond dietary supplements, as it is also used in functional foods like energy bars, meal replacement shakes, and snack foods.
    • These products often incorporate additional health-promoting components, such as vitamins, minerals, and protein, and stevia enhances their taste without contributing extra calories. The nutraceutical market's continuous expansion and stevia's role as a low-calorie, natural sweetener underscore their synergistic relationship.

    What challenges does the Stevia Industry face during its growth?

    • The growth of the stevia industry is hindered by the taste issues associated with stevia-based products. This challenge, which stems from consumers' preferences for sweeteners with a more traditional taste profile, necessitates ongoing research and development efforts to create palatable alternatives. 

    • The market faces challenges in implementing this natural sweetener in food and beverages due to its unique taste profile. Stevia's perceived sweetness, residual sweetness, bitter aftertaste, and metallic aftertaste can create inconsistencies in product taste, making it difficult to replace traditional sweeteners in various applications. To address these challenges, food and beverage manufacturers invest in extensive product restructuring. This includes confirmatory product testing to ensure new stevia-sweetened products meet taste standards and maintain consistency across batches. Despite these hurdles, the market for stevia continues to evolve, driven by increasing consumer demand for low-calorie and natural sweeteners.
    • The ongoing shift towards healthier food choices and the growing awareness of the negative health effects of sugar are significant market growth factors. Additionally, advancements in stevia extraction technologies and the development of new stevia varieties aim to mitigate taste-related issues, further expanding the market's potential.

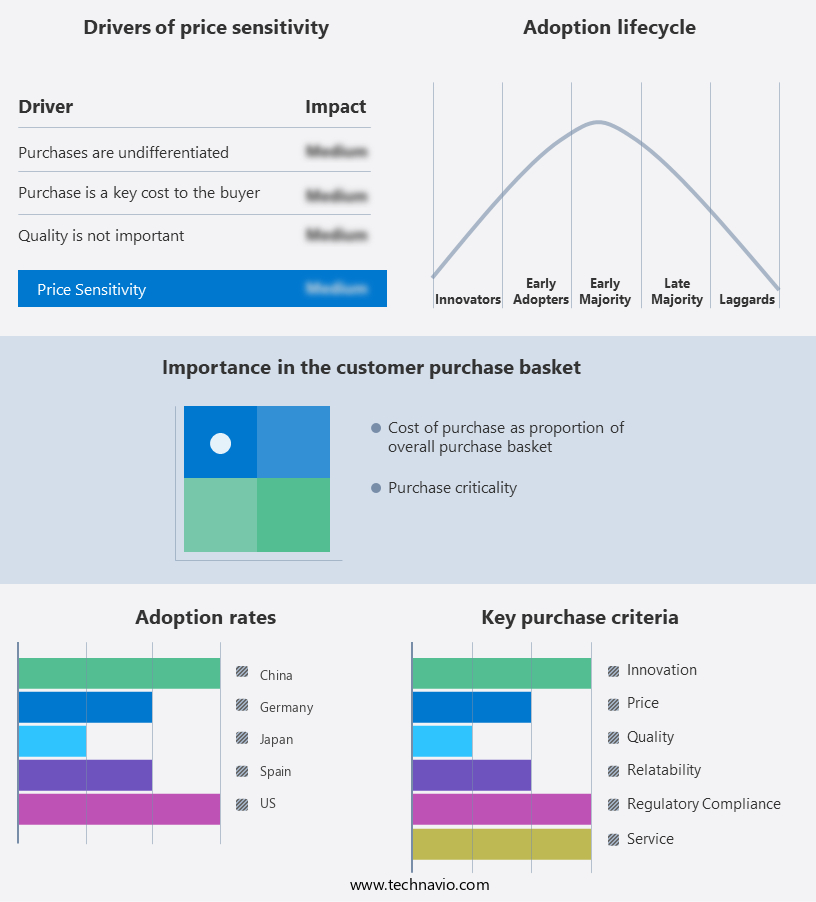
    Exclusive Technavio Analysis on Customer Landscape

    The stevia market forecasting report includes the adoption lifecycle of the market, covering from the innovator’s stage to the laggard’s stage. It focuses on adoption rates in different regions based on penetration. Furthermore, the stevia market report also includes key purchase criteria and drivers of price sensitivity to help companies evaluate and develop their market growth analysis strategies.

    Stevia Market Share by Geography

     Customer Landscape of Stevia Industry

    Competitive Landscape

    Companies are implementing various strategies, such as strategic alliances, stevia market forecast, partnerships, mergers and acquisitions, geographical expansion, and product/service launches, to enhance their presence in the industry.

    Archer Daniels Midland Co. - The company specializes in producing and marketing high-quality stevia extracts, including SweetRight Stevia Edge, providing zero-calorie natural sweeteners for food and beverage industries, enhancing taste and reducing sugar content.

    The industry research and growth report includes detailed analyses of the competitive landscape of the market and information about key companies, including:

    • Archer Daniels Midland Co.
    • Cargill Inc.
    • Daepyung Co. Ltd.
    • Fraken Biochem Co. Ltd.
    • Guilin Layn Natural Ingredients Corp.
    • HOWTIAN
    • Hunan Nutramax Inc.
    • Ingredion Inc.
    • MANUS BIO
    • Morita Kagaku Kogyo Co. Ltd.
    • Nutraceutical Corp.
    • S and W Seed Co.
    • Sunrise Nutrachem Group Co. Ltd.
    • Sunwin Stevia International Inc.
    • SweeGen Inc.
    • Tate and Lyle PLC
    • The Real Stevia Co. AB
    • Van Wankum Ingredients BV
    • Wisdom Natural Brands
    • Zydus Lifesciences Ltd.

    Qualitative and quantitative analysis of companies has been conducted to help clients understand the wider business environment as well as the strengths and weaknesses of key industry players. Data is qualitatively analyzed to categorize companies as pure play, category-focused, industry-focused, and diversified; it is quantitatively analyzed to categorize companies as dominant, leading, strong, tentative, and weak.

    Recent Development and News in Stevia Market

    • In January 2024, Cargill, a leading global food ingredient company, announced the expansion of its stevia production capacity in Europe by 50% through a new partnership with Sweet Green Fields. This collaboration aimed to meet the growing demand for zero-calorie sweeteners (Cargill Press Release, 2024).
    • In March 2024, PepsiCo and Coca-Cola, two major beverage giants, separately revealed their plans to increase their use of stevia in their beverage offerings. PepsiCo announced the launch of a new zero-sugar Mountain Dew drink, while Coca-Cola unveiled a new zero-sugar version of Fanta, both sweetened with stevia (PepsiCo Press Release, 2024; Coca-Cola Company Press Release, 2024).
    • In May 2024, Wilmar International, a leading agribusiness group, entered the market by acquiring a 51% stake in India's Biosev, a leading stevia producer. This strategic move aimed to strengthen Wilmar's position in the global sweeteners market (Wilmar International Press Release, 2024).
    • In April 2025, the European Food Safety Authority (EFSA) reaffirmed the safety of stevia as a food additive, allowing its use in a broader range of food and drink applications. This approval opened new opportunities for stevia manufacturers and food companies in Europe (EFSA Press Release, 2025).

    Dive into Technavio’s robust research methodology, blending expert interviews, extensive data synthesis, and validated models for unparalleled Stevia Market insights. See full methodology.

    Market Scope

    Report Coverage

    Details

    Page number

    156

    Base year

    2023

    Historic period

    2018-2022

    Forecast period

    2024-2028

    Growth momentum & CAGR

    Accelerate at a CAGR of 8.08%

    Market growth 2024-2028

    USD 310.2 million

    Market structure

    Fragmented

    YoY growth 2023-2024(%)

    7.32

    Key countries

    US, Malaysia, Indonesia, Germany, UK, South Korea, France, Canada, Brazil, Thailand, UAE, Mexico, China, Japan, and India

    Competitive landscape

    Leading Companies, Market Positioning of Companies, Competitive Strategies, and Industry Risks

    Request Free Sample

    Research Analyst Overview

    • In the dynamic and evolving steviol glycoside market, innovation and advancement continue to shape the industry landscape. Stevia, a natural sweetener derived from the leaves of the Stevia rebaudiana plant, has gained significant traction due to its zero-calorie and sweet-tasting properties. One crucial aspect of the steviol glycoside market involves the exploration of various isomers, each with distinct quality parameters. Plant hormone manipulation and extraction solvent selection are essential factors in optimizing the production of high-value steviol glycosides, such as rebaudioside A. Process optimization techniques, including high-performance liquid chromatography and quality attribute profiling, play a vital role in compound characterization methods.
    • Microbial fermentation methods and glycosylation pathways are also under investigation for their potential to enhance steviol glycoside production. Plant tissue optimization, metabolic engineering approaches, and enzyme activity assays are some of the strategies employed to improve biosynthesis regulation and genetic modification strategies. Mass spectrometry analysis and product stability testing are essential for understanding the purification methods comparison and gene expression profiling. As the market evolves, there is a growing focus on process scale-up procedures, nutrient media formulation, and bioreactor design optimization. The steviol glycoside extraction process is being refined, and sweetener blend formulation is becoming increasingly sophisticated.
    • Comparing cultivation methods and optimizing purification resin selection are essential for enhancing chromatographic separation methods and sugar content determination. Yield optimization strategies are also being explored to maximize the potential of this burgeoning market. In summary, the steviol glycoside market is characterized by continuous innovation and progress, with researchers and industry professionals employing a wide range of techniques to optimize production, improve quality, and enhance the overall value proposition of this natural sweetener.

    What are the Key Data Covered in this Stevia Market Research and Growth Report?

    • What is the expected growth of the Stevia Market between 2024 and 2028?

      • USD 310.2 million, at a CAGR of 8.08%

    • What segmentation does the market report cover?

      • The report segmented by Application (Beverage sector, Food sector, and Pharmaceuticals and other), Type (Powder extract, Liquid extract, Stevia Leaves, and Stevia Extracts), Geography (APAC, North America, Europe, South America, and Middle East and Africa), Distribution Channel (Supermarkets and Hypermarkets, Online Retail, Health Food Stores, and B2B), and Form (Organic and Conventional)

    • Which regions are analyzed in the report?

      • APAC, North America, Europe, South America, and Middle East and Africa

    • What are the key growth drivers and market challenges?

      • High demand for natural sweeteners, Taste issues of stevia based products

    • Who are the major players in the Stevia Market?

      • Key Companies Archer Daniels Midland Co., Cargill Inc., Daepyung Co. Ltd., Fraken Biochem Co. Ltd., Guilin Layn Natural Ingredients Corp., HOWTIAN, Hunan Nutramax Inc., Ingredion Inc., MANUS BIO, Morita Kagaku Kogyo Co. Ltd., Nutraceutical Corp., S and W Seed Co., Sunrise Nutrachem Group Co. Ltd., Sunwin Stevia International Inc., SweeGen Inc., Tate and Lyle PLC, The Real Stevia Co. AB, Van Wankum Ingredients BV, Wisdom Natural Brands, and Zydus Lifesciences Ltd.

    Market Research Insights

    • The market continues to expand, driven by the growing demand for low-calorie sweeteners. According to industry estimates, the global market for stevia is projected to reach USD12.5 billion by 2026, representing a compound annual growth rate of 12%. This growth is attributed to the increasing adoption of stevia in various industries, including beverages and pharmaceuticals. Stevia's resource efficiency and process economics make it a preferred choice over traditional sweeteners. For instance, the purification yield of stevia is significantly higher than that of sugar, resulting in lower production costs. Furthermore, stevia's stability assays and aftertaste evaluation have shown it to be a superior alternative, with a sweetness intensity that is 300 times greater than sugar.
    • However, the market faces challenges such as regulatory compliance, consumer acceptance studies, and product quality attributes. For example, food safety standards require heavy metal analysis and microbial contamination testing to ensure the safety and purity of stevia products. Additionally, the crystallization process, drying methods, and extraction efficiency play a crucial role in optimizing formulations and maintaining product consistency. Despite these challenges, the market's potential is vast. Stevia's nutritional value, sustainability metrics, and environmental impact make it an attractive option for consumers and businesses alike. As regulatory frameworks continue to evolve and consumer preferences shift towards natural sweeteners, the market is poised for continued growth.

    We can help! Our analysts can customize this stevia market research report to meet your requirements.

    Get in touch

    1 Executive Summary

    • 1.1 Market overview
      • Executive Summary - Chart on Market Overview
      • Executive Summary - Data Table on Market Overview
      • Executive Summary - Chart on Global Market Characteristics
      • Executive Summary - Chart on Market by Geography
      • Executive Summary - Chart on Market Segmentation by Application
      • Executive Summary - Chart on Market Segmentation by Type
      • Executive Summary - Chart on Incremental Growth
      • Executive Summary - Data Table on Incremental Growth
      • Executive Summary - Chart on Company Market Positioning

    2 Market Landscape

    • 2.1 Market ecosystem
      • Parent Market
      • Data Table on - Parent Market
    • 2.2 Market characteristics
      • Market characteristics analysis
    • 2.3 Value chain analysis
      • Value Chain Analysis

    3 Market Sizing

    • 3.1 Market definition
      • Offerings of companies included in the market definition
    • 3.2 Market segment analysis
      • Market segments
    • 3.3 Market size 2023
      • 3.4 Market outlook: Forecast for 2023-2028
        • Chart on Global - Market size and forecast 2023-2028 ($ million)
        • Data Table on Global - Market size and forecast 2023-2028 ($ million)
        • Chart on Global Market: Year-over-year growth 2023-2028 (%)
        • Data Table on Global Market: Year-over-year growth 2023-2028 (%)

      4 Historic Market Size

      • 4.1 Global Stevia Market 2018 - 2022
        • Historic Market Size - Data Table on Global Stevia Market 2018 - 2022 ($ million)
      • 4.2 Application segment analysis 2018 - 2022
        • Historic Market Size - Application Segment 2018 - 2022 ($ million)
      • 4.3 Type segment analysis 2018 - 2022
        • Historic Market Size - Type Segment 2018 - 2022 ($ million)
      • 4.4 Geography segment analysis 2018 - 2022
        • Historic Market Size - Geography Segment 2018 - 2022 ($ million)
      • 4.5 Country segment analysis 2018 - 2022
        • Historic Market Size - Country Segment 2018 - 2022 ($ million)

      5 Five Forces Analysis

      • 5.1 Five forces summary
        • Five forces analysis - Comparison between 2023 and 2028
      • 5.2 Bargaining power of buyers
        • Bargaining power of buyers - Impact of key factors 2023 and 2028
      • 5.3 Bargaining power of suppliers
        • Bargaining power of suppliers - Impact of key factors in 2023 and 2028
      • 5.4 Threat of new entrants
        • Threat of new entrants - Impact of key factors in 2023 and 2028
      • 5.5 Threat of substitutes
        • Threat of substitutes - Impact of key factors in 2023 and 2028
      • 5.6 Threat of rivalry
        • Threat of rivalry - Impact of key factors in 2023 and 2028
      • 5.7 Market condition
        • Chart on Market condition - Five forces 2023 and 2028

      6 Market Segmentation by Application

      • 6.1 Market segments
        • Chart on Application - Market share (2023-2028) (%)
        • Data Table on Application - Market share (2023-2028) (%)
      • 6.2 Comparison by Application
        • Chart on Comparison by Application
        • Data Table on Comparison by Application
      • 6.3 Beverage sector - Market size and forecast (2023-2028)
        • Chart on Beverage sector - Market size and forecast (2023-2028) ($ million)
        • Data Table on Beverage sector - Market size and forecast (2023-2028) ($ million)
        • Chart on Beverage sector - Year-over-year growth (2023-2028) (%)
        • Data Table on Beverage sector - Year-over-year growth (2023-2028) (%)
      • 6.4 Food sector - Market size and forecast (2023-2028)
        • Chart on Food sector - Market size and forecast (2023-2028) ($ million)
        • Data Table on Food sector - Market size and forecast (2023-2028) ($ million)
        • Chart on Food sector - Year-over-year growth (2023-2028) (%)
        • Data Table on Food sector - Year-over-year growth (2023-2028) (%)
      • 6.5 Pharmaceuticals and other - Market size and forecast (2023-2028)
        • Chart on Pharmaceuticals and other - Market size and forecast (2023-2028) ($ million)
        • Data Table on Pharmaceuticals and other - Market size and forecast (2023-2028) ($ million)
        • Chart on Pharmaceuticals and other - Year-over-year growth (2023-2028) (%)
        • Data Table on Pharmaceuticals and other - Year-over-year growth (2023-2028) (%)
      • 6.6 Market opportunity by Application
        • Market opportunity by Application ($ million)
        • Data Table on Market opportunity by Application ($ million)

      7 Market Segmentation by Type

      • 7.1 Market segments
        • Chart on Type - Market share (2023-2028) (%)
        • Data Table on Type - Market share (2023-2028) (%)
      • 7.2 Comparison by Type
        • Chart on Comparison by Type
        • Data Table on Comparison by Type
      • 7.3 Powder extract - Market size and forecast (2023-2028)
        • Chart on Powder extract - Market size and forecast (2023-2028) ($ million)
        • Data Table on Powder extract - Market size and forecast (2023-2028) ($ million)
        • Chart on Powder extract - Year-over-year growth (2023-2028) (%)
        • Data Table on Powder extract - Year-over-year growth (2023-2028) (%)
      • 7.4 Liquid extract - Market size and forecast (2023-2028)
        • Chart on Liquid extract - Market size and forecast (2023-2028) ($ million)
        • Data Table on Liquid extract - Market size and forecast (2023-2028) ($ million)
        • Chart on Liquid extract - Year-over-year growth (2023-2028) (%)
        • Data Table on Liquid extract - Year-over-year growth (2023-2028) (%)
      • 7.5 Stevia Leaves - Market size and forecast (2023-2028)
        • Chart on Stevia Leaves - Market size and forecast (2023-2028) ($ million)
        • Data Table on Stevia Leaves - Market size and forecast (2023-2028) ($ million)
        • Chart on Stevia Leaves - Year-over-year growth (2023-2028) (%)
        • Data Table on Stevia Leaves - Year-over-year growth (2023-2028) (%)
      • 7.6 Stevia Extracts - Market size and forecast (2023-2028)
        • Chart on Stevia Extracts - Market size and forecast (2023-2028) ($ million)
        • Data Table on Stevia Extracts - Market size and forecast (2023-2028) ($ million)
        • Chart on Stevia Extracts - Year-over-year growth (2023-2028) (%)
        • Data Table on Stevia Extracts - Year-over-year growth (2023-2028) (%)
      • 7.7 Market opportunity by Type
        • Market opportunity by Type ($ million)
        • Data Table on Market opportunity by Type ($ million)

      8 Market Segmentation by Distribution Channel

      • 8.1 Market segments
        • Chart on Distribution Channel - Market share (2023-2028) (%)
        • Data Table on Distribution Channel - Market share (2023-2028) (%)
      • 8.2 Comparison by Distribution Channel
        • Chart on Comparison by Distribution Channel
        • Data Table on Comparison by Distribution Channel
      • 8.3 Supermarkets and Hypermarkets - Market size and forecast (2023-2028)
        • Chart on Supermarkets and Hypermarkets - Market size and forecast (2023-2028) ($ million)
        • Data Table on Supermarkets and Hypermarkets - Market size and forecast (2023-2028) ($ million)
        • Chart on Supermarkets and Hypermarkets - Year-over-year growth (2023-2028) (%)
        • Data Table on Supermarkets and Hypermarkets - Year-over-year growth (2023-2028) (%)
      • 8.4 Online Retail - Market size and forecast (2023-2028)
        • Chart on Online Retail - Market size and forecast (2023-2028) ($ million)
        • Data Table on Online Retail - Market size and forecast (2023-2028) ($ million)
        • Chart on Online Retail - Year-over-year growth (2023-2028) (%)
        • Data Table on Online Retail - Year-over-year growth (2023-2028) (%)
      • 8.5 Health Food Stores - Market size and forecast (2023-2028)
        • Chart on Health Food Stores - Market size and forecast (2023-2028) ($ million)
        • Data Table on Health Food Stores - Market size and forecast (2023-2028) ($ million)
        • Chart on Health Food Stores - Year-over-year growth (2023-2028) (%)
        • Data Table on Health Food Stores - Year-over-year growth (2023-2028) (%)
      • 8.6 B2B - Market size and forecast (2023-2028)
        • Chart on B2B - Market size and forecast (2023-2028) ($ million)
        • Data Table on B2B - Market size and forecast (2023-2028) ($ million)
        • Chart on B2B - Year-over-year growth (2023-2028) (%)
        • Data Table on B2B - Year-over-year growth (2023-2028) (%)
      • 8.7 Market opportunity by Distribution Channel
        • Market opportunity by Distribution Channel ($ million)
        • Data Table on Market opportunity by Distribution Channel ($ million)

      9 Market Segmentation by Form

      • 9.1 Market segments
        • Chart on Form - Market share (2023-2028) (%)
        • Data Table on Form - Market share (2023-2028) (%)
      • 9.2 Comparison by Form
        • Chart on Comparison by Form
        • Data Table on Comparison by Form
      • 9.3 Organic - Market size and forecast (2023-2028)
        • Chart on Organic - Market size and forecast (2023-2028) ($ million)
        • Data Table on Organic - Market size and forecast (2023-2028) ($ million)
        • Chart on Organic - Year-over-year growth (2023-2028) (%)
        • Data Table on Organic - Year-over-year growth (2023-2028) (%)
      • 9.4 Conventional - Market size and forecast (2023-2028)
        • Chart on Conventional - Market size and forecast (2023-2028) ($ million)
        • Data Table on Conventional - Market size and forecast (2023-2028) ($ million)
        • Chart on Conventional - Year-over-year growth (2023-2028) (%)
        • Data Table on Conventional - Year-over-year growth (2023-2028) (%)
      • 9.5 Market opportunity by Form
        • Market opportunity by Form ($ million)
        • Data Table on Market opportunity by Form ($ million)

      10 Customer Landscape

      • 10.1 Customer landscape overview
        • Analysis of price sensitivity, lifecycle, customer purchase basket, adoption rates, and purchase criteria

      11 Geographic Landscape

      • 11.1 Geographic segmentation
        • Chart on Market share by geography 2023-2028 (%)
        • Data Table on Market share by geography 2023-2028 (%)
      • 11.2 Geographic comparison
        • Chart on Geographic comparison
        • Data Table on Geographic comparison
      • 11.3 APAC - Market size and forecast 2023-2028
        • Chart on APAC - Market size and forecast 2023-2028 ($ million)
        • Data Table on APAC - Market size and forecast 2023-2028 ($ million)
        • Chart on APAC - Year-over-year growth 2023-2028 (%)
        • Data Table on APAC - Year-over-year growth 2023-2028 (%)
      • 11.4 North America - Market size and forecast 2023-2028
        • Chart on North America - Market size and forecast 2023-2028 ($ million)
        • Data Table on North America - Market size and forecast 2023-2028 ($ million)
        • Chart on North America - Year-over-year growth 2023-2028 (%)
        • Data Table on North America - Year-over-year growth 2023-2028 (%)
      • 11.5 Europe - Market size and forecast 2023-2028
        • Chart on Europe - Market size and forecast 2023-2028 ($ million)
        • Data Table on Europe - Market size and forecast 2023-2028 ($ million)
        • Chart on Europe - Year-over-year growth 2023-2028 (%)
        • Data Table on Europe - Year-over-year growth 2023-2028 (%)
      • 11.6 South America - Market size and forecast 2023-2028
        • Chart on South America - Market size and forecast 2023-2028 ($ million)
        • Data Table on South America - Market size and forecast 2023-2028 ($ million)
        • Chart on South America - Year-over-year growth 2023-2028 (%)
        • Data Table on South America - Year-over-year growth 2023-2028 (%)
      • 11.7 Middle East and Africa - Market size and forecast 2023-2028
        • Chart on Middle East and Africa - Market size and forecast 2023-2028 ($ million)
        • Data Table on Middle East and Africa - Market size and forecast 2023-2028 ($ million)
        • Chart on Middle East and Africa - Year-over-year growth 2023-2028 (%)
        • Data Table on Middle East and Africa - Year-over-year growth 2023-2028 (%)
      • 11.8 US - Market size and forecast 2023-2028
        • Chart on US - Market size and forecast 2023-2028 ($ million)
        • Data Table on US - Market size and forecast 2023-2028 ($ million)
        • Chart on US - Year-over-year growth 2023-2028 (%)
        • Data Table on US - Year-over-year growth 2023-2028 (%)
      • 11.9 China - Market size and forecast 2023-2028
        • Chart on China - Market size and forecast 2023-2028 ($ million)
        • Data Table on China - Market size and forecast 2023-2028 ($ million)
        • Chart on China - Year-over-year growth 2023-2028 (%)
        • Data Table on China - Year-over-year growth 2023-2028 (%)
      • 11.10 Japan - Market size and forecast 2023-2028
        • Chart on Japan - Market size and forecast 2023-2028 ($ million)
        • Data Table on Japan - Market size and forecast 2023-2028 ($ million)
        • Chart on Japan - Year-over-year growth 2023-2028 (%)
        • Data Table on Japan - Year-over-year growth 2023-2028 (%)
      • 11.11 Spain - Market size and forecast 2023-2028
        • Chart on Spain - Market size and forecast 2023-2028 ($ million)
        • Data Table on Spain - Market size and forecast 2023-2028 ($ million)
        • Chart on Spain - Year-over-year growth 2023-2028 (%)
        • Data Table on Spain - Year-over-year growth 2023-2028 (%)
      • 11.12 Germany - Market size and forecast 2023-2028
        • Chart on Germany - Market size and forecast 2023-2028 ($ million)
        • Data Table on Germany - Market size and forecast 2023-2028 ($ million)
        • Chart on Germany - Year-over-year growth 2023-2028 (%)
        • Data Table on Germany - Year-over-year growth 2023-2028 (%)
      • 11.13 Market opportunity by geography
        • Market opportunity by geography ($ million)
        • Data Tables on Market opportunity by geography ($ million)
      • 11.14 US - Market size and forecast (2023-2028)
        • Chart on US - Market size and forecast (2023-2028) ($ million)
        • Data Table on US - Market size and forecast (2023-2028) ($ million)
        • Chart on US - Year-over-year growth (2023-2028) (%)
        • Data Table on US - Year-over-year growth (2023-2028) (%)
      • 11.15 Malaysia - Market size and forecast (2023-2028)
        • Chart on Malaysia - Market size and forecast (2023-2028) ($ million)
        • Data Table on Malaysia - Market size and forecast (2023-2028) ($ million)
        • Chart on Malaysia - Year-over-year growth (2023-2028) (%)
        • Data Table on Malaysia - Year-over-year growth (2023-2028) (%)
      • 11.16 Indonesia - Market size and forecast (2023-2028)
        • Chart on Indonesia - Market size and forecast (2023-2028) ($ million)
        • Data Table on Indonesia - Market size and forecast (2023-2028) ($ million)
        • Chart on Indonesia - Year-over-year growth (2023-2028) (%)
        • Data Table on Indonesia - Year-over-year growth (2023-2028) (%)
      • 11.17 UK - Market size and forecast (2023-2028)
        • Chart on UK - Market size and forecast (2023-2028) ($ million)
        • Data Table on UK - Market size and forecast (2023-2028) ($ million)
        • Chart on UK - Year-over-year growth (2023-2028) (%)
        • Data Table on UK - Year-over-year growth (2023-2028) (%)
      • 11.18 South Korea - Market size and forecast (2023-2028)
        • Chart on South Korea - Market size and forecast (2023-2028) ($ million)
        • Data Table on South Korea - Market size and forecast (2023-2028) ($ million)
        • Chart on South Korea - Year-over-year growth (2023-2028) (%)
        • Data Table on South Korea - Year-over-year growth (2023-2028) (%)
      • 11.19 France - Market size and forecast (2023-2028)
        • Chart on France - Market size and forecast (2023-2028) ($ million)
        • Data Table on France - Market size and forecast (2023-2028) ($ million)
        • Chart on France - Year-over-year growth (2023-2028) (%)
        • Data Table on France - Year-over-year growth (2023-2028) (%)
      • 11.20 Canada - Market size and forecast (2023-2028)
        • Chart on Canada - Market size and forecast (2023-2028) ($ million)
        • Data Table on Canada - Market size and forecast (2023-2028) ($ million)
        • Chart on Canada - Year-over-year growth (2023-2028) (%)
        • Data Table on Canada - Year-over-year growth (2023-2028) (%)
      • 11.21 Brazil - Market size and forecast (2023-2028)
        • Chart on Brazil - Market size and forecast (2023-2028) ($ million)
        • Data Table on Brazil - Market size and forecast (2023-2028) ($ million)
        • Chart on Brazil - Year-over-year growth (2023-2028) (%)
        • Data Table on Brazil - Year-over-year growth (2023-2028) (%)
      • 11.22 Thailand - Market size and forecast (2023-2028)
        • Chart on Thailand - Market size and forecast (2023-2028) ($ million)
        • Data Table on Thailand - Market size and forecast (2023-2028) ($ million)
        • Chart on Thailand - Year-over-year growth (2023-2028) (%)
        • Data Table on Thailand - Year-over-year growth (2023-2028) (%)
      • 11.23 UAE - Market size and forecast (2023-2028)
        • Chart on UAE - Market size and forecast (2023-2028) ($ million)
        • Data Table on UAE - Market size and forecast (2023-2028) ($ million)
        • Chart on UAE - Year-over-year growth (2023-2028) (%)
        • Data Table on UAE - Year-over-year growth (2023-2028) (%)
      • 11.24 Mexico - Market size and forecast (2023-2028)
        • Chart on Mexico - Market size and forecast (2023-2028) ($ million)
        • Data Table on Mexico - Market size and forecast (2023-2028) ($ million)
        • Chart on Mexico - Year-over-year growth (2023-2028) (%)
        • Data Table on Mexico - Year-over-year growth (2023-2028) (%)
      • 11.25 India - Market size and forecast (2023-2028)
        • Chart on India - Market size and forecast (2023-2028) ($ million)
        • Data Table on India - Market size and forecast (2023-2028) ($ million)
        • Chart on India - Year-over-year growth (2023-2028) (%)
        • Data Table on India - Year-over-year growth (2023-2028) (%)
      • 11.26 Rest of World (ROW) - Market size and forecast (2023-2028)
        • Chart on Rest of World (ROW) - Market size and forecast (2023-2028) ($ million)
        • Data Table on Rest of World (ROW) - Market size and forecast (2023-2028) ($ million)
        • Chart on Rest of World (ROW) - Year-over-year growth (2023-2028) (%)
        • Data Table on Rest of World (ROW) - Year-over-year growth (2023-2028) (%)

      12 Drivers, Challenges, and Opportunity/Restraints

      • 12.1 Market drivers
        • 12.2 Market challenges
          • 12.3 Impact of drivers and challenges
            • Impact of drivers and challenges in 2023 and 2028
          • 12.4 Market opportunities/restraints

            13 Competitive Landscape

            • 13.1 Overview
              • 13.2 Competitive Landscape
                • Overview on criticality of inputs and factors of differentiation
              • 13.3 Landscape disruption
                • Overview on factors of disruption
              • 13.4 Industry risks
                • Impact of key risks on business

              14 Competitive Analysis

              • 14.1 Companies profiled
                • Companies covered
              • 14.2 Market positioning of companies
                • Matrix on companies position and classification
              • 14.3 Archer Daniels Midland Co.
                • Archer Daniels Midland Co. - Overview
                • Archer Daniels Midland Co. - Business segments
                • Archer Daniels Midland Co. - Key news
                • Archer Daniels Midland Co. - Key offerings
                • Archer Daniels Midland Co. - Segment focus
              • 14.4 Cargill Inc.
                • Cargill Inc. - Overview
                • Cargill Inc. - Product / Service
                • Cargill Inc. - Key news
                • Cargill Inc. - Key offerings
              • 14.5 Guilin Layn Natural Ingredients Corp.
                • Guilin Layn Natural Ingredients Corp. - Overview
                • Guilin Layn Natural Ingredients Corp. - Product / Service
                • Guilin Layn Natural Ingredients Corp. - Key offerings
              • 14.6 HOWTIAN
                • HOWTIAN - Overview
                • HOWTIAN - Product / Service
                • HOWTIAN - Key offerings
              • 14.7 Ingredion Inc.
                • Ingredion Inc. - Overview
                • Ingredion Inc. - Business segments
                • Ingredion Inc. - Key news
                • Ingredion Inc. - Key offerings
                • Ingredion Inc. - Segment focus
              • 14.8 MANUS BIO
                • MANUS BIO - Overview
                • MANUS BIO - Product / Service
                • MANUS BIO - Key offerings
              • 14.9 Morita Kagaku Kogyo Co. Ltd.
                • Morita Kagaku Kogyo Co. Ltd. - Overview
                • Morita Kagaku Kogyo Co. Ltd. - Product / Service
                • Morita Kagaku Kogyo Co. Ltd. - Key offerings
              • 14.10 Nutraceutical Corp.
                • Nutraceutical Corp. - Overview
                • Nutraceutical Corp. - Product / Service
                • Nutraceutical Corp. - Key offerings
              • 14.11 Sunrise Nutrachem Group Co. Ltd.
                • Sunrise Nutrachem Group Co. Ltd. - Overview
                • Sunrise Nutrachem Group Co. Ltd. - Product / Service
                • Sunrise Nutrachem Group Co. Ltd. - Key offerings
              • 14.12 SweeGen Inc.
                • SweeGen Inc. - Overview
                • SweeGen Inc. - Product / Service
                • SweeGen Inc. - Key offerings
              • 14.13 Tate and Lyle PLC
                • Tate and Lyle PLC - Overview
                • Tate and Lyle PLC - Business segments
                • Tate and Lyle PLC - Key news
                • Tate and Lyle PLC - Key offerings
                • Tate and Lyle PLC - Segment focus
              • 14.14 The Real Stevia Co. AB
                • The Real Stevia Co. AB - Overview
                • The Real Stevia Co. AB - Product / Service
                • The Real Stevia Co. AB - Key offerings
              • 14.15 Van Wankum Ingredients BV
                • Van Wankum Ingredients BV - Overview
                • Van Wankum Ingredients BV - Product / Service
                • Van Wankum Ingredients BV - Key offerings
              • 14.16 Wisdom Natural Brands
                • Wisdom Natural Brands - Overview
                • Wisdom Natural Brands - Product / Service
                • Wisdom Natural Brands - Key offerings
              • 14.17 Zydus Lifesciences Ltd.
                • Zydus Lifesciences Ltd. - Overview
                • Zydus Lifesciences Ltd. - Business segments
                • Zydus Lifesciences Ltd. - Key news
                • Zydus Lifesciences Ltd. - Key offerings
                • Zydus Lifesciences Ltd. - Segment focus

              15 Appendix

              • 15.1 Scope of the report
                • 15.2 Inclusions and exclusions checklist
                  • Inclusions checklist
                  • Exclusions checklist
                • 15.3 Currency conversion rates for US$
                  • Currency conversion rates for US$
                • 15.4 Research methodology
                  • Research methodology
                • 15.5 Data procurement
                  • Information sources
                • 15.6 Data validation
                  • Data validation
                • 15.7 Validation techniques employed for market sizing
                  • Validation techniques employed for market sizing
                • 15.8 Data synthesis
                  • Data synthesis
                • 15.9 360 degree market analysis
                  • 360 degree market analysis
                • 15.10 List of abbreviations
                  • List of abbreviations

                Research Methodology

                Technavio presents a detailed picture of the market by way of study, synthesis, and summation of data from multiple sources. The analysts have presented the various facets of the market with a particular focus on identifying the key industry influencers. The data thus presented is comprehensive, reliable, and the result of extensive research, both primary and secondary.

                INFORMATION SOURCES

                Primary sources

                • Manufacturers and suppliers
                • Channel partners
                • Industry experts
                • Strategic decision makers

                Secondary sources

                • Industry journals and periodicals
                • Government data
                • Financial reports of key industry players
                • Historical data
                • Press releases

                DATA ANALYSIS

                Data Synthesis

                • Collation of data
                • Estimation of key figures
                • Analysis of derived insights

                Data Validation

                • Triangulation with data models
                • Reference against proprietary databases
                • Corroboration with industry experts

                REPORT WRITING

                Qualitative

                • Market drivers
                • Market challenges
                • Market trends
                • Five forces analysis

                Quantitative

                • Market size and forecast
                • Market segmentation
                • Geographical insights
                • Competitive landscape

                Interested in this report?

                Get your sample now to see our research methodology and insights!

                Download Now

                Frequently Asked Questions

                Stevia market growth will increase by $ 310.2 mn during 2024-2028 .

                The Stevia market is expected to grow at a CAGR of 8.08% during 2024-2028 .

                Stevia market is segmented by Application( Beverage sector, Food sector, Pharmaceuticals and other) Type( Powder extract, Liquid extract, Stevia Leaves, Stevia Extracts)

                Archer Daniels Midland Co., Cargill Inc., Daepyung Co. Ltd., Fraken Biochem Co. Ltd., Guilin Layn Natural Ingredients Corp., HOWTIAN, Hunan Nutramax Inc., Ingredion Inc., MANUS BIO, Morita Kagaku Kogyo Co. Ltd., Nutraceutical Corp., S and W Seed Co., Sunrise Nutrachem Group Co. Ltd., Sunwin Stevia International Inc., SweeGen Inc., Tate and Lyle PLC, The Real Stevia Co. AB, Van Wankum Ingredients BV, Wisdom Natural Brands, Zydus Lifesciences Ltd. are a few of the key vendors in the Stevia market.

                APAC will register the highest growth rate of 39% among the other regions. Therefore, the Stevia market in APAC is expected to garner significant business opportunities for the vendors during the forecast period.

                US, Malaysia, Indonesia, Germany, UK, South Korea, France, Canada, Brazil, Thailand, UAE, Mexico, China, Japan, India

                • High demand for natural sweetenersThere is a growing demand for natural sweeteners as consumers become more health-conscious and seek alternatives to artificial sweeteners is the driving factor this market.
                • which have been linked to negative health effects such as weight gain is the driving factor this market.
                • diabetes is the driving factor this market.
                • and other health conditions. Natural sweeteners are often perceived as healthier than artificial sweeteners because they are derived from natural sources such as honey is the driving factor this market.
                • agave nectar is the driving factor this market.
                • maple syrup is the driving factor this market.
                • and stevia. They also often have a lower glycemic index is the driving factor this market.
                • which means they control blood sugar levels. Stevia is one of the most popular natural sweeteners found in various products such as baked goods is the driving factor this market.
                • beverages is the driving factor this market.
                • and snacks. The demand for natural sweeteners is expected to grow as consumers increasingly prioritize health and wellness in their purchasing decisions. is the driving factor this market.

                The Stevia market vendors should focus on grabbing business opportunities from the Beverage sector segment as it accounted for the largest market share in the base year.