Organic Tea Market Analysis APAC, Europe, North America, South America, Middle East and Africa - China, India, Germany, UK, US - Size and Forecast 2024-2028

Organic Tea Market Analysis APAC, Europe, North America, South America, Middle East and Africa - China, India, Germany, UK, US - Size and Forecast 2024-2028

Published: Jul 2024 158 Pages SKU: IRTNTR76001

Market Overview at a Glance

$667.5 Mn
Market Opportunity
9.45%
CAGR
8.42
YoY growth 2023-2024(%)

Organic Tea Market Size 2024-2028 

The organic tea market size is forecast to increase by USD 667.5 million at a CAGR of 9.45% between 2023 and 2028. The market is witnessing significant growth due to the increasing health consciousness among consumers. Ready-to-drink specialty teas, such as those made from nutrient-rich ingredients like yellow turmeric, lemon verbena, and ginger, are gaining popularity. Online retailing has made it easier for consumers to access these products from various tea manufacturers, including startups and entrepreneurs. The global population's increasing preference for superfoods, including organic tea, is another growth factor. However, the presence of pesticides in conventional tea can negatively impact health, leading consumers to opt for organic alternatives. It contains epicatechin, epicatechin gallate, and epigallocatechin gallate, which have antioxidant properties.

Organic Tea Market Size

 Request Free Sample

The market is witnessing a significant increase in demand due to the rising preference for clean-label products and the recognition of tea as a healthy beverage. Specialty teas, including organic tea, are gaining popularity among consumers in the United States, as they offer various health benefits. Tea production involves the cultivation of tea plants and the processing of tea leaves to create various tea types. Conventional products like probiotics contain good bacteria that support gut health, promoting a balanced microbiome and improving digestive function. It is produced using organic farming methods, ensuring the absence of synthetic fertilizers, pesticides, and other harmful chemicals. This production method is essential for consumers seeking organic food products that prioritize food safety and health.

Moreover, it contains phenols and polyphenols, which are antioxidants that contribute to numerous health benefits. These antioxidants are known to support heart health, aid in the prevention of infections, and boost immunity. Additionally, they help combat harmful bacteria and maintain gut function, contributing to overall digestive health. Flavonoid-based beverages, such as organic tea, have become increasingly popular as nutritional products. The antioxidant properties have been linked to weight management and slimming, making it an attractive option for those seeking to maintain a healthy lifestyle. However, it is essential to ensure that it is free from harmful substances like cadmium, which can have detrimental effects on human health.

Furthermore, the market is committed to addressing this concern by implementing rigorous production standards and testing procedures to ensure the highest quality and safety of their products. In conclusion, the market is experiencing steady growth due to the increasing demand for clean-label specialty teas with enhanced health benefits. It offers various health advantages, including heart health, infection prevention, immunity support, and digestive health. The market prioritizes food safety and quality, ensuring that consumers receive free from harmful substances.

Market Segmentation

The market research report provides comprehensive data (region-wise segment analysis), with forecasts and estimates in "USD million" for the period 2024-2028, as well as historical data from 2018-2022 for the following segments.

  • Distribution Channel
    • Offline
    • Online
  • Type
    • Leaf and powder
    • Tea bag
    • Liquid
  • Geography
    • APAC
      • China
      • India
    • Europe
      • Germany
      • UK
    • North America
      • US
    • South America
    • Middle East and Africa

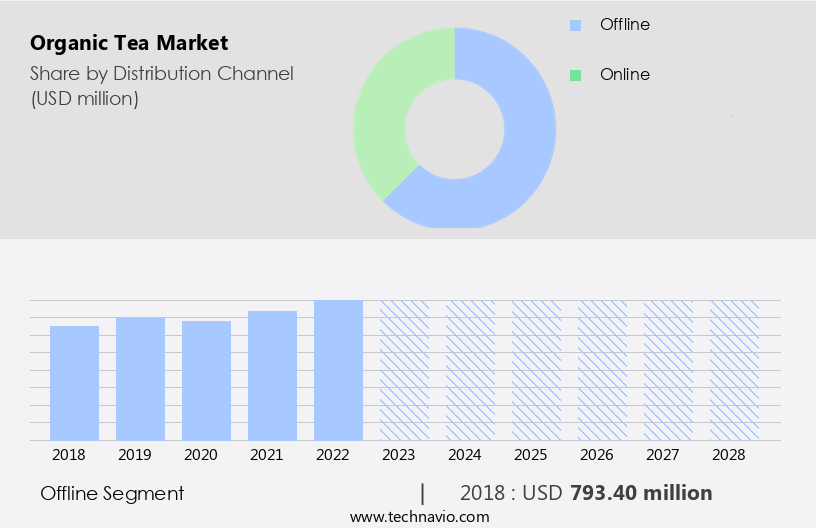
By Distribution Channel Insights

The offline segment is estimated to witness significant growth during the forecast period. The market is witnessing significant growth, with an increasing number of consumers preferring healthier and more natural beverage options. Matcha tea, Kombucha, and various herbal teas like Lavender, Hibiscus, Sage rooibos, and Lemon tea are gaining popularity. Premiumization is a key trend in the organic tea industry, with consumers willing to pay a premium for high-quality, chemical-free tea. Supermarkets and hypermarkets are the primary offline distribution channels in the US. Supermarkets, which are larger self-service retail stores than traditional grocery stores, are stocking an increasing number of brands and expanding their shelf space for these products.

Furthermore, hypermarkets, on the other hand, offer a wider range of products, including food items, groceries, appliances, and clothing, and are also increasing their offerings. Consumers are increasingly demanding organic tea products free from herbicides, fungicides, and chemical fertilizers. Black organic tea, green organic tea, and oolong organic tea are popular choices among consumers. Organic tea is sold in various packaging formats, including cartons, teabags, and cans. The demand for sustainable and eco-friendly packaging is also driving the growth of the market. The absence of artificial flavors and chemical interactions is a significant selling point for health-conscious consumers.

Organic Tea Market Size

Get a glance at the market share of various segments Request Free Sample

The offline segment was valued at USD 793.40 million in 2018 and showed a gradual increase during the forecast period.

Regional Insights

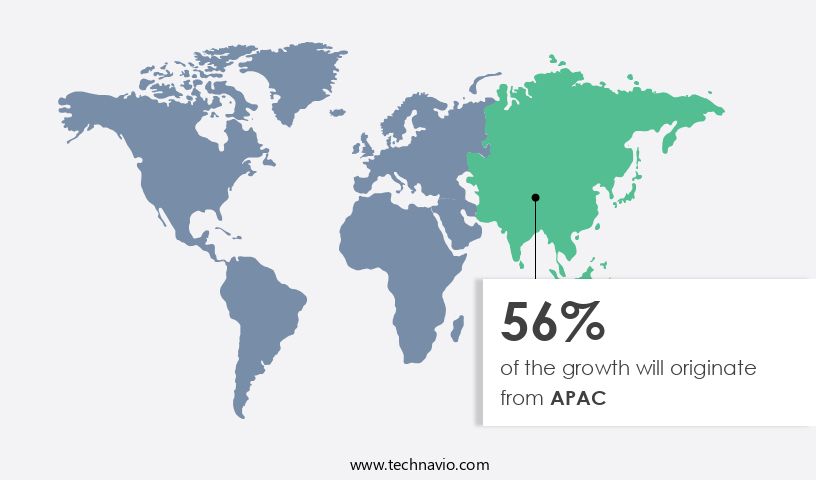
APAC is estimated to contribute 56% to the growth of the global market during the forecast period. Technavio's analysts have elaborately explained the regional trends and drivers that shape the market during the forecast period.

Organic Tea Market Share by Geography

For more insights on the market share of various regions Request Free Sample

The market in the Asia Pacific region is experiencing notable growth due to the rising preference for healthier lifestyle choices. The natural components and antioxidants present in organic tea make it an attractive option for consumers. In countries such as China, India, Japan, and South Korea, the market for organic tea is thriving. For instance, China's market is expanding rapidly as consumers opt for traditional teas like oolong, white, and green tea in their organic forms. India's Darjeeling and Assam regions are renowned for producing high-quality organic tea. In Japan, matcha green tea powder, a popular organic tea variant, is widely consumed.

Furthermore, the demand for organic tea is not limited to traditional tea-drinking nations. Urban professionals, elderly individuals, high-performance athletes, and others in the US and North America are also embracing this health-conscious beverage. Convenience is a significant factor driving the market's growth, with ready-to-drink organic tea beverages and portable tea bags gaining popularity. Innovative tea variants, such as herbal and natural blends, are also contributing to the market's expansion. Safety and quality are crucial factors for organic tea consumers. Proper food-grade tea bags and safe packaging are essential to maintain the tea's freshness and purity. As a result, research and development efforts are focused on improving tea production techniques and creating new, high-performance packaging solutions. Organic tea's growing popularity is a testament to its ability to cater to diverse consumer needs and preferences.

Our researchers analyzed the data with 2023 as the base year, along with the key drivers, trends, and challenges. A holistic analysis of drivers will help companies refine their marketing strategies to gain a competitive advantage.

Market Driver

Increasing health benefits of organic tea is the key driver of the market. Organic tea has gained popularity in the US market due to the demand for clean-label products. Specialty teas, such as those infused with hibiscus flower petals and yerba mate, offer health benefits that go beyond conventional tea. These teas contain natural herbs and medicinal plant extracts, which protect against colds, improve digestion, and boost immunity. Hibiscus tea, for instance, is rich in vitamin C and flavonoids, and it helps reduce blood sugar levels, lower blood pressure, aid digestion, and keep the liver healthy. Yerba mate, on the other hand, is rich in antioxidants and nutrients, and it boosts energy and immunity, improves mental focus and physical performance, helps to lose body fat and weight, and lowers the risk of heart diseases.

Furthermore, Tea production follows organic farming practices, ensuring food safety and sustainability. The certification process guarantees that the farming practices meet specific organic standards. The market includes black tea and green tea segments, with tea bags being a significant portion of the market. Supermarkets and hypermarkets are the primary channels for organic tea sales in the US. Consumers are increasingly concerned about the origin and farming practices of their food products, making organic tea a preferred choice. Organic farming practices ensure that the tea is free from synthetic fertilizers and pesticides, making it a healthier option for consumers. Catechins, a type of antioxidant found in tea, contribute to its health benefits. Millennials, in particular, are driving the demand for organic tea due to their focus on health and sustainability.

Market Trends

Rise in demand for organic matcha green tea is the upcoming trend in the market. The market for ready-to-drink organic specialty teas, including Matcha green tea, is experiencing significant growth due to the increasing consumer preference for nutrient-rich and health-conscious beverage options. Matcha green tea, a Japanese-style powdered green tea, is gaining popularity in the US due to its numerous health benefits. This tea contains a balanced combination of theanine and caffeine, which enhances mental alertness and focus. Additionally, it is a rich source of antioxidant catechins, such as epicatechin, epicatechin gallate, and epigallocatechin gallate, providing anti-inflammatory health benefits. Women, in particular, are drawn to organic Matcha green tea for its potential skin health benefits.

Furthermore, online retailing has made it easier for entrepreneurs and startups to reach a global population seeking these health advantages. However, it is essential to ensure that these teas are organic and free from pesticides to maintain their health benefits. Vitamin C and other superfoods, such as yellow turmeric, lemon verbena, and ginger, are often added to organic Matcha green tea to enhance its nutritional value. Brands offer organic Matcha green tea in various flavors, making it an accessible and convenient option for consumers.

Market Challenge

Impact of overconsumption of tea is a key challenge affecting the market growth. Organic tea has gained significant popularity in the US health market due to its numerous health benefits. Associated British Foods, a leading food company, reports that organic tea is rich in phenols and polyphenols, which are essential antioxidants. These antioxidants contribute to heart health, immune system support, and the prevention of bacterial infections. Furthermore, organic tea is beneficial for gut function and can aid in slimming. Tea consumption is a common practice for hydration and fitness enthusiasts. Theanine, an amino acid found in tea, promotes relaxation and mindfulness. However, excessive intake of tea may lead to adverse effects. Nutritionists recommend limiting daily tea consumption to three cups to avoid addiction and potential health risks.

Overconsumption of tea can lead to dehydration due to the diuretic effect of caffeine. Additionally, it may cause bloating due to water retention caused by dehydration. Moreover, excessive tea intake can lead to vital nutrient deficiencies and anxiety. It is essential to maintain a balanced diet and limit tea consumption to ensure optimal health benefits. In conclusion, organic tea is a healthy beverage choice for Americans seeking to improve their well-being. Its antioxidant properties contribute to heart health, immune system support, and the prevention of bacterial infections. However, excessive consumption can lead to dehydration, bloating, and other health risks. Therefore, it is recommended to limit daily tea consumption to three cups to reap the maximum health benefits.

Exclusive Customer Landscape

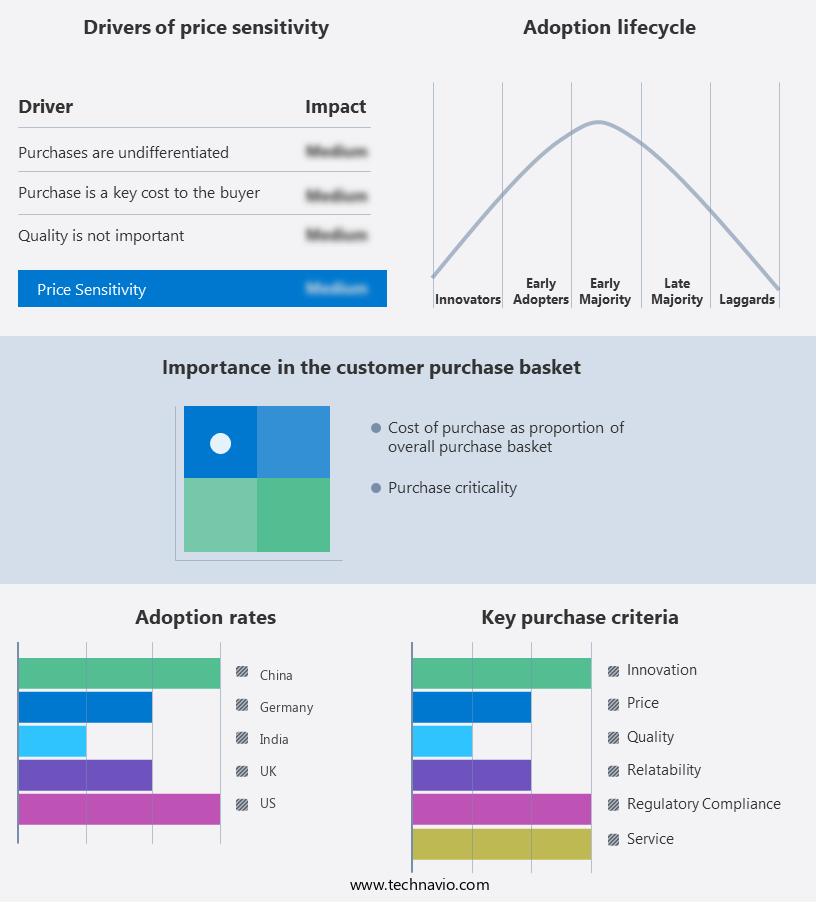
The market forecasting report includes the adoption lifecycle of the market, covering from the innovator's stage to the laggard's stage. It focuses on adoption rates in different regions based on penetration. Furthermore, the report also includes key purchase criteria and drivers of price sensitivity to help companies evaluate and develop their market growth analysis strategies.

Organic Tea Market Share by Geography

 Customer Landscape

Key Companies & Market Insights

Companies are implementing various strategies, such as strategic alliances, partnerships, mergers and acquisitions, geographical expansion, and product/service launches, to enhance their presence in the market.

Arbor Teas: The company offers organic tea such as organic Japan benifuuki black tea, organic Japan oolong tea, and organic matcha green tea select ceremonial grade.

The market research and growth report includes detailed analyses of the competitive landscape of the market and information about key companies, including:

  • Big Heart Tea Co.
  • Bigelow Tea
  • Cup of Te
  • Davidsons Organics
  • Divinitea
  • East West Tea Company LLC
  • ECOTONE
  • Halssen and Lyon GmbH
  • Harney and Sons Fine Teas
  • Numi Inc.
  • ORGANIC India Pvt. Ltd.
  • PepsiCo Inc.
  • R. Twining and Co. Ltd.
  • Tata Sons Pvt. Ltd.
  • The Coca Cola Co.
  • The Hain Celestial Group Inc.
  • The Republic of Tea Inc.
  • Tielka Pty Ltd 
  • Unilever PLC

Qualitative and quantitative analysis of companies has been conducted to help clients understand the wider business environment as well as the strengths and weaknesses of key market players. Data is qualitatively analyzed to categorize companies as pure play, category-focused, industry-focused, and diversified; it is quantitatively analyzed to categorize companies as dominant, leading, strong, tentative, and weak.

Research Analyst Overview

The market is witnessing significant growth due to the increasing demand for clean-label products and specialty teas. Tea production is transitioning towards organic farming practices, with a focus on food safety and the production of nutrient-rich organic tea. Consumers, particularly millennials, are prioritizing sustainability and are willing to pay a premium for organic tea. Organic farming practices involve the avoidance of pesticides, herbicides, fungicides, and chemical fertilizers. The certification process ensures that organic tea meets strict standards, providing consumers with peace of mind. Organic tea is rich in catechins, phenols, and polyphenols, which have antioxidant properties and offer numerous health benefits.

Furthermore, black tea and green tea are popular segments in the market. Consumers are turning to organic tea for its potential benefits for heart health, infections, immunity, and gut function. Ready-to-drink specialty teas, herbal teas, and flavonoid-based beverages are gaining popularity due to their convenience and nutritional value. The market is witnessing innovation with the introduction of novel flavors, such as lavender, hibiscus, sage rooibos, and lemon verbena. Consumers are also turning to organic tea for its slimming properties and hydration benefits, making it a popular choice for fitness enthusiasts and those seeking convenience. The market is expected to grow as consumer awareness of the potential harmful effects of pesticides and the importance of organic crops continues to increase. The market is served through various channels, including supermarkets, hypermarkets, convenience stores, and online retailers. Tea manufacturers, startups, and entrepreneurs are investing in research and development to introduce innovative variants and meet the evolving needs of consumers.

Market Scope

Report Coverage

Details

Page number

158

Base year

2023

Historic period

2018-2022

Forecast period

2024-2028

Growth momentum & CAGR

Accelerate at a CAGR of 9.45%

Market growth 2024-2028

USD 667.5 million

Market structure

Fragmented

YoY growth 2023-2024(%)

8.42

Regional analysis

APAC, Europe, North America, South America, and Middle East and Africa

Performing market contribution

APAC at 56%

Key countries

China, India, Germany, UK, and US

Competitive landscape

Leading Companies, Market Positioning of Companies, Competitive Strategies, and Industry Risks

Key companies profiled

Arbor Teas, Big Heart Tea Co., Bigelow Tea, Cup of Te, Davidsons Organics, Divinitea, East West Tea Company LLC, ECOTONE, Halssen and Lyon GmbH, Harney and Sons Fine Teas, Numi Inc., ORGANIC India Pvt. Ltd., PepsiCo Inc., R. Twining and Co. Ltd., Tata Sons Pvt. Ltd., The Coca Cola Co., The Hain Celestial Group Inc., The Republic of Tea Inc., Tielka Pty Ltd , and Unilever PLC

Market dynamics

Parent market analysis, market growth inducers and obstacles, market forecast, fast-growing and slow-growing segment analysis, COVID-19 impact and recovery analysis and future consumer dynamics, market condition analysis for the forecast period

Customization purview

If our market report has not included the data that you are looking for, you can reach out to our analysts and get segments customized.

Request Free Sample

What are the Key Data Covered in this Market Research and Growth Report?

  • CAGR of the market during the forecast period
  • Detailed information on factors that will drive the market growth and forecasting between 2024 and 2028
  • Precise estimation of the size of the market  and its contribution of the market in focus to the parent market
  • Accurate predictions about upcoming market growth and trends and changes in consumer behaviour
  • Growth of the market across APAC, Europe, North America, South America, and Middle East and Africa
  • Thorough analysis of the market's competitive landscape and detailed information about companies
  • Comprehensive analysis of factors that will challenge the growth of market companies

We can help! Our analysts can customize this market research report to meet your requirements. Get in touch

1 Executive Summary

  • 1.1 Market overview
    • Executive Summary - Chart on Market Overview
    • Executive Summary - Data Table on Market Overview
    • Executive Summary - Chart on Global Market Characteristics
    • Executive Summary - Chart on Market by Geography
    • Executive Summary - Chart on Market Segmentation by Distribution Channel
    • Executive Summary - Chart on Market Segmentation by Type
    • Executive Summary - Chart on Incremental Growth
    • Executive Summary - Data Table on Incremental Growth
    • Executive Summary - Chart on Company Market Positioning

2 Market Landscape

  • 2.1 Market ecosystem
    • Parent Market
    • Data Table on - Parent Market
  • 2.2 Market characteristics
    • Market characteristics analysis
  • 2.3 Value chain analysis
    • Value Chain Analysis

3 Market Sizing

  • 3.1 Market definition
    • Offerings of companies included in the market definition
  • 3.2 Market segment analysis
    • Market segments
  • 3.3 Market size 2023
    • 3.4 Market outlook: Forecast for 2023-2028
      • Chart on Global - Market size and forecast 2023-2028 ($ million)
      • Data Table on Global - Market size and forecast 2023-2028 ($ million)
      • Chart on Global Market: Year-over-year growth 2023-2028 (%)
      • Data Table on Global Market: Year-over-year growth 2023-2028 (%)

    4 Historic Market Size

    • 4.1 Global Organic Tea Market 2018 - 2022
      • Historic Market Size - Data Table on Global Organic Tea Market 2018 - 2022 ($ million)
    • 4.2 Distribution Channel segment analysis 2018 - 2022
      • Historic Market Size - Distribution Channel Segment 2018 - 2022 ($ million)
    • 4.3 Type segment analysis 2018 - 2022
      • Historic Market Size - Type Segment 2018 - 2022 ($ million)
    • 4.4 Geography segment analysis 2018 - 2022
      • Historic Market Size - Geography Segment 2018 - 2022 ($ million)
    • 4.5 Country segment analysis 2018 - 2022
      • Historic Market Size - Country Segment 2018 - 2022 ($ million)

    5 Five Forces Analysis

    • 5.1 Five forces summary
      • Five forces analysis - Comparison between 2023 and 2028
    • 5.2 Bargaining power of buyers
      • Bargaining power of buyers - Impact of key factors 2023 and 2028
    • 5.3 Bargaining power of suppliers
      • Bargaining power of suppliers - Impact of key factors in 2023 and 2028
    • 5.4 Threat of new entrants
      • Threat of new entrants - Impact of key factors in 2023 and 2028
    • 5.5 Threat of substitutes
      • Threat of substitutes - Impact of key factors in 2023 and 2028
    • 5.6 Threat of rivalry
      • Threat of rivalry - Impact of key factors in 2023 and 2028
    • 5.7 Market condition
      • Chart on Market condition - Five forces 2023 and 2028

    6 Market Segmentation by Distribution Channel

    • 6.1 Market segments
      • Chart on Distribution Channel - Market share 2023-2028 (%)
      • Data Table on Distribution Channel - Market share 2023-2028 (%)
    • 6.2 Comparison by Distribution Channel
      • Chart on Comparison by Distribution Channel
      • Data Table on Comparison by Distribution Channel
    • 6.3 Offline - Market size and forecast 2023-2028
      • Chart on Offline - Market size and forecast 2023-2028 ($ million)
      • Data Table on Offline - Market size and forecast 2023-2028 ($ million)
      • Chart on Offline - Year-over-year growth 2023-2028 (%)
      • Data Table on Offline - Year-over-year growth 2023-2028 (%)
    • 6.4 Online - Market size and forecast 2023-2028
      • Chart on Online - Market size and forecast 2023-2028 ($ million)
      • Data Table on Online - Market size and forecast 2023-2028 ($ million)
      • Chart on Online - Year-over-year growth 2023-2028 (%)
      • Data Table on Online - Year-over-year growth 2023-2028 (%)
    • 6.5 Market opportunity by Distribution Channel
      • Market opportunity by Distribution Channel ($ million)
      • Data Table on Market opportunity by Distribution Channel ($ million)

    7 Market Segmentation by Type

    • 7.1 Market segments
      • Chart on Type - Market share 2023-2028 (%)
      • Data Table on Type - Market share 2023-2028 (%)
    • 7.2 Comparison by Type
      • Chart on Comparison by Type
      • Data Table on Comparison by Type
    • 7.3 Leaf and powder - Market size and forecast 2023-2028
      • Chart on Leaf and powder - Market size and forecast 2023-2028 ($ million)
      • Data Table on Leaf and powder - Market size and forecast 2023-2028 ($ million)
      • Chart on Leaf and powder - Year-over-year growth 2023-2028 (%)
      • Data Table on Leaf and powder - Year-over-year growth 2023-2028 (%)
    • 7.4 Tea bag - Market size and forecast 2023-2028
      • Chart on Tea bag - Market size and forecast 2023-2028 ($ million)
      • Data Table on Tea bag - Market size and forecast 2023-2028 ($ million)
      • Chart on Tea bag - Year-over-year growth 2023-2028 (%)
      • Data Table on Tea bag - Year-over-year growth 2023-2028 (%)
    • 7.5 Liquid - Market size and forecast 2023-2028
      • Chart on Liquid - Market size and forecast 2023-2028 ($ million)
      • Data Table on Liquid - Market size and forecast 2023-2028 ($ million)
      • Chart on Liquid - Year-over-year growth 2023-2028 (%)
      • Data Table on Liquid - Year-over-year growth 2023-2028 (%)
    • 7.6 Market opportunity by Type
      • Market opportunity by Type ($ million)
      • Data Table on Market opportunity by Type ($ million)

    8 Customer Landscape

    • 8.1 Customer landscape overview
      • Analysis of price sensitivity, lifecycle, customer purchase basket, adoption rates, and purchase criteria

    9 Geographic Landscape

    • 9.1 Geographic segmentation
      • Chart on Market share by geography 2023-2028 (%)
      • Data Table on Market share by geography 2023-2028 (%)
    • 9.2 Geographic comparison
      • Chart on Geographic comparison
      • Data Table on Geographic comparison
    • 9.3 APAC - Market size and forecast 2023-2028
      • Chart on APAC - Market size and forecast 2023-2028 ($ million)
      • Data Table on APAC - Market size and forecast 2023-2028 ($ million)
      • Chart on APAC - Year-over-year growth 2023-2028 (%)
      • Data Table on APAC - Year-over-year growth 2023-2028 (%)
    • 9.4 Europe - Market size and forecast 2023-2028
      • Chart on Europe - Market size and forecast 2023-2028 ($ million)
      • Data Table on Europe - Market size and forecast 2023-2028 ($ million)
      • Chart on Europe - Year-over-year growth 2023-2028 (%)
      • Data Table on Europe - Year-over-year growth 2023-2028 (%)
    • 9.5 North America - Market size and forecast 2023-2028
      • Chart on North America - Market size and forecast 2023-2028 ($ million)
      • Data Table on North America - Market size and forecast 2023-2028 ($ million)
      • Chart on North America - Year-over-year growth 2023-2028 (%)
      • Data Table on North America - Year-over-year growth 2023-2028 (%)
    • 9.6 South America - Market size and forecast 2023-2028
      • Chart on South America - Market size and forecast 2023-2028 ($ million)
      • Data Table on South America - Market size and forecast 2023-2028 ($ million)
      • Chart on South America - Year-over-year growth 2023-2028 (%)
      • Data Table on South America - Year-over-year growth 2023-2028 (%)
    • 9.7 Middle East and Africa - Market size and forecast 2023-2028
      • Chart on Middle East and Africa - Market size and forecast 2023-2028 ($ million)
      • Data Table on Middle East and Africa - Market size and forecast 2023-2028 ($ million)
      • Chart on Middle East and Africa - Year-over-year growth 2023-2028 (%)
      • Data Table on Middle East and Africa - Year-over-year growth 2023-2028 (%)
    • 9.8 China - Market size and forecast 2023-2028
      • Chart on China - Market size and forecast 2023-2028 ($ million)
      • Data Table on China - Market size and forecast 2023-2028 ($ million)
      • Chart on China - Year-over-year growth 2023-2028 (%)
      • Data Table on China - Year-over-year growth 2023-2028 (%)
    • 9.9 India - Market size and forecast 2023-2028
      • Chart on India - Market size and forecast 2023-2028 ($ million)
      • Data Table on India - Market size and forecast 2023-2028 ($ million)
      • Chart on India - Year-over-year growth 2023-2028 (%)
      • Data Table on India - Year-over-year growth 2023-2028 (%)
    • 9.10 Germany - Market size and forecast 2023-2028
      • Chart on Germany - Market size and forecast 2023-2028 ($ million)
      • Data Table on Germany - Market size and forecast 2023-2028 ($ million)
      • Chart on Germany - Year-over-year growth 2023-2028 (%)
      • Data Table on Germany - Year-over-year growth 2023-2028 (%)
    • 9.11 UK - Market size and forecast 2023-2028
      • Chart on UK - Market size and forecast 2023-2028 ($ million)
      • Data Table on UK - Market size and forecast 2023-2028 ($ million)
      • Chart on UK - Year-over-year growth 2023-2028 (%)
      • Data Table on UK - Year-over-year growth 2023-2028 (%)
    • 9.12 US - Market size and forecast 2023-2028
      • Chart on US - Market size and forecast 2023-2028 ($ million)
      • Data Table on US - Market size and forecast 2023-2028 ($ million)
      • Chart on US - Year-over-year growth 2023-2028 (%)
      • Data Table on US - Year-over-year growth 2023-2028 (%)
    • 9.13 Market opportunity by geography
      • Market opportunity by geography ($ million)
      • Data Tables on Market opportunity by geography ($ million)

    10 Drivers, Challenges, and Opportunity/Restraints

    • 10.1 Market drivers
      • 10.2 Market challenges
        • 10.3 Impact of drivers and challenges
          • Impact of drivers and challenges in 2023 and 2028
        • 10.4 Market opportunities/restraints

          11 Competitive Landscape

          • 11.1 Overview
            • 11.2 Competitive Landscape
              • Overview on criticality of inputs and factors of differentiation
            • 11.3 Landscape disruption
              • Overview on factors of disruption
            • 11.4 Industry risks
              • Impact of key risks on business

            12 Competitive Analysis

            • 12.1 Companies profiled
              • Companies covered
            • 12.2 Market positioning of companies
              • Matrix on companies position and classification
            • 12.3 Arbor Teas
              • Arbor Teas - Overview
              • Arbor Teas - Product / Service
              • Arbor Teas - Key offerings
            • 12.4 Bigelow Tea
              • Bigelow Tea - Overview
              • Bigelow Tea - Product / Service
              • Bigelow Tea - Key offerings
            • 12.5 Davidsons Organics
              • Davidsons Organics - Overview
              • Davidsons Organics - Product / Service
              • Davidsons Organics - Key offerings
            • 12.6 East West Tea Company LLC
              • East West Tea Company LLC - Overview
              • East West Tea Company LLC - Product / Service
              • East West Tea Company LLC - Key offerings
            • 12.7 ECOTONE
              • ECOTONE - Overview
              • ECOTONE - Product / Service
              • ECOTONE - Key offerings
            • 12.8 Harney and Sons Fine Teas
              • Harney and Sons Fine Teas - Overview
              • Harney and Sons Fine Teas - Product / Service
              • Harney and Sons Fine Teas - Key offerings
            • 12.9 Numi Inc.
              • Numi Inc. - Overview
              • Numi Inc. - Product / Service
              • Numi Inc. - Key offerings
            • 12.10 ORGANIC INDIA Pvt. Ltd.
              • ORGANIC INDIA Pvt. Ltd. - Overview
              • ORGANIC INDIA Pvt. Ltd. - Product / Service
              • ORGANIC INDIA Pvt. Ltd. - Key offerings
            • 12.11 PepsiCo Inc.
              • PepsiCo Inc. - Overview
              • PepsiCo Inc. - Business segments
              • PepsiCo Inc. - Key news
              • PepsiCo Inc. - Key offerings
              • PepsiCo Inc. - Segment focus
            • 12.12 R. Twining and Co. Ltd.
              • R. Twining and Co. Ltd. - Overview
              • R. Twining and Co. Ltd. - Product / Service
              • R. Twining and Co. Ltd. - Key offerings
            • 12.13 Tata Sons Pvt. Ltd.
              • Tata Sons Pvt. Ltd. - Overview
              • Tata Sons Pvt. Ltd. - Product / Service
              • Tata Sons Pvt. Ltd. - Key news
              • Tata Sons Pvt. Ltd. - Key offerings
            • 12.14 The Coca Cola Co.
              • The Coca Cola Co. - Overview
              • The Coca Cola Co. - Business segments
              • The Coca Cola Co. - Key news
              • The Coca Cola Co. - Key offerings
              • The Coca Cola Co. - Segment focus
            • 12.15 The Hain Celestial Group Inc.
              • The Hain Celestial Group Inc. - Overview
              • The Hain Celestial Group Inc. - Business segments
              • The Hain Celestial Group Inc. - Key news
              • The Hain Celestial Group Inc. - Key offerings
              • The Hain Celestial Group Inc. - Segment focus
            • 12.16 The Republic of Tea Inc.
              • The Republic of Tea Inc. - Overview
              • The Republic of Tea Inc. - Product / Service
              • The Republic of Tea Inc. - Key offerings
            • 12.17 Unilever PLC
              • Unilever PLC - Overview
              • Unilever PLC - Business segments
              • Unilever PLC - Key news
              • Unilever PLC - Key offerings
              • Unilever PLC - Segment focus

            13 Appendix

            • 13.1 Scope of the report
              • 13.2 Inclusions and exclusions checklist
                • Inclusions checklist
                • Exclusions checklist
              • 13.3 Currency conversion rates for US$
                • Currency conversion rates for US$
              • 13.4 Research methodology
                • Research methodology
              • 13.5 Data procurement
                • Information sources
              • 13.6 Data validation
                • Data validation
              • 13.7 Validation techniques employed for market sizing
                • Validation techniques employed for market sizing
              • 13.8 Data synthesis
                • Data synthesis
              • 13.9 360 degree market analysis
                • 360 degree market analysis
              • 13.10 List of abbreviations
                • List of abbreviations

              Research Methodology

              Technavio presents a detailed picture of the market by way of study, synthesis, and summation of data from multiple sources. The analysts have presented the various facets of the market with a particular focus on identifying the key industry influencers. The data thus presented is comprehensive, reliable, and the result of extensive research, both primary and secondary.

              INFORMATION SOURCES

              Primary sources

              • Manufacturers and suppliers
              • Channel partners
              • Industry experts
              • Strategic decision makers

              Secondary sources

              • Industry journals and periodicals
              • Government data
              • Financial reports of key industry players
              • Historical data
              • Press releases

              DATA ANALYSIS

              Data Synthesis

              • Collation of data
              • Estimation of key figures
              • Analysis of derived insights

              Data Validation

              • Triangulation with data models
              • Reference against proprietary databases
              • Corroboration with industry experts

              REPORT WRITING

              Qualitative

              • Market drivers
              • Market challenges
              • Market trends
              • Five forces analysis

              Quantitative

              • Market size and forecast
              • Market segmentation
              • Geographical insights
              • Competitive landscape

              Interested in this report?

              Get your sample now to see our research methodology and insights!

              Download Now

              Frequently Asked Questions

              Organic Tea market growth will increase by $ 667.5 mn during 2024-2028 .

              The Organic Tea market is expected to grow at a CAGR of 9.45% during 2024-2028 .

              Organic Tea market is segmented by Distribution Channel( Offline, Online) Type( Leaf and powder, Tea bag, Liquid)

              Arbor Teas, Big Heart Tea Co., Bigelow Tea, Cup of Te, Davidsons Organics, Divinitea, East West Tea Company LLC, ECOTONE, Halssen and Lyon GmbH, Harney and Sons Fine Teas, Numi Inc., ORGANIC INDIA Pvt. Ltd., PepsiCo Inc., R. Twining and Co. Ltd., Tata Sons Pvt. Ltd., The Coca Cola Co., The Hain Celestial Group Inc., The Republic of Tea Inc., Tielka Pty Ltd , Unilever PLC are a few of the key vendors in the Organic Tea market.

              APAC will register the highest growth rate of 56% among the other regions. Therefore, the Organic Tea market in APAC is expected to garner significant business opportunities for the vendors during the forecast period.

              China, India, Germany, UK, US

              • Increasing health benefits of organic teaConsumers prefer to consume organic tea over other beverages because it contains herbs and medicinal plant extracts that are beneficial for the body. Tea products infused with healthy ingredients protect against colds and improve digestion and immunity. Vendors are offering tea products containing hibiscus flower petals is the driving factor this market.
              • which help in minimizing blood sugar and blood pressure levels. Yerba mate: It is rich in antioxidants and nutrients is the driving factor this market.
              • boosts energy and immunity is the driving factor this market.
              • improves mental focus and physical performance is the driving factor this market.
              • helps to lose body fat and weight is the driving factor this market.
              • and lowers blood sugar levels and the risk of heart diseases. Hibiscus tea: It is rich in vitamin C and contains flavonoids is the driving factor this market.
              • reduces blood sugar levels is the driving factor this market.
              • lowers blood pressure is the driving factor this market.
              • aids in digestion is the driving factor this market.
              • helps in reducing menstrual cramps is the driving factor this market.
              • and keeps the liver healthy. Lemongrass tea: It is rich in inflammation-fighting compounds such as disorienting and chlorogenic acid is the driving factor this market.
              • helps in relieving anxiety and pain is the driving factor this market.
              • lowers cholesterol levels is the driving factor this market.
              • prevents infection is the driving factor this market.
              • boosts oral health is the driving factor this market.
              • and increases the red blood cell count. Chamomile tea: It is rich in flavonoids is the driving factor this market.
              • helps in reducing menstrual pain is the driving factor this market.
              • lowers blood sugar levels is the driving factor this market.
              • and helps with relaxation and sleep. Similarly is the driving factor this market.
              • tea products containing ginger is the driving factor this market.
              • citrus is the driving factor this market.
              • and mint help to relax a tired body. The growing consumer awareness about the availability of such tea products and their benefits will boost the sales of these products. This demand for low-calorie tea will lead to the expansion of growth of the global organic tea market during the forecast period. is the driving factor this market.

              The Organic Tea market vendors should focus on grabbing business opportunities from the Offline segment as it accounted for the largest market share in the base year.