Orthopedic Soft Tissue Repair Devices Market Size 2025-2029
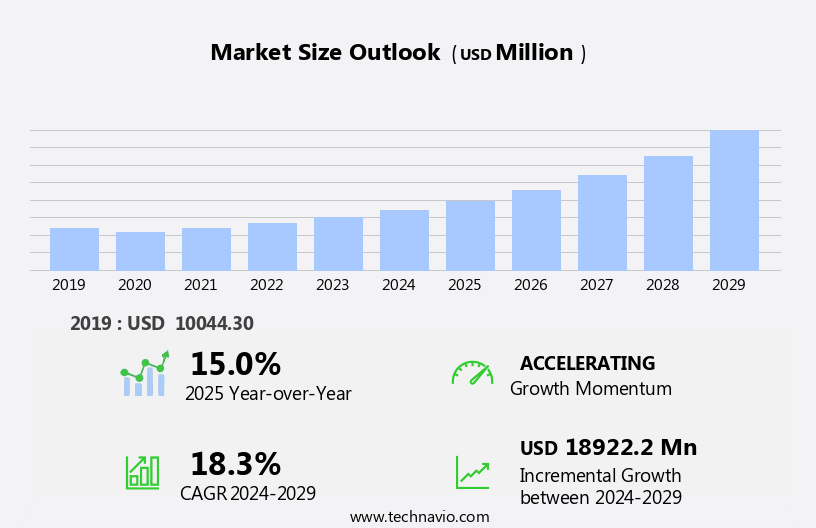
The orthopedic soft tissue repair devices market size is forecast to increase by USD 18.92 billion, at a CAGR of 18.3% between 2024 and 2029.
- The market is experiencing significant growth due to the rising geriatric population and increasing adoption in emerging markets. The aging population's increased susceptibility to orthopedic injuries and conditions necessitates advanced soft tissue repair solutions. Moreover, the expanding use of orthopedic devices in developing economies, driven by rising healthcare expenditures and awareness, is fueling market expansion. However, the market faces challenges, including the high cost of orthopedic surgeries and procedures, which may limit accessibility for many patients. Additionally, the complexities and risks associated with soft tissue repair procedures necessitate advanced surgical expertise and specialized facilities, adding to the overall cost burden.
- Companies in this market must navigate these challenges by focusing on cost reduction strategies, collaborating with healthcare providers to offer affordable financing options, and investing in research and development to create more cost-effective and efficient solutions. By addressing these challenges and capitalizing on the growing demand, market participants can effectively capitalize on the significant opportunities in the market.
What will be the Size of the Orthopedic Soft Tissue Repair Devices Market during the forecast period?
Explore in-depth regional segment analysis with market size data - historical 2019-2023 and forecasts 2025-2029 - in the full report.
Request Free Sample
The orthopedic soft tissue repair market continues to evolve, driven by advancements in endoscopic and laparoscopic instruments, regenerative medicine, and minimally invasive surgery. These technologies enable more precise interventions, reducing recovery time and improving patient outcomes. Surgical anchors and tissue adhesives play crucial roles in these procedures, ensuring secure attachment and promoting tissue regeneration. Clinical research and regulatory approvals are ongoing, with a focus on biocompatibility testing and evidence-based medicine. In the realm of meniscus repair, device testing and platelet-rich plasma are at the forefront, offering potential for enhanced healing and reduced implant failure. The integration of 3D printing and material science in orthopedic surgery further expands possibilities, from customized implants to advanced surgical instruments.
Sports medicine applications continue to grow, with a focus on patient satisfaction and wound healing through tissue engineering and stem cell therapies. Bioresorbable polymers and robotic surgery are also shaping the market, offering solutions for tissue engineering and minimally invasive procedures, respectively. The continuous unfolding of market activities underscores the importance of ongoing clinical trials and device design innovations, ensuring the best possible outcomes for patients.
How is this Orthopedic Soft Tissue Repair Devices Industry segmented?
The orthopedic soft tissue repair devices industry research report provides comprehensive data (region-wise segment analysis), with forecasts and estimates in "USD million" for the period 2025-2029, as well as historical data from 2019-2023 for the following segments.
- Product Type
- Fixation devices
- Tissue scaffold
- Cell therapy-based
- End-user
- Hospitals and clinics
- Ambulatory surgical centers (ASCs)
- Physician office
- Application
- Knee injuries
- Shoulder injuries
- Foot and ankle injuries
- Hip injuries
- Others
- Geography
- North America
- US
- Canada
- Europe
- France
- Germany
- Italy
- UK
- APAC
- China
- India
- Japan
- South Korea
- Rest of World (ROW)
- North America
.
By Product Type Insights
The fixation devices segment is estimated to witness significant growth during the forecast period.
In the realm of orthopedic care, fixation devices have emerged as essential tools for supporting bone recovery following surgery or injury. These devices, fabricated from artificial materials, serve to bridge the gap left by the bony structure. Their applications span various conditions, including fractures and sports injuries, with trauma to the musculoskeletal system being a primary use case. Suture anchors and interference screws are among the popular fixation devices. Suture anchors, which are extensively utilized in securing soft tissue, such as tendons, ligaments, and menisci, to the bone, have gained significant importance in arthroscopic surgery and sports medicine.
The advent of minimally invasive surgery, including endoscopic and laparoscopic procedures, has further bolstered the demand for these devices. Advancements in material science have led to the development of biocompatible polymers, such as polyglycolic acid, which are used in the production of resorbable fixation devices. Regenerative medicine, including tissue engineering and platelet-rich plasma therapies, has also influenced the market dynamics, as these treatments often require the use of surgical instruments, such as needles and tissue adhesives, for effective implementation. Clinical research and regulatory approvals are crucial elements in the evolution of this market, ensuring the safety and efficacy of these devices.
The integration of 3D printing technology has further expanded the possibilities for customized implant designs and improved patient satisfaction. Robotic surgery and device testing are other areas of focus, as these technologies enhance precision and reduce the risk of implant failure. Overall, the market for orthopedic soft tissue repair devices is characterized by continuous innovation and a commitment to evidence-based medicine.
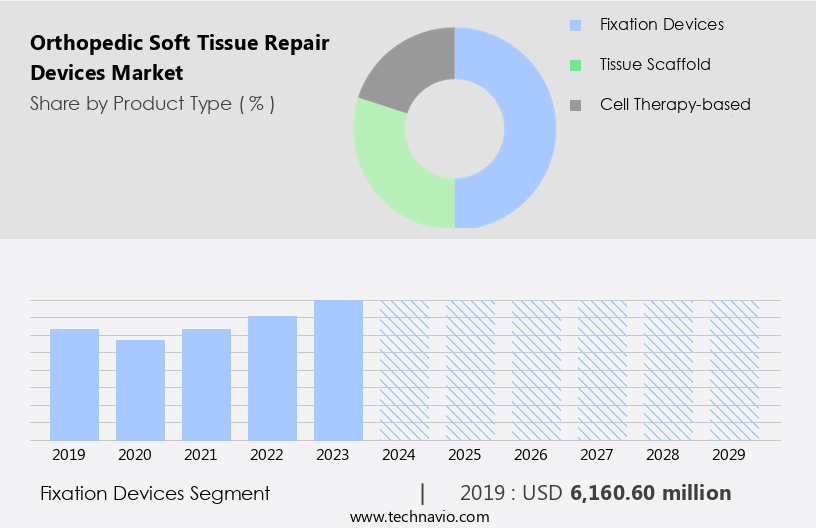
The Fixation devices segment was valued at USD 6.16 billion in 2019 and showed a gradual increase during the forecast period.
Regional Analysis
North America is estimated to contribute 48% to the growth of the global market during the forecast period.Technavio's analysts have elaborately explained the regional trends and drivers that shape the market during the forecast period.
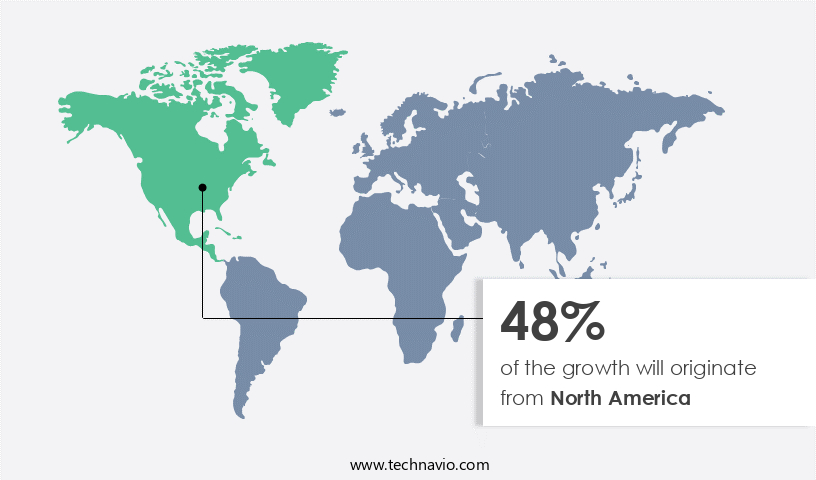
The market is witnessing significant growth due to the increasing prevalence of sports injuries, trauma cases, and arthroscopic procedures. In North America, this market is experiencing notable expansion, driven by rising healthcare spending and investments in infrastructure. Trauma cases, knee arthroscopies, and sports-related injuries are on the rise, leading to a substantial revenue contribution from this region in 2024. The healthcare sector in the U.S. Saw a 7.5% increase in spending, reaching USD4.9 trillion in 2023, enabling the affordability of expensive orthopedic soft tissue repair surgeries. Minimally invasive surgeries, such as rotator cuff repair and meniscus repair, are gaining popularity due to their reduced recovery time and minimal scarring.
Advanced technologies, like 3D printing, regenerative medicine, and tissue engineering, are revolutionizing the market by offering innovative solutions for tissue regeneration and implant reconstruction. Clinical research, regulatory approvals, and biocompatibility testing are crucial aspects of the market, ensuring the safety and efficacy of surgical instruments, surgical needles, tissue adhesives, and platelet-rich plasma. Patient satisfaction and post-operative recovery are key considerations for manufacturers, leading to the development of advanced materials like polyglycolic acid, biodegradable polymers, and stem cells. Robotic surgery is also gaining traction for its precision and minimally invasive nature. Overall, the market is dynamic and evolving, driven by advancements in material science, evidence-based medicine, and device design.
Market Dynamics
Our researchers analyzed the data with 2024 as the base year, along with the key drivers, trends, and challenges. A holistic analysis of drivers will help companies refine their marketing strategies to gain a competitive advantage.
What are the key market drivers leading to the rise in the adoption of Orthopedic Soft Tissue Repair Devices Industry?
- The global market is significantly driven by the rising geriatric population, whose numbers continue to increase at an unprecedented rate.
- The aging population is driving the demand for orthopedic treatments and devices due to the challenges older adults face in healing from injuries and resuming daily activities. Compared to younger individuals, older people have less overall strength, flexibility, and balance, making it more difficult to compensate for an injury's limitations. Muscle tissue deteriorates more rapidly in older adults when inactive or immobilized, leading to muscle weakness and potentially permanent muscle shortening. Tissues near the joints, such as ligaments and tendons, can also develop scar tissue. These factors have resulted in a growing need for advanced orthopedic solutions. The global population of elderly individuals is increasing due to longer life expectancies, and this trend is expected to continue.
- According to recent research, the number of people aged 65 and above is projected to double by 2050. This demographic shift is leading to a heightened focus on orthopedic treatments and devices that can help older adults maintain their mobility and improve their quality of life. Minimally invasive surgical procedures, such as endoscopic and laparoscopic techniques, are increasingly being used in orthopedic surgery to reduce trauma and promote faster healing. Regenerative medicine, which involves using the body's own cells to repair damaged tissue, is also gaining popularity in the field. Surgical anchors are essential components of many orthopedic procedures, providing a secure attachment for tissue repair and reconstruction.
- The aging population and the resulting demand for orthopedic treatments and devices are key market drivers. Minimally invasive surgical techniques, regenerative medicine, and surgical anchors are some of the areas of focus in the orthopedic soft tissue repair market. The market is expected to continue growing as the elderly population increases and new technological advancements are developed.
What are the market trends shaping the Orthopedic Soft Tissue Repair Devices Industry?
- The increasing adoption of orthopedic devices is a notable trend in emerging markets. This trend is driven by the growing population, rising healthcare expenditures, and an aging demographic.
- The market is experiencing significant growth due to clinical research advancements and regulatory approvals for innovative technologies. One such technology is 3D printing, which is revolutionizing the field of sports medicine by enabling customized implants for procedures like ACL reconstruction. Material science, particularly the use of polyglycolic acid, is another key driver in this market. However, implant failure remains a challenge, necessitating ongoing research and development efforts. In emerging markets, particularly in Asia and the Rest of the World, the market is poised for expansion.
- Factors contributing to this growth include a substantial patent base for target indications, increasing health awareness, rising healthcare expenditure, and the development of advanced healthcare infrastructure. Medical tourism is also playing a role, as nations such as India, China, and Brazil attract patients from around the world with their advanced medical facilities and cost savings.
What challenges does the Orthopedic Soft Tissue Repair Devices Industry face during its growth?
- The escalating costs of orthopedic surgeries and procedures represent a significant challenge to the industry's growth trajectory.
- The orthopedic soft tissue repair market is driven by the increasing prevalence of orthopedic disorders, leading to a higher demand for advanced repair devices. Evidence-based medicine continues to play a significant role in the adoption of these technologies, with clinical trials and device testing being crucial components of the decision-making process. Orthopedic procedures, such as meniscus repair, increasingly rely on innovative solutions like surgical needles, tissue adhesives, and platelet-rich plasma to enhance patient outcomes and facilitate faster post-operative recovery. However, the high cost of these devices and surgical procedures poses a challenge to market growth. In the US, the average cost for orthopedic surgeries ranges from USD25,000 to USD50,000, including consultation fees.
- The surgery itself accounts for approximately USD25,000 to USD40,000, while an additional USD4,000 to USD6,000 is required for general and local anesthesia. A knee replacement surgery in the US costs an average of USD49,500. It is essential to emphasize the importance of these advanced repair solutions in improving patient outcomes and facilitating quicker recoveries, while acknowledging the financial considerations that impact market growth.
Exclusive Customer Landscape
The orthopedic soft tissue repair devices market forecasting report includes the adoption lifecycle of the market, covering from the innovator's stage to the laggard's stage. It focuses on adoption rates in different regions based on penetration. Furthermore, the orthopedic soft tissue repair devices market report also includes key purchase criteria and drivers of price sensitivity to help companies evaluate and develop their market growth analysis strategies.

Customer Landscape
Key Companies & Market Insights
Companies are implementing various strategies, such as strategic alliances, orthopedic soft tissue repair devices market forecast, partnerships, mergers and acquisitions, geographical expansion, and product/service launches, to enhance their presence in the industry.
Acera Surgical Inc. - The company specializes in orthopedic soft tissue repair solutions, featuring innovative devices like AlloConnex. This advanced technology encompasses tendons, ligaments, and fascia, catering to a wide range of surgical procedures. By utilizing these biocompatible materials, patients can regain mobility and return to their active lifestyles more effectively. AlloConnex represents our commitment to advancing healthcare through cutting-edge technology and dedication to patient well-being.
The industry research and growth report includes detailed analyses of the competitive landscape of the market and information about key companies, including:
- Acera Surgical Inc.
- AlloSource
- Amplitude SAS
- Arthrex Inc.
- Becton Dickinson and Co.
- Boston Scientific Corp.
- Conmed Corp.
- Integra LifeSciences Holdings Corp.
- Johnson and Johnson Services Inc.
- JRF Ortho
- LifeCell International Pvt. Ltd.
- LifeNet Health Inc.
- Medtronic Plc
- MTF Biologics
- RTI Surgical Inc.
- Smith and Nephew plc
- Stryker Corp.
- Tissue Regenix Group Plc
- Zimmer Biomet Holdings Inc.
Qualitative and quantitative analysis of companies has been conducted to help clients understand the wider business environment as well as the strengths and weaknesses of key industry players. Data is qualitatively analyzed to categorize companies as pure play, category-focused, industry-focused, and diversified; it is quantitatively analyzed to categorize companies as dominant, leading, strong, tentative, and weak.
Recent Development and News in Orthopedic Soft Tissue Repair Devices Market
- In February 2023, Stryker Corporation announced the launch of its new soft tissue repair device, the TissuGlu Surgical Adhesive, which utilizes fibrin sealant technology for the repair of soft tissue injuries. This innovative product is expected to expand Stryker's portfolio and cater to the growing demand for minimally invasive surgical procedures (Stryker Corporation Press Release).
- In July 2024, Smith & Nephew and Arthrex, Inc. Entered into a strategic partnership to develop and commercialize next-generation soft tissue repair devices. This collaboration combines Smith & Nephew's global reach and Arthrex's expertise in tissue repair technologies, aiming to enhance their offerings and cater to the evolving market needs (Smith & Nephew Press Release).
- In November 2024, Medtronic plc completed the acquisition of Titan Spine, a leading innovator in minimally invasive spinal fusion technologies. This acquisition significantly strengthened Medtronic's orthopedic portfolio, providing them with advanced soft tissue repair devices and expanding their presence in the spine market (Medtronic Press Release).
- In March 2025, the U.S. Food and Drug Administration (FDA) granted 510(k) clearance to Zimmer Biomet Holdings for its new soft tissue repair device, the Gentamicin-Loaded Collagen Matrix. This approval marks a significant milestone for the company, as the product is expected to provide enhanced infection prevention and control in soft tissue repair procedures (Zimmer Biomet Holdings Press Release).
Research Analyst Overview
- The orthopedic soft tissue repair market is witnessing significant advancements, driven by the development of innovative technologies and the shift towards value-based healthcare. Preclinical studies on bioengineered tissues, such as bone grafts and synthetic ligaments, are yielding promising results, with in vivo testing and growth factor delivery systems enhancing long-term outcomes. Quality control measures, including biomechanical testing and finite element analysis, ensure the reliability and safety of these advanced solutions. Value-based healthcare is transforming the market, with cost-benefit analysis and personalized medicine becoming key factors in treatment decisions. Surgical robotics and computer-aided design are revolutionizing the surgical landscape, enabling more precise interventions.
- Tissue scaffolds and tendon grafts are gaining popularity due to their ability to promote tissue regeneration and enhance healing. Future trends include the integration of emerging technologies, such as image-guided surgery and cell therapy, into clinical practice. Physical therapy and patient education are also crucial components of the healing process, ensuring optimal recovery and reducing the risk of re-injury. Post-market surveillance and supply chain management are essential for maintaining the safety and efficacy of orthopedic soft tissue repair devices.
Dive into Technavio's robust research methodology, blending expert interviews, extensive data synthesis, and validated models for unparalleled Orthopedic Soft Tissue Repair Devices Market insights. See full methodology.
|
Market Scope |
|
|
Report Coverage |
Details |
|
Page number |
230 |
|
Base year |
2024 |
|
Historic period |
2019-2023 |
|
Forecast period |
2025-2029 |
|
Growth momentum & CAGR |
Accelerate at a CAGR of 18.3% |
|
Market growth 2025-2029 |
USD 18922.2 million |
|
Market structure |
Fragmented |
|
YoY growth 2024-2025(%) |
15.0 |
|
Key countries |
US, Germany, Canada, Japan, France, China, UK, India, South Korea, and Italy |
|
Competitive landscape |
Leading Companies, Market Positioning of Companies, Competitive Strategies, and Industry Risks |
What are the Key Data Covered in this Orthopedic Soft Tissue Repair Devices Market Research and Growth Report?
- CAGR of the Orthopedic Soft Tissue Repair Devices industry during the forecast period
- Detailed information on factors that will drive the growth and forecasting between 2025 and 2029
- Precise estimation of the size of the market and its contribution of the industry in focus to the parent market
- Accurate predictions about upcoming growth and trends and changes in consumer behaviour
- Growth of the market across North America, Europe, Asia, and Rest of World (ROW)
- Thorough analysis of the market's competitive landscape and detailed information about companies
- Comprehensive analysis of factors that will challenge the orthopedic soft tissue repair devices market growth of industry companies
We can help! Our analysts can customize this orthopedic soft tissue repair devices market research report to meet your requirements.
 RIA -
RIA - 
