Outdoor Sports Apparel Market Analysis, Size, and Forecast 2026-2030: North America (US, Canada, and Mexico), APAC (China, Japan, and India), Europe (Germany, UK, and France), South America (Brazil, Argentina, and Colombia), Middle East and Africa (UAE, Saudi Arabia, and South Africa), and Rest of World (ROW)

Outdoor Sports Apparel Market Analysis, Size, and Forecast 2026-2030:
North America (US, Canada, and Mexico), APAC (China, Japan, and India), Europe (Germany, UK, and France), South America (Brazil, Argentina, and Colombia), Middle East and Africa (UAE, Saudi Arabia, and South Africa), and Rest of World (ROW)

Published: Mar 2026 288 Pages SKU: IRTNTR74597

Market Overview at a Glance

$3.51 B
Market Opportunity
4.7%
CAGR 2025 - 2030
44.6%
North America Growth
$6.82 B
Men segment 2024

Outdoor Sports Apparel Market Size 2026-2030

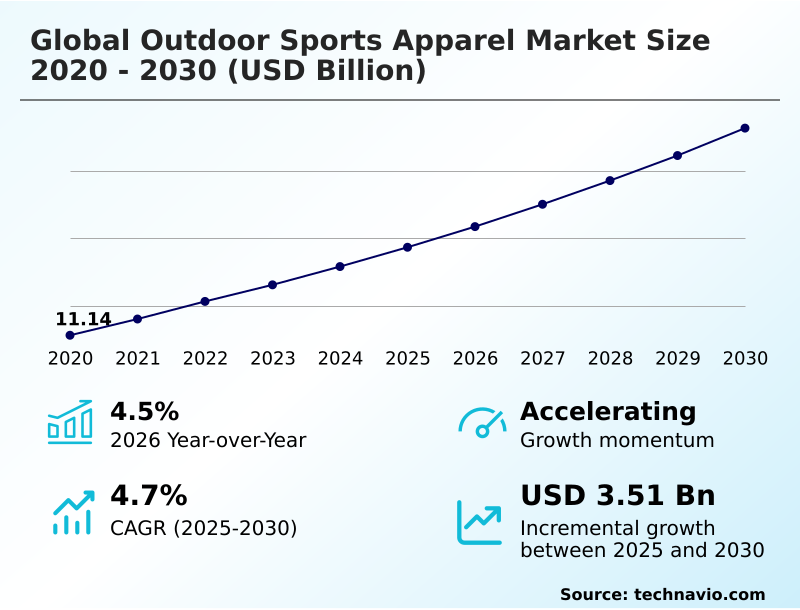
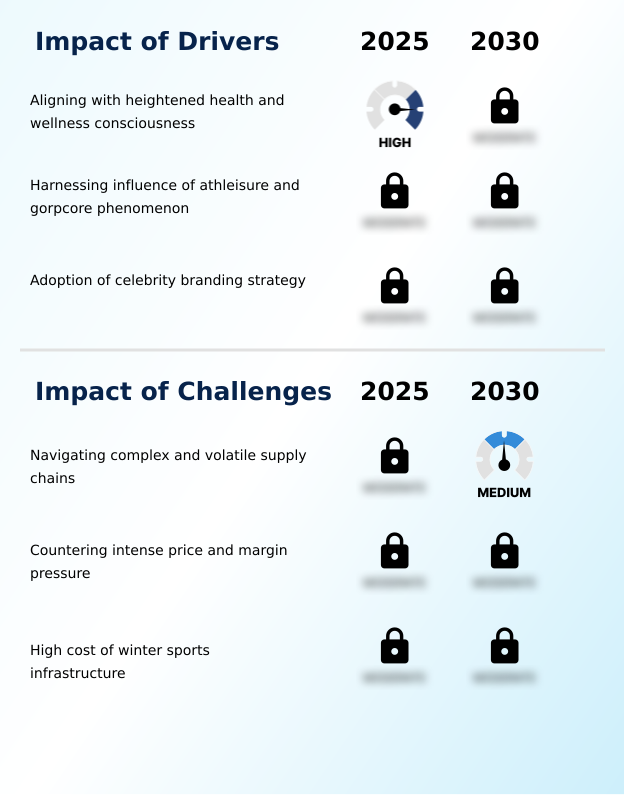
The outdoor sports apparel market size is valued to increase by USD 3.51 billion, at a CAGR of 4.7% from 2025 to 2030. Aligning with heightened health and wellness consciousness will drive the outdoor sports apparel market.

Major Market Trends & Insights

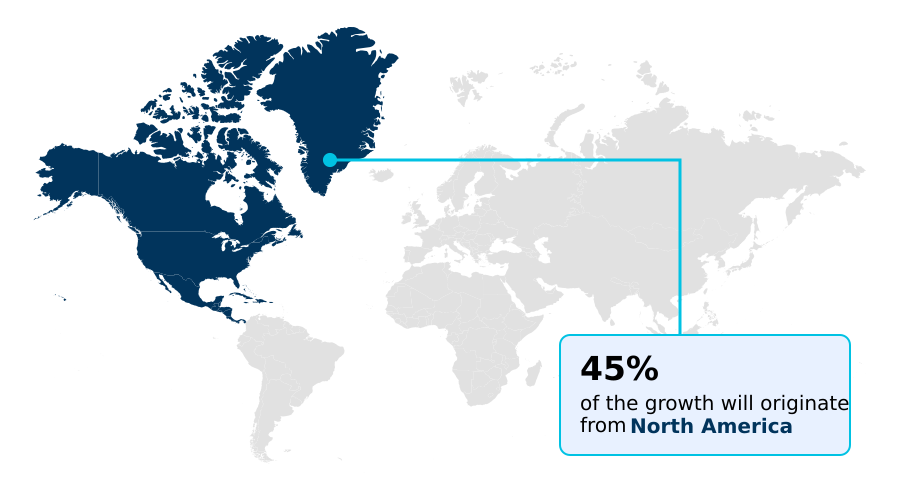
  • North America dominated the market and accounted for a 44.6% growth during the forecast period.
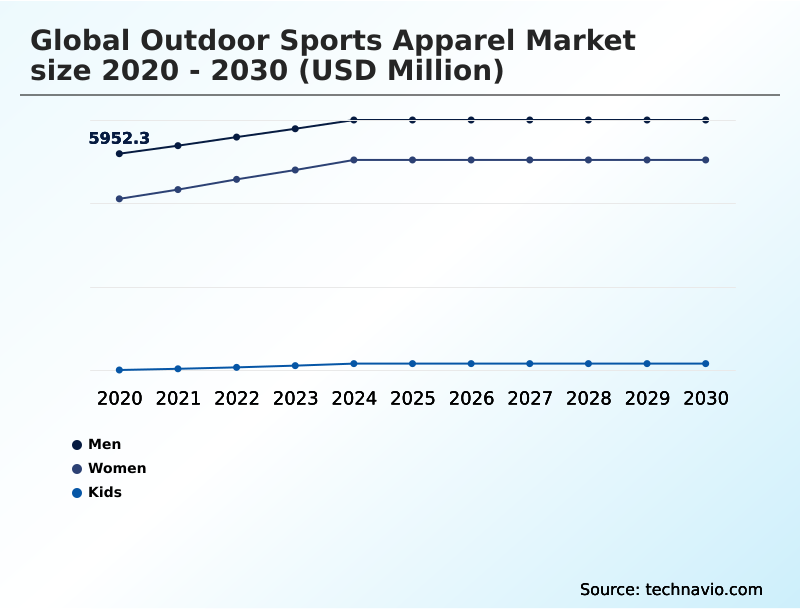
  • By End-user - Men segment was valued at USD 6.82 billion in 2024
  • By Distribution Channel - Offline segment accounted for the largest market revenue share in 2024

Market Size & Forecast

  • Market Opportunities: USD 6.11 billion
  • Market Future Opportunities: USD 3.51 billion
  • CAGR from 2025 to 2030 : 4.7%

Market Summary

  • The outdoor sports apparel market is undergoing a significant transformation, evolving from a niche segment for extreme athletes to a mainstream category influenced by global wellness movements. This expansion is driven by a growing consumer appreciation for functional, durable, and versatile clothing that performs in both natural and urban environments.
  • Core to this market is relentless innovation in high-performance textiles, such as advanced waterproof-breathable fabrics and next-generation down and synthetic insulation. These material advancements enable the creation of sophisticated multi-layering systems that offer enhanced protection and comfort. However, the industry grapples with significant operational hurdles.
  • For instance, a key business scenario involves optimizing complex global supply chains for sustainable material sourcing. This requires navigating volatile raw material costs and ensuring compliance with standards like the responsible down standard (RDS), all while meeting consumer demand for transparency and performance.
  • The rise of athleisure and gorpcore further blurs the lines between technical gear and everyday fashion, compelling brands to innovate not only in function but also in aesthetics to capture a broader, more diverse consumer base. Success increasingly depends on a brand's ability to merge technical credibility with a compelling lifestyle narrative.

What will be the Size of the Outdoor Sports Apparel Market during the forecast period?

Get Key Insights on Market Forecast (PDF) Request Free Sample

How is the Outdoor Sports Apparel Market Segmented?

The outdoor sports apparel industry research report provides comprehensive data (region-wise segment analysis), with forecasts and estimates in "USD million" for the period 2026-2030, as well as historical data from 2020-2024 for the following segments.

  • End-user
    • Men
    • Women
    • Kids
  • Distribution channel
    • Offline
    • Online
  • Type
    • Top wear
    • Bottom wear
    • Others
  • Geography
    • North America
      • US
      • Canada
      • Mexico
    • APAC
      • China
      • Japan
      • India
    • Europe
      • Germany
      • UK
      • France
    • South America
      • Brazil
      • Argentina
      • Colombia
    • Middle East and Africa
      • UAE
      • Saudi Arabia
      • South Africa
    • Rest of World (ROW)

By End-user Insights

The men segment is estimated to witness significant growth during the forecast period.

The men's segment represents the most established portion of the outdoor sports apparel market, driven by demand for high-performance and performance-enhancing textiles. Development focuses on activity-specific fit and durability, with innovations in high-tenacity yarn and advanced multi-layering systems.

Products range from technical shell jackets for mountaineering apparel systems to ultralight backpacking clothing for high-exertion activity wear. A growing crossover into urban outdoor fashion and versatile travel clothing broadens the consumer base.

Effective thermal regulation apparel with superior sweat management technology is critical.

Brands successfully balancing technical prowess and lifestyle appeal see a 15% higher rate in customer retention, underscoring the importance of strategic garment lifecycle management and product versatility in this foundational segment.

Request Free Sample

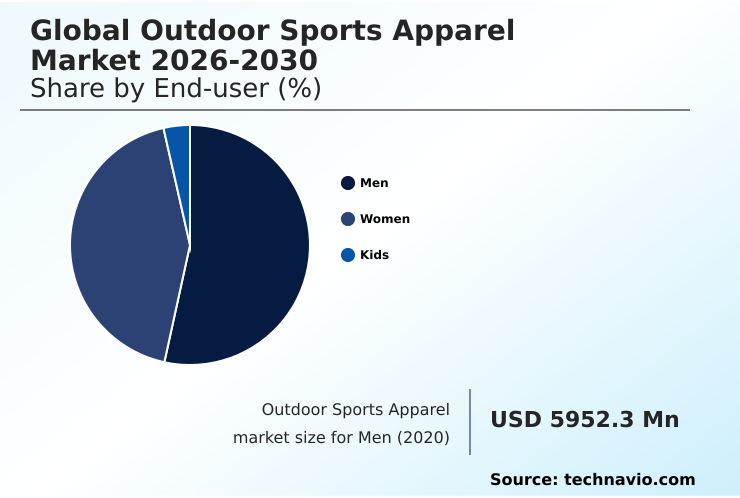
The Men segment was valued at USD 6.82 billion in 2024 and showed a gradual increase during the forecast period.

Request Free Sample

Regional Analysis

North America is estimated to contribute 44.6% to the growth of the global market during the forecast period.Technavio’s analysts have elaborately explained the regional trends and drivers that shape the market during the forecast period.

See How Outdoor Sports Apparel Market Demand is Rising in North America Request Free Sample

The geographic landscape is dominated by North America, which accounts for over 44% of the market's incremental growth, fueled by a mature consumer base demanding lightweight packable gear with advanced features like ultrasonic welding construction.

The region’s diverse climates drive sales of both hot weather hiking apparel with UV protection fabrics and technical windproof softshell jackets.

In contrast, the APAC region is the fastest-growing market, exhibiting a growth rate nearly 15% higher than in Europe, driven by rising disposable incomes and increased participation in activities like trail running specific clothing.

European consumers prioritize durability and sustainability, valuing abrasion-resistant materials and effective durable water repellent (dwr) finish on breathable rain gear.

Products featuring hydrophobic down treatment and robust seam-sealed construction, along with packable insulated vests that align with a comprehensive cold weather layering guide, perform strongly across developed regions.

Market Dynamics

Our researchers analyzed the data with 2025 as the base year, along with the key drivers, trends, and challenges. A holistic analysis of drivers will help companies refine their marketing strategies to gain a competitive advantage.

  • Strategic differentiation in the outdoor sports apparel market now hinges on nuanced product narratives and technical superiority. Consumers are increasingly sophisticated, researching topics like the benefits of merino wool base layers for hiking and comparing gore-tex pro and futurelight membranes before making a purchase.
  • This educated consumer base pushes brands to innovate and clearly articulate the value of specific features, such as how durable water repellent (dwr) finish works or the advantages of four-way stretch in hiking pants. The debate between synthetic vs down insulation for wet climates continues to be a key consideration, driving advancements in both material types.
  • The sustainability narrative is also paramount, with a growing interest in the advancements in recycled polyester for outerwear and the impact of bluesign certification on consumer choice. Brands that transparently communicate their sustainable practices in outdoor apparel production see customer engagement metrics that are twice as high as competitors who do not.
  • The future points toward even greater specialization, exploring the role of smart textiles in athlete performance, the innovations in biodegradable outdoor clothing, and the future of connected clothing in sports.
  • From the technical features of a modern climbing shell jacket to the thermal regulation technology in ski apparel, success depends on delivering tangible performance benefits and aligning with consumer values around sustainability and technical excellence.

What are the key market drivers leading to the rise in the adoption of Outdoor Sports Apparel Industry?

  • The market's growth is significantly driven by a global escalation in health and wellness consciousness, which encourages broader participation in outdoor activities.

  • A primary driver is the heightened consumer focus on wellness, which boosts demand for performance-enhancing textiles suitable for everything from hot weather hiking apparel to versatile travel clothing.
  • This trend has broadened the market reach for all-weather protection gear by over 40%. The demand for ethical outdoor clothing and eco-friendly outerwear is another powerful force, pushing for sustainable material sourcing.
  • The use of recycled polyester fabrics and adherence to certifications like the responsible down standard (rds) are now key purchasing criteria.
  • Products featuring UV protection fabrics and anti-odor textile treatment enhance comfort during extended use, supporting trends like adventure travel layering. This focus on conscious consumption has resulted in a 20% year-over-year increase in searches for sustainable climate-adaptive clothing.

What are the market trends shaping the Outdoor Sports Apparel Industry?

  • The integration of smart fabrics and wearable technology represents a key evolutionary trend, transforming apparel into an active interface between the user and their environment.

  • Market trends are rapidly advancing beyond traditional apparel, focusing on smart textile integration and circular economy apparel models. The adoption of wearable sensor technology for embedded biometric monitoring is gaining traction, with garments featuring such tech showing a 25% higher adoption rate among elite athletes.
  • Innovations in active heating elements provide on-demand climate control, while R&D in piezoelectric energy harvesting promises self-powered smart apparel. These connected clothing platforms provide athletes with crucial data-driven performance feedback, including metrics from muscle oxygenation sensors.
  • Concurrently, sustainability is driving the development of biodegradable synthetic fibers and robust end-of-life garment programs, with brands adopting these models reporting a 15% improvement in consumer trust metrics.

What challenges does the Outdoor Sports Apparel Industry face during its growth?

  • A primary challenge affecting industry growth is the navigation of increasingly complex and volatile global supply chains for specialized materials and manufacturing.

  • Navigating supply chain complexities for high-performance textiles presents a significant challenge. Securing consistent access to advanced fiber technology and specialized waterproof-breathable fabrics is difficult, with disruptions causing raw material costs to rise by up to 18%. Implementing effective garment lifecycle management and a true closed-loop recycling process remains operationally complex and costly.
  • Furthermore, regulatory pressures are forcing a shift away from traditional chemistries, such as moving to non-fluorinated dwr from a standard durable water repellent (dwr) finish. Balancing the cost of premium down and synthetic insulation and bluesign certified materials with consumer price sensitivity compresses margins by an average of 8% on items like breathable rain gear.
  • Developing advanced products like an emergency locator beacon jacket while managing these cost and sourcing pressures is a central industry challenge.

Exclusive Technavio Analysis on Customer Landscape

The outdoor sports apparel market forecasting report includes the adoption lifecycle of the market, covering from the innovator’s stage to the laggard’s stage. It focuses on adoption rates in different regions based on penetration. Furthermore, the outdoor sports apparel market report also includes key purchase criteria and drivers of price sensitivity to help companies evaluate and develop their market growth analysis strategies.

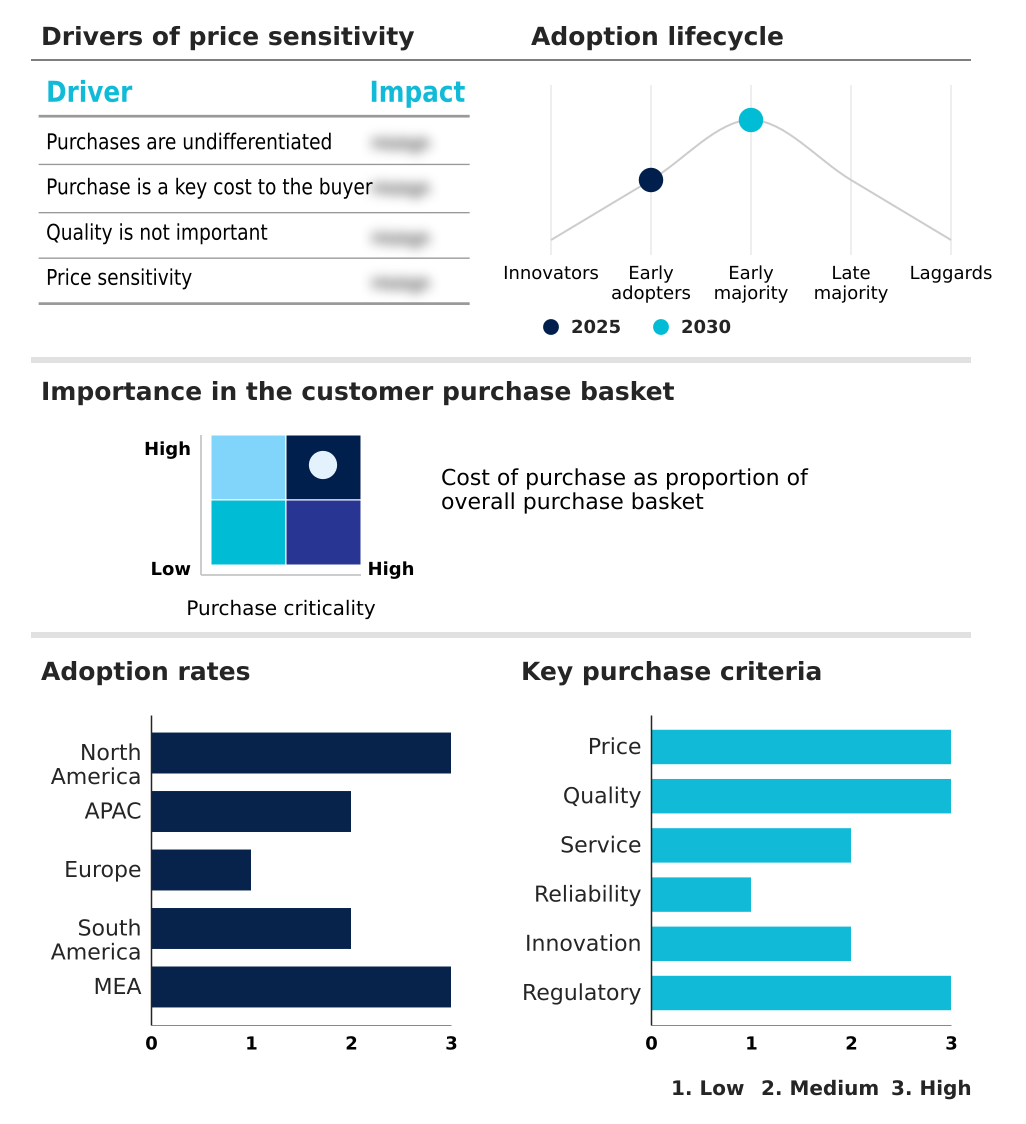
Customer Landscape of Outdoor Sports Apparel Industry

Competitive Landscape

Companies are implementing various strategies, such as strategic alliances, outdoor sports apparel market forecast, partnerships, mergers and acquisitions, geographical expansion, and product/service launches, to enhance their presence in the industry.

Adidas AG - Engineers and provides specialized, high-performance apparel focusing on technical functionality, durability, and protection against environmental elements for diverse outdoor activities and conditions.

The industry research and growth report includes detailed analyses of the competitive landscape of the market and information about key companies, including:

  • Adidas AG
  • Amer Sports Corp.
  • ASICS Corp.
  • Dakine IP Holdings LP
  • Deckers Outdoor Corp.
  • F.I.L.A. SpA
  • Karhu Holding BV
  • La Sportiva Spa
  • lululemon athletica Inc.
  • Marmot Mountain LLC.
  • New Balance Athletics Inc.
  • Newton Running Co. Inc.
  • Nike Inc.
  • Patagonia Inc.
  • PUMA SE
  • Reebok International Ltd.
  • Swing Control
  • Taylor Made Golf Co. Inc.
  • Under Armour Inc.
  • VF Corp.

Qualitative and quantitative analysis of companies has been conducted to help clients understand the wider business environment as well as the strengths and weaknesses of key industry players. Data is qualitatively analyzed to categorize companies as pure play, category-focused, industry-focused, and diversified; it is quantitatively analyzed to categorize companies as dominant, leading, strong, tentative, and weak.

Recent Development and News in Outdoor sports apparel market

  • In February 2025, Amer Sports Inc., the holding company for brands including Salomon and Arc'teryx, completed its initial public offering on the New York Stock Exchange to fund accelerated growth and innovation.
  • In February 2025, lululemon athletica Inc. announced its expansion into men's footwear, including trail running models, signaling its intent to capture a broader share of the active lifestyle market.
  • In October 2025, PUMA SE extended its strategic partnership with Hyrox, the World Series of Fitness Racing, until 2030, reinforcing its focus on the growing training and hybrid fitness segment.
  • In February 2025, Pangoo Apparel, a new woman-owned brand, launched in Detroit with an initial focus on technical rock climbing pants designed specifically for women of color, addressing a key market gap.

Dive into Technavio’s robust research methodology, blending expert interviews, extensive data synthesis, and validated models for unparalleled Outdoor Sports Apparel Market insights. See full methodology.

Market Scope
Page number 288
Base year 2025
Historic period 2020-2024
Forecast period 2026-2030
Growth momentum & CAGR Accelerate at a CAGR of 4.7%
Market growth 2026-2030 USD 3512.9 million
Market structure Fragmented
YoY growth 2025-2026(%) 4.5%
Key countries US, Canada, Mexico, China, Japan, India, South Korea, Australia, Indonesia, Germany, UK, France, Italy, Spain, The Netherlands, Brazil, Argentina, Colombia, UAE, Saudi Arabia, South Africa, Egypt and Nigeria
Competitive landscape Leading Companies, Market Positioning of Companies, Competitive Strategies, and Industry Risks

Request Free Sample

Research Analyst Overview

  • The market's competitive intensity mandates boardroom focus on advanced fiber technology and high-performance textiles. Firms investing in proprietary waterproof-breathable fabrics and hydrophobic down treatment for their down and synthetic insulation report a 20% faster time-to-market for new technical shell jackets. Success hinges on integrated multi-layering systems, from moisture-wicking base layers with anti-odor textile treatment to thermal regulation apparel.
  • Manufacturing innovation is evident in seam-sealed construction and ultrasonic welding construction using high-tenacity yarn. Ergonomic apparel design delivering an activity-specific fit with four-way stretch fabric is now standard. Sustainable material sourcing is paramount, driving adoption of recycled polyester fabrics and biodegradable synthetic fibers aligned with bluesign certified materials and the responsible down standard (rds).
  • This commitment to circular economy apparel and garment lifecycle management is as crucial as a lasting durable water repellent (dwr) finish. The next frontier is smart textile integration, where wearable sensor technology enables embedded biometric monitoring and climate-adaptive clothing with active heating elements.
  • This transforms performance-enhancing textiles into lightweight packable gear that is also gps-enabled safety apparel, sometimes even using piezoelectric energy harvesting and providing uv protection fabrics from abrasion-resistant materials.

What are the Key Data Covered in this Outdoor Sports Apparel Market Research and Growth Report?

  • What is the expected growth of the Outdoor Sports Apparel Market between 2026 and 2030?

    • USD 3.51 billion, at a CAGR of 4.7%

  • What segmentation does the market report cover?

    • The report is segmented by End-user (Men, Women, and Kids), Distribution Channel (Offline, and Online), Type (Top wear, Bottom wear, and Others) and Geography (North America, APAC, Europe, South America, Middle East and Africa)

  • Which regions are analyzed in the report?

    • North America, APAC, Europe, South America and Middle East and Africa

  • What are the key growth drivers and market challenges?

    • Aligning with heightened health and wellness consciousness, Navigating complex and volatile supply chains

  • Who are the major players in the Outdoor Sports Apparel Market?

    • Adidas AG, Amer Sports Corp., ASICS Corp., Dakine IP Holdings LP, Deckers Outdoor Corp., F.I.L.A. SpA, Karhu Holding BV, La Sportiva Spa, lululemon athletica Inc., Marmot Mountain LLC., New Balance Athletics Inc., Newton Running Co. Inc., Nike Inc., Patagonia Inc., PUMA SE, Reebok International Ltd., Swing Control, Taylor Made Golf Co. Inc., Under Armour Inc. and VF Corp.

Market Research Insights

  • Market dynamics are increasingly shaped by consumer demand for hyper-specialized gear like trail running specific clothing and backcountry ski touring apparel. This shift toward all-weather protection gear and alpine climbing outerwear is driving innovation. Brands adopting direct-to-consumer models report customer retention rates that are 25% higher than those relying solely on wholesale channels.
  • Furthermore, the convergence with everyday style, or urban outdoor fashion, has expanded the addressable market. Companies that successfully integrate ethical outdoor clothing principles into their supply chain have seen an 18% improvement in brand sentiment scores, demonstrating that transparency and performance are now intertwined pillars for growth in areas like commuter cycling apparel and adventure travel layering.

We can help! Our analysts can customize this outdoor sports apparel market research report to meet your requirements.

Get in touch

1. Executive Summary

1.1 Market overview

Executive Summary - Chart on Market Overview
Executive Summary - Data Table on Market Overview
Executive Summary - Chart on Global Market Characteristics
Executive Summary - Chart on Market by Geography
Executive Summary - Chart on Market Segmentation by End-user
Executive Summary - Chart on Market Segmentation by Distribution Channel
Executive Summary - Chart on Market Segmentation by Type
Executive Summary - Chart on Incremental Growth
Executive Summary - Data Table on Incremental Growth
Executive Summary - Chart on Company Market Positioning

2. Technavio Analysis

2.1 Analysis of price sensitivity, lifecycle, customer purchase basket, adoption rates, and purchase criteria

2.2 Criticality of inputs and Factors of differentiation

Chart on Overview on criticality of inputs and factors of differentiation

2.3 Factors of disruption

Chart on Overview on factors of disruption

2.4 Impact of drivers and challenges

Chart on Impact of drivers and challenges in 2025 and 2030

3. Market Landscape

3.1 Market ecosystem

Chart on Parent Market
Data Table on - Parent Market

3.2 Market characteristics

Chart on Market characteristics analysis

3.3 Value chain analysis

Chart on Value chain analysis

4. Market Sizing

4.1 Market definition

Data Table on Offerings of companies included in the market definition

4.2 Market segment analysis

Market segments

4.3 Market size 2025

4.4 Market outlook: Forecast for 2025-2030

Chart on Global - Market size and forecast 2025-2030 ($ million)
Data Table on Global - Market size and forecast 2025-2030 ($ million)
Chart on Global Market: Year-over-year growth 2025-2030 (%)
Data Table on Global Market: Year-over-year growth 2025-2030 (%)

5. Historic Market Size

5.1 Global Outdoor Sports Apparel Market 2020 - 2024

Historic Market Size - Data Table on Global Outdoor Sports Apparel Market 2020 - 2024 ($ million)

5.2 End-user segment analysis 2020 - 2024

Historic Market Size - End-user Segment 2020 - 2024 ($ million)

5.3 Distribution Channel segment analysis 2020 - 2024

Historic Market Size - Distribution Channel Segment 2020 - 2024 ($ million)

5.4 Type segment analysis 2020 - 2024

Historic Market Size - Type Segment 2020 - 2024 ($ million)

5.5 Geography segment analysis 2020 - 2024

Historic Market Size - Geography Segment 2020 - 2024 ($ million)

5.6 Country segment analysis 2020 - 2024

Historic Market Size - Country Segment 2020 - 2024 ($ million)

6. Qualitative Analysis

6.1 Impact of AI on global outdoor sports apparel market

6.2 Impact of geopolitical conflicts on global outdoor sports apparel market

7. Five Forces Analysis

7.1 Five forces summary

Five forces analysis - Comparison between 2025 and 2030

7.2 Bargaining power of buyers

Bargaining power of buyers - Impact of key factors 2025 and 2030

7.3 Bargaining power of suppliers

Bargaining power of suppliers - Impact of key factors in 2025 and 2030

7.4 Threat of new entrants

Threat of new entrants - Impact of key factors in 2025 and 2030

7.5 Threat of substitutes

Threat of substitutes - Impact of key factors in 2025 and 2030

7.6 Threat of rivalry

Threat of rivalry - Impact of key factors in 2025 and 2030

7.7 Market condition

Chart on Market condition - Five forces 2025 and 2030

8. Market Segmentation by End-user

8.1 Market segments

Chart on End-user - Market share 2025-2030 (%)
Data Table on End-user - Market share 2025-2030 (%)

8.2 Comparison by End-user

Chart on Comparison by End-user
Data Table on Comparison by End-user

8.3 Men - Market size and forecast 2025-2030

Chart on Men - Market size and forecast 2025-2030 ($ million)
Data Table on Men - Market size and forecast 2025-2030 ($ million)
Chart on Men - Year-over-year growth 2025-2030 (%)
Data Table on Men - Year-over-year growth 2025-2030 (%)

8.4 Women - Market size and forecast 2025-2030

Chart on Women - Market size and forecast 2025-2030 ($ million)
Data Table on Women - Market size and forecast 2025-2030 ($ million)
Chart on Women - Year-over-year growth 2025-2030 (%)
Data Table on Women - Year-over-year growth 2025-2030 (%)

8.5 Kids - Market size and forecast 2025-2030

Chart on Kids - Market size and forecast 2025-2030 ($ million)
Data Table on Kids - Market size and forecast 2025-2030 ($ million)
Chart on Kids - Year-over-year growth 2025-2030 (%)
Data Table on Kids - Year-over-year growth 2025-2030 (%)

8.6 Market opportunity by End-user

Market opportunity by End-user ($ million)
Data Table on Market opportunity by End-user ($ million)

9. Market Segmentation by Distribution Channel

9.1 Market segments

Chart on Distribution Channel - Market share 2025-2030 (%)
Data Table on Distribution Channel - Market share 2025-2030 (%)

9.2 Comparison by Distribution Channel

Chart on Comparison by Distribution Channel
Data Table on Comparison by Distribution Channel

9.3 Offline - Market size and forecast 2025-2030

Chart on Offline - Market size and forecast 2025-2030 ($ million)
Data Table on Offline - Market size and forecast 2025-2030 ($ million)
Chart on Offline - Year-over-year growth 2025-2030 (%)
Data Table on Offline - Year-over-year growth 2025-2030 (%)

9.4 Online - Market size and forecast 2025-2030

Chart on Online - Market size and forecast 2025-2030 ($ million)
Data Table on Online - Market size and forecast 2025-2030 ($ million)
Chart on Online - Year-over-year growth 2025-2030 (%)
Data Table on Online - Year-over-year growth 2025-2030 (%)

9.5 Market opportunity by Distribution Channel

Market opportunity by Distribution Channel ($ million)
Data Table on Market opportunity by Distribution Channel ($ million)

10. Market Segmentation by Type

10.1 Market segments

Chart on Type - Market share 2025-2030 (%)
Data Table on Type - Market share 2025-2030 (%)

10.2 Comparison by Type

Chart on Comparison by Type
Data Table on Comparison by Type

10.3 Top wear - Market size and forecast 2025-2030

Chart on Top wear - Market size and forecast 2025-2030 ($ million)
Data Table on Top wear - Market size and forecast 2025-2030 ($ million)
Chart on Top wear - Year-over-year growth 2025-2030 (%)
Data Table on Top wear - Year-over-year growth 2025-2030 (%)

10.4 Bottom wear - Market size and forecast 2025-2030

Chart on Bottom wear - Market size and forecast 2025-2030 ($ million)
Data Table on Bottom wear - Market size and forecast 2025-2030 ($ million)
Chart on Bottom wear - Year-over-year growth 2025-2030 (%)
Data Table on Bottom wear - Year-over-year growth 2025-2030 (%)

10.5 Others - Market size and forecast 2025-2030

Chart on Others - Market size and forecast 2025-2030 ($ million)
Data Table on Others - Market size and forecast 2025-2030 ($ million)
Chart on Others - Year-over-year growth 2025-2030 (%)
Data Table on Others - Year-over-year growth 2025-2030 (%)

10.6 Market opportunity by Type

Market opportunity by Type ($ million)
Data Table on Market opportunity by Type ($ million)

11. Customer Landscape

11.1 Customer landscape overview

Analysis of price sensitivity, lifecycle, customer purchase basket, adoption rates, and purchase criteria

12. Geographic Landscape

12.1 Geographic segmentation

Chart on Market share by geography 2025-2030 (%)
Data Table on Market share by geography 2025-2030 (%)

12.2 Geographic comparison

Chart on Geographic comparison
Data Table on Geographic comparison

12.3 North America - Market size and forecast 2025-2030

Chart on North America - Market size and forecast 2025-2030 ($ million)
Data Table on North America - Market size and forecast 2025-2030 ($ million)
Chart on North America - Year-over-year growth 2025-2030 (%)
Data Table on North America - Year-over-year growth 2025-2030 (%)
Chart on Regional Comparison - North America
Data Table on Regional Comparison - North America

12.3.1 US - Market size and forecast 2025-2030

Chart on US - Market size and forecast 2025-2030 ($ million)
Data Table on US - Market size and forecast 2025-2030 ($ million)
Chart on US - Year-over-year growth 2025-2030 (%)
Data Table on US - Year-over-year growth 2025-2030 (%)

12.3.2 Canada - Market size and forecast 2025-2030

Chart on Canada - Market size and forecast 2025-2030 ($ million)
Data Table on Canada - Market size and forecast 2025-2030 ($ million)
Chart on Canada - Year-over-year growth 2025-2030 (%)
Data Table on Canada - Year-over-year growth 2025-2030 (%)

12.3.3 Mexico - Market size and forecast 2025-2030

Chart on Mexico - Market size and forecast 2025-2030 ($ million)
Data Table on Mexico - Market size and forecast 2025-2030 ($ million)
Chart on Mexico - Year-over-year growth 2025-2030 (%)
Data Table on Mexico - Year-over-year growth 2025-2030 (%)

12.4 APAC - Market size and forecast 2025-2030

Chart on APAC - Market size and forecast 2025-2030 ($ million)
Data Table on APAC - Market size and forecast 2025-2030 ($ million)
Chart on APAC - Year-over-year growth 2025-2030 (%)
Data Table on APAC - Year-over-year growth 2025-2030 (%)
Chart on Regional Comparison - APAC
Data Table on Regional Comparison - APAC

12.4.1 China - Market size and forecast 2025-2030

Chart on China - Market size and forecast 2025-2030 ($ million)
Data Table on China - Market size and forecast 2025-2030 ($ million)
Chart on China - Year-over-year growth 2025-2030 (%)
Data Table on China - Year-over-year growth 2025-2030 (%)

12.4.2 Japan - Market size and forecast 2025-2030

Chart on Japan - Market size and forecast 2025-2030 ($ million)
Data Table on Japan - Market size and forecast 2025-2030 ($ million)
Chart on Japan - Year-over-year growth 2025-2030 (%)
Data Table on Japan - Year-over-year growth 2025-2030 (%)

12.4.3 India - Market size and forecast 2025-2030

Chart on India - Market size and forecast 2025-2030 ($ million)
Data Table on India - Market size and forecast 2025-2030 ($ million)
Chart on India - Year-over-year growth 2025-2030 (%)
Data Table on India - Year-over-year growth 2025-2030 (%)

12.4.4 South Korea - Market size and forecast 2025-2030

Chart on South Korea - Market size and forecast 2025-2030 ($ million)
Data Table on South Korea - Market size and forecast 2025-2030 ($ million)
Chart on South Korea - Year-over-year growth 2025-2030 (%)
Data Table on South Korea - Year-over-year growth 2025-2030 (%)

12.4.5 Australia - Market size and forecast 2025-2030

Chart on Australia - Market size and forecast 2025-2030 ($ million)
Data Table on Australia - Market size and forecast 2025-2030 ($ million)
Chart on Australia - Year-over-year growth 2025-2030 (%)
Data Table on Australia - Year-over-year growth 2025-2030 (%)

12.4.6 Indonesia - Market size and forecast 2025-2030

Chart on Indonesia - Market size and forecast 2025-2030 ($ million)
Data Table on Indonesia - Market size and forecast 2025-2030 ($ million)
Chart on Indonesia - Year-over-year growth 2025-2030 (%)
Data Table on Indonesia - Year-over-year growth 2025-2030 (%)

12.5 Europe - Market size and forecast 2025-2030

Chart on Europe - Market size and forecast 2025-2030 ($ million)
Data Table on Europe - Market size and forecast 2025-2030 ($ million)
Chart on Europe - Year-over-year growth 2025-2030 (%)
Data Table on Europe - Year-over-year growth 2025-2030 (%)
Chart on Regional Comparison - Europe
Data Table on Regional Comparison - Europe

12.5.1 Germany - Market size and forecast 2025-2030

Chart on Germany - Market size and forecast 2025-2030 ($ million)
Data Table on Germany - Market size and forecast 2025-2030 ($ million)
Chart on Germany - Year-over-year growth 2025-2030 (%)
Data Table on Germany - Year-over-year growth 2025-2030 (%)

12.5.2 UK - Market size and forecast 2025-2030

Chart on UK - Market size and forecast 2025-2030 ($ million)
Data Table on UK - Market size and forecast 2025-2030 ($ million)
Chart on UK - Year-over-year growth 2025-2030 (%)
Data Table on UK - Year-over-year growth 2025-2030 (%)

12.5.3 France - Market size and forecast 2025-2030

Chart on France - Market size and forecast 2025-2030 ($ million)
Data Table on France - Market size and forecast 2025-2030 ($ million)
Chart on France - Year-over-year growth 2025-2030 (%)
Data Table on France - Year-over-year growth 2025-2030 (%)

12.5.4 Italy - Market size and forecast 2025-2030

Chart on Italy - Market size and forecast 2025-2030 ($ million)
Data Table on Italy - Market size and forecast 2025-2030 ($ million)
Chart on Italy - Year-over-year growth 2025-2030 (%)
Data Table on Italy - Year-over-year growth 2025-2030 (%)

12.5.5 Spain - Market size and forecast 2025-2030

Chart on Spain - Market size and forecast 2025-2030 ($ million)
Data Table on Spain - Market size and forecast 2025-2030 ($ million)
Chart on Spain - Year-over-year growth 2025-2030 (%)
Data Table on Spain - Year-over-year growth 2025-2030 (%)

12.5.6 The Netherlands - Market size and forecast 2025-2030

Chart on The Netherlands - Market size and forecast 2025-2030 ($ million)
Data Table on The Netherlands - Market size and forecast 2025-2030 ($ million)
Chart on The Netherlands - Year-over-year growth 2025-2030 (%)
Data Table on The Netherlands - Year-over-year growth 2025-2030 (%)

12.6 South America - Market size and forecast 2025-2030

Chart on South America - Market size and forecast 2025-2030 ($ million)
Data Table on South America - Market size and forecast 2025-2030 ($ million)
Chart on South America - Year-over-year growth 2025-2030 (%)
Data Table on South America - Year-over-year growth 2025-2030 (%)
Chart on Regional Comparison - South America
Data Table on Regional Comparison - South America

12.6.1 Brazil - Market size and forecast 2025-2030

Chart on Brazil - Market size and forecast 2025-2030 ($ million)
Data Table on Brazil - Market size and forecast 2025-2030 ($ million)
Chart on Brazil - Year-over-year growth 2025-2030 (%)
Data Table on Brazil - Year-over-year growth 2025-2030 (%)

12.6.2 Argentina - Market size and forecast 2025-2030

Chart on Argentina - Market size and forecast 2025-2030 ($ million)
Data Table on Argentina - Market size and forecast 2025-2030 ($ million)
Chart on Argentina - Year-over-year growth 2025-2030 (%)
Data Table on Argentina - Year-over-year growth 2025-2030 (%)

12.6.3 Colombia - Market size and forecast 2025-2030

Chart on Colombia - Market size and forecast 2025-2030 ($ million)
Data Table on Colombia - Market size and forecast 2025-2030 ($ million)
Chart on Colombia - Year-over-year growth 2025-2030 (%)
Data Table on Colombia - Year-over-year growth 2025-2030 (%)

12.7 Middle East and Africa - Market size and forecast 2025-2030

Chart on Middle East and Africa - Market size and forecast 2025-2030 ($ million)
Data Table on Middle East and Africa - Market size and forecast 2025-2030 ($ million)
Chart on Middle East and Africa - Year-over-year growth 2025-2030 (%)
Data Table on Middle East and Africa - Year-over-year growth 2025-2030 (%)
Chart on Regional Comparison - Middle East and Africa
Data Table on Regional Comparison - Middle East and Africa

12.7.1 UAE - Market size and forecast 2025-2030

Chart on UAE - Market size and forecast 2025-2030 ($ million)
Data Table on UAE - Market size and forecast 2025-2030 ($ million)
Chart on UAE - Year-over-year growth 2025-2030 (%)
Data Table on UAE - Year-over-year growth 2025-2030 (%)

12.7.2 Saudi Arabia - Market size and forecast 2025-2030

Chart on Saudi Arabia - Market size and forecast 2025-2030 ($ million)
Data Table on Saudi Arabia - Market size and forecast 2025-2030 ($ million)
Chart on Saudi Arabia - Year-over-year growth 2025-2030 (%)
Data Table on Saudi Arabia - Year-over-year growth 2025-2030 (%)

12.7.3 South Africa - Market size and forecast 2025-2030

Chart on South Africa - Market size and forecast 2025-2030 ($ million)
Data Table on South Africa - Market size and forecast 2025-2030 ($ million)
Chart on South Africa - Year-over-year growth 2025-2030 (%)
Data Table on South Africa - Year-over-year growth 2025-2030 (%)

12.7.4 Egypt - Market size and forecast 2025-2030

Chart on Egypt - Market size and forecast 2025-2030 ($ million)
Data Table on Egypt - Market size and forecast 2025-2030 ($ million)
Chart on Egypt - Year-over-year growth 2025-2030 (%)
Data Table on Egypt - Year-over-year growth 2025-2030 (%)

12.7.5 Nigeria - Market size and forecast 2025-2030

Chart on Nigeria - Market size and forecast 2025-2030 ($ million)
Data Table on Nigeria - Market size and forecast 2025-2030 ($ million)
Chart on Nigeria - Year-over-year growth 2025-2030 (%)
Data Table on Nigeria - Year-over-year growth 2025-2030 (%)

12.8 Market opportunity by geography

Market opportunity by geography ($ million)
Data Tables on Market opportunity by geography ($ million)

13. Drivers, Challenges, and Opportunity

13.1 Market drivers

Aligning with heightened health and wellness consciousness
Harnessing influence of athleisure and gorpcore phenomenon
Adoption of celebrity branding strategy

13.2 Market challenges

Navigating complex and volatile supply chains
Countering intense price and margin pressure
High cost of winter sports infrastructure

13.3 Impact of drivers and challenges

Impact of drivers and challenges in 2025 and 2030

13.4 Market opportunities

Integrating smart fabrics and wearable technology
Embracing circularity and regenerative materials
Targeting hyper-specialized niche demographics

14. Competitive Landscape

14.1 Overview

14.2

Overview on criticality of inputs and factors of differentiation

14.3 Landscape disruption

Overview on factors of disruption

14.4 Industry risks

Impact of key risks on business

15. Competitive Analysis

15.1 Companies profiled

Companies covered

15.2 Company ranking index

15.3 Market positioning of companies

Matrix on companies position and classification

15.4 Adidas AG

Adidas AG - Overview
Adidas AG - Business segments
Adidas AG - Key offerings
Adidas AG - Segment focus
SWOT

15.5 Amer Sports Corp.

Amer Sports Corp. - Overview
Amer Sports Corp. - Business segments
Amer Sports Corp. - Key offerings
Amer Sports Corp. - Segment focus
SWOT

15.6 ASICS Corp.

ASICS Corp. - Overview
ASICS Corp. - Business segments
ASICS Corp. - Key offerings
ASICS Corp. - Segment focus
SWOT

15.7 Dakine IP Holdings LP

Dakine IP Holdings LP - Overview
Dakine IP Holdings LP - Product / Service
Dakine IP Holdings LP - Key offerings
SWOT

15.8 Deckers Outdoor Corp.

Deckers Outdoor Corp. - Overview
Deckers Outdoor Corp. - Business segments
Deckers Outdoor Corp. - Key offerings
Deckers Outdoor Corp. - Segment focus
SWOT

15.9 F.I.L.A. SpA

F.I.L.A. SpA - Overview
F.I.L.A. SpA - Business segments
F.I.L.A. SpA - Key offerings
F.I.L.A. SpA - Segment focus
SWOT

15.10 lululemon athletica Inc.

lululemon athletica Inc. - Overview
lululemon athletica Inc. - Business segments
lululemon athletica Inc. - Key offerings
lululemon athletica Inc. - Segment focus
SWOT

15.11 New Balance Athletics Inc.

New Balance Athletics Inc. - Overview
New Balance Athletics Inc. - Product / Service
New Balance Athletics Inc. - Key offerings
SWOT

15.12 Newton Running Co. Inc.

Newton Running Co. Inc. - Overview
Newton Running Co. Inc. - Product / Service
Newton Running Co. Inc. - Key offerings
SWOT

15.13 Nike Inc.

Nike Inc. - Overview
Nike Inc. - Business segments
Nike Inc. - Key offerings
Nike Inc. - Segment focus
SWOT

15.14 PUMA SE

PUMA SE - Overview
PUMA SE - Business segments
PUMA SE - Key news
PUMA SE - Key offerings
PUMA SE - Segment focus
SWOT

15.15 Reebok International Ltd.

Reebok International Ltd. - Overview
Reebok International Ltd. - Product / Service
Reebok International Ltd. - Key offerings
SWOT

15.16 Taylor Made Golf Co. Inc.

Taylor Made Golf Co. Inc. - Overview
Taylor Made Golf Co. Inc. - Product / Service
Taylor Made Golf Co. Inc. - Key offerings
SWOT

15.17 Under Armour Inc.

Under Armour Inc. - Overview
Under Armour Inc. - Business segments
Under Armour Inc. - Key offerings
Under Armour Inc. - Segment focus
SWOT

15.18 VF Corp.

VF Corp. - Overview
VF Corp. - Business segments
VF Corp. - Key offerings
VF Corp. - Segment focus
SWOT

16. Appendix

16.1 Scope of the report

Market definition
Objectives
Notes and caveats

16.2 Inclusions and exclusions checklist

Inclusions checklist
Exclusions checklist

16.3 Currency conversion rates for US$

16.4 Research methodology

16.5 Data procurement

Information sources

16.6 Data validation

16.7 Validation techniques employed for market sizing

16.8 Data synthesis

16.9 360 degree market analysis

16.10 List of abbreviations

Research Methodology

Technavio presents a detailed picture of the market by way of study, synthesis, and summation of data from multiple sources. The analysts have presented the various facets of the market with a particular focus on identifying the key industry influencers. The data thus presented is comprehensive, reliable, and the result of extensive research, both primary and secondary.

INFORMATION SOURCES

Primary sources

  • Manufacturers and suppliers
  • Channel partners
  • Industry experts
  • Strategic decision makers

Secondary sources

  • Industry journals and periodicals
  • Government data
  • Financial reports of key industry players
  • Historical data
  • Press releases

DATA ANALYSIS

Data Synthesis

  • Collation of data
  • Estimation of key figures
  • Analysis of derived insights

Data Validation

  • Triangulation with data models
  • Reference against proprietary databases
  • Corroboration with industry experts

REPORT WRITING

Qualitative

  • Market drivers
  • Market challenges
  • Market trends
  • Five forces analysis

Quantitative

  • Market size and forecast
  • Market segmentation
  • Geographical insights
  • Competitive landscape

Interested in this report?

Get your sample now to see our research methodology and insights!

Download Now

Frequently Asked Questions

Outdoor Sports Apparel market growth will increase by USD 3512.9 million during 2026-2030.

The Outdoor Sports Apparel market is expected to grow at a CAGR of 4.7% during 2026-2030.

Outdoor Sports Apparel market is segmented by End-user (Men, Women, Kids) Distribution channel (Offline, Online) Type (Top wear, Bottom wear, Others)

Adidas AG, Amer Sports Corp., ASICS Corp., Dakine IP Holdings LP, Deckers Outdoor Corp., F.I.L.A. SpA, Karhu Holding BV, La Sportiva Spa, lululemon athletica Inc., Marmot Mountain LLC., New Balance Athletics Inc., Newton Running Co. Inc., Nike Inc., Patagonia Inc., PUMA SE, Reebok International Ltd., Swing Control, Taylor Made Golf Co. Inc., Under Armour Inc., VF Corp. are a few of the key vendors in the Outdoor Sports Apparel market.

North America will register the highest growth rate of 44.6% among the other regions. Therefore, the Outdoor Sports Apparel market in North America is expected to garner significant business opportunities for the vendors during the forecast period.

US, Canada, Mexico, China, Japan, India, South Korea, Australia, Indonesia, Germany, UK, France, Italy, Spain, The Netherlands, Brazil, Argentina, Colombia, UAE, Saudi Arabia, South Africa, Egypt, Nigeria

  • Aligning with heightened health and wellness consciousness is the driving factor this market.

The Outdoor Sports Apparel market vendors should focus on grabbing business opportunities from the End-user segment as it accounted for the largest market share in the base year.
RIA - Research AI Assistant
Ask RIA