
Over-The-Counter (OTC) Analgesics Market Size 2024-2028
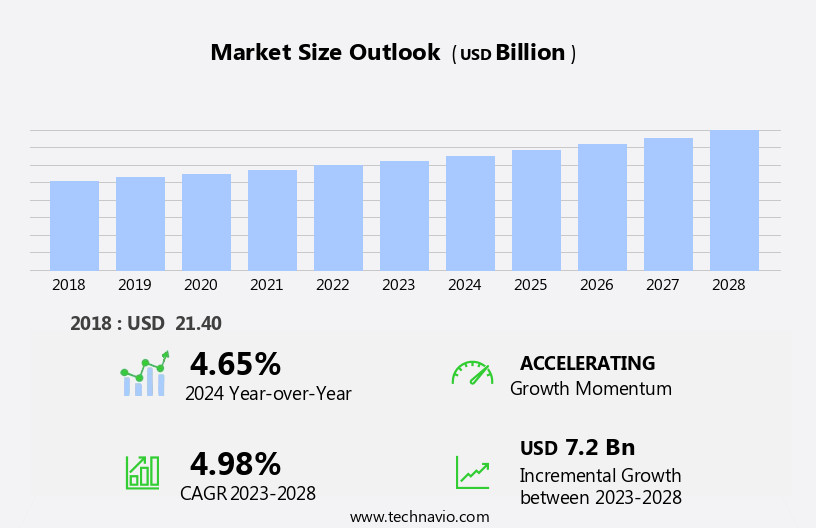
The over-the-counter (OTC) analgesics market size is forecast to increase by USD 7.2 billion at a CAGR of 4.98% between 2023 and 2028.
- The market is experiencing significant growth, driven by the increasing aging population worldwide and the rising number of product launches. The global population aged 60 and above is projected to more than double by 2050, creating a substantial demand for pain relief solutions. This demographic shift, coupled with the growing awareness and acceptance of self-care, is fueling the market's expansion. OTC drugs encompass a wide range of therapeutic areas, including analgesics, weight loss products, gastrointestinal products, skin products, mineral supplements, vitamin supplements, sleeping aids, ophthalmic products, sports nutrition, sports supplements, vitamins, minerals, amino acids, probiotics, omega-3 fatty acids, carbohydrates, and botanicals. However, the market's growth is not without challenges. The number of product recalls due to safety concerns and regulatory issues has been on the rise, posing significant risks for market players. These incidents can lead to reputational damage, regulatory penalties, and lost sales.
- Companies must prioritize product safety and quality to mitigate these risks and maintain consumer trust. To capitalize on the market opportunities and navigate challenges effectively, companies should focus on innovation, regulatory compliance, and strategic partnerships. The market is responding to this trend with an expanding range of products and services, including over-the-counter medicines, and digital health solutions. Investing in research and development to launch new products that cater to the evolving consumer preferences and regulatory requirements can help companies stay competitive. Building strong relationships with regulatory bodies and industry associations can also help companies navigate the complex regulatory landscape and mitigate risks associated with product recalls. By addressing these challenges and leveraging market trends, companies can seize opportunities in the growing OTC Analgesics Market.
What will be the Size of the Over-The-Counter (OTC) Analgesics Market during the forecast period?
- The market encompasses a wide range of pain medicines, including nonsteroidal anti-inflammatory drugs (NSAIDs) and topical analgesics, designed to alleviate various types of pain, such as joint pain and chronic pain. These products are readily available in multiple distribution channels, including hospital pharmacies, retail pharmacies, and online pharmacies. The geriatric population and the aging population are significant consumer groups, given the prevalence of joint pains and chronic conditions among older adults. Pregnant women also utilize OTC pain medicines for certain indications, following consultation with healthcare professionals.
- Internal OTC analgesics and external OTC analgesics cater to different pain management needs. Off-label uses of these drugs continue to expand, reflecting the evolving role of OTC analgesics in pain management programs. The market's size and growth are influenced by factors such as increasing prevalence of chronic pain conditions, expanding distribution channels, and consumer preferences for self-care and convenience.
How is this Over-The-Counter (OTC) Analgesics Industry segmented?
The over-the-counter (OTC) analgesics industry research report provides comprehensive data (region-wise segment analysis), with forecasts and estimates in "USD billion" for the period 2024-2028, as well as historical data from 2018-2022 for the following segments.
- Type
- Internal
- External
- Distribution Channel
- Offline
- Online
- Form Factor
- Tablets and capsules
- Topical
- Syrups
- Others
- Geography
- North America
- US
- Canada
- Europe
- France
- Germany
- Italy
- UK
- APAC
- China
- India
- Japan
- South America
- Brazil
- Rest of World (ROW)
- North America
By Type Insights
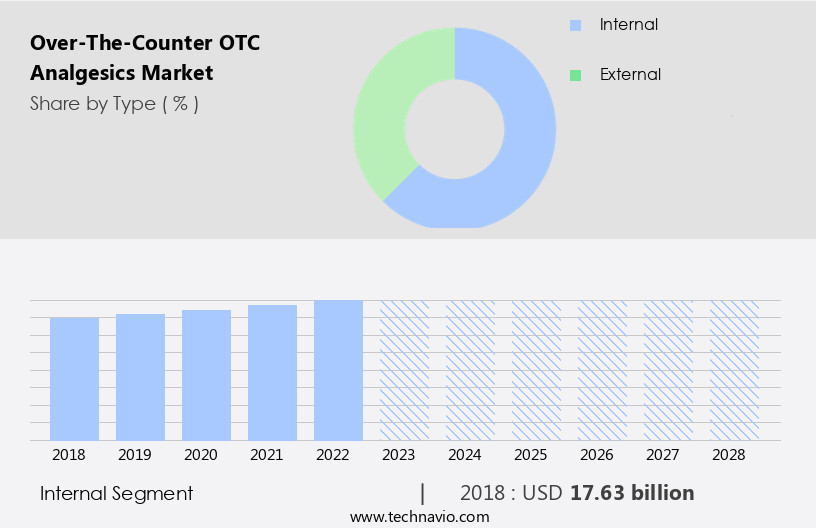
The internal segment is estimated to witness significant growth during the forecast period. The market encompasses internal and external analgesics used for pain relief. Internal analgesics, meant for ingestion, dominate the market, accounting for the largest share in 2023. Major drugs in this segment include acetaminophen, aspirin, and nonsteroidal anti-inflammatory drugs (NSAIDs), such as ibuprofen and naproxen. Factors driving market growth include increasing pain-related conditions, self-medication trend, and healthcare expenditure. Key players invest in advertising campaigns to promote their brands, including Aleve, Advil, Crocin, MOTRIN, Aspirin, Excedrin, and TYLENOL. Chronic pain disorders, particularly among the geriatric population, pregnant women, and middle-lower class families, fuel demand for OTC analgesics. Distribution through hospital pharmacies, retail pharmacies, online pharmacies, and distribution stores further expands accessibility.
Safety concerns and price sensitivity influence consumer preferences. Internal analgesics offer relief for chronic back pain, arthritis, and musculoskeletal diseases, among others. Despite stringent regulations, the market continues to grow, driven by increasing health awareness and the availability of non-opioid analgesics.
Get a glance at the market report of share of various segments Request Free Sample
The Internal segment was valued at USD 17.63 billion in 2018 and showed a gradual increase during the forecast period.
Regional Analysis
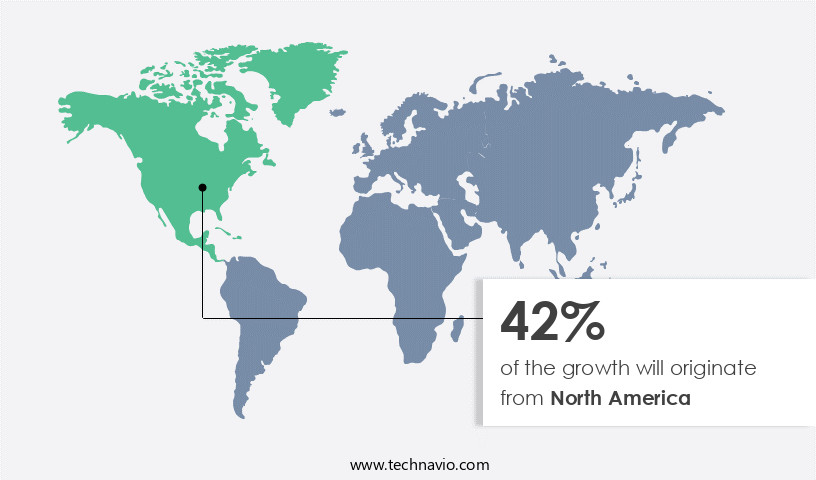
North America is estimated to contribute 42% to the growth of the global market during the forecast period. Technavio's analysts have elaborately explained the regional trends and drivers that shape the market during the forecast period.
For more insights on the market size of various regions, Request Free Sample
The North American market is projected to expand due to several factors, including rising healthcare expenditures, a large population suffering from pain-related conditions and arthritis, a strong company presence, and supportive government policies. The market is predominantly driven by the US, with a significant number of adults experiencing common conditions such as headaches, migraines, arthritis, muscle sprains, and joint pain. According to the National Institutes of Health (NIH), approximately 1 in 6 men and 1 in 5 women in the US report migraines and severe headaches, highlighting the market's potential. Self-medication trends, particularly for chronic pain disorders like arthritis, contribute to the market's growth.
The market encompasses both internal analgesics, such as Nonsteroidal Anti-Inflammatory Drugs (NSAIDs) and salicylates, and external analgesics, including topical creams and gels. The geriatric population, pregnant women, middle-lower class families, and those suffering from chronic back pain, axial spondyloarthritis, musculoskeletal diseases, sports-related injuries, and arthritis pain are key consumer groups. The market includes various distribution channels, such as hospital pharmacies, retail pharmacies, online pharmacies, and distribution stores. Regulations governing the sale and use of OTC analgesics are stringent to ensure safety and efficacy. Consumer preferences and medication costs also influence market dynamics. Pain management programs, advertising campaigns, and the aging population further contribute to the market's growth.
Market Dynamics
Our researchers analyzed the data with 2023 as the base year, along with the key drivers, trends, and challenges. A holistic analysis of drivers will help companies refine their marketing strategies to gain a competitive advantage.
What are the key market drivers leading to the rise in the adoption of Over-The-Counter (OTC) Analgesics Industry?
- Growing aging population globally is the key driver of the market. The global population demographic is undergoing a significant transformation, with an increasing number of elderly individuals worldwide. In 2022, over 771 million people were aged 65 or above, representing approximately 10% of the global population. As people live longer lives, they face age-related health issues and a higher likelihood of experiencing chronic pain and discomfort. This demographic shift is driving the demand for accessible and effective pain relief solutions, making OTC analgesics an essential response to this growing need. Elderly individuals often grapple with conditions like arthritis, musculoskeletal disorders, and various age-related ailments, leading to chronic pain.
- OTC analgesics offer a convenient and affordable solution for managing pain and discomfort, making them a popular choice among consumers. The rising prominence of online retailing is also contributing to market expansion, as consumers increasingly turn to e-commerce platforms for convenience and accessibility. The market for OTC analgesics is expected to grow as the global population ages, providing opportunities for companies to cater to the increasing demand for effective pain relief solutions.
What are the market trends shaping the Over-The-Counter (OTC) Analgesics Industry?
- Growing number of launches of OTC analgesics is the upcoming market trend. The market is witnessing significant growth due to the increasing demand for effective and tolerable pain relief medications. This market presents substantial opportunities for companies, driven by a large patient base and rising preference for OTC drugs. Companies are investing in research and development to introduce new OTC analgesics with innovative formulations. For instance, in February 2020, GlaxoSmithKline obtained US FDA approval for Voltaren Arthritis Pain (diclofenac sodium topical gel, 1%) as an OTC product for adults above 18 years, offering temporary relief from arthritis pain in specified body parts.
- This approval expanded the company's product portfolio and increased sales. The increasing use of off-label drugs is one of the significant trends spurring the growth prospects of this market over the forecast period. Several off-label drugs, such as tricyclic antidepressants, selective serotonin reuptake inhibitors, antihistamines, anti-anxiety drugs, anticonvulsants, steroids, and analgesics are being increasingly used to manage the symptoms of pain.
What challenges does the Over-The-Counter (OTC) Analgesics Industry face during its growth?
- Growing number of product recalls is a key challenge affecting the industry growth. The pharmaceutical industry faces the challenge of product recalls due to safety and regulatory compliance concerns. Urbanization and consumerism have led to an increase in the consumption of artificial and synthetic food, contributing to the rise of lifestyle diseases such as obesity, Type 2 diabetes, heart disease, stroke, and atherosclerosis. Manufacturers must address issues related to drug composition, warning labels, expiry dates, and labeling accuracy to prevent potential harm to patients. Recalls may result from manufacturing defects, technical errors, or API concentration discrepancies. These incidents can significantly impact a company's reputation and financial performance. To maintain consumer trust and adhere to regulatory guidelines, manufacturers must promptly identify and rectify any issues, ensuring the quality and safety of their products.
Exclusive Customer Landscape
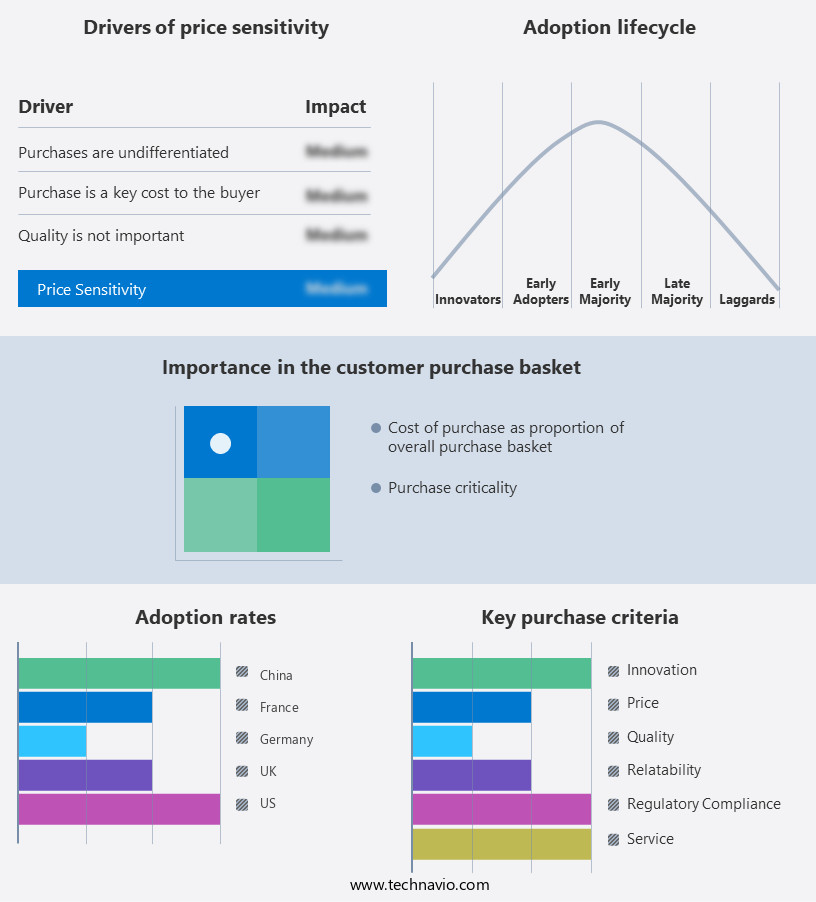
The over-the-counter (OTC) analgesics market forecasting report includes the adoption lifecycle of the market, covering from the innovator's stage to the laggard's stage. It focuses on adoption rates in different regions based on penetration. Furthermore, the over-the-counter (OTC) analgesics market report also includes key purchase criteria and drivers of price sensitivity to help companies evaluate and develop their market growth analysis strategies.
Customer Landscape
Key Companies & Market Insights
Companies are implementing various strategies, such as strategic alliances, over-the-counter (OTC) analgesics market forecast, partnerships, mergers and acquisitions, geographical expansion, and product/service launches, to enhance their presence in the industry.
AKUMS - The company specializes in providing over-the-counter analgesics designed for managing chronic pain and migraines.
The industry research and growth report includes detailed analyses of the competitive landscape of the market and information about key companies, including:
- AKUMS
- AstraZeneca Plc
- Bayer AG
- Boehringer Ingelheim International GmbH
- Cardinal Health Inc.
- Cipla Inc.
- CV Sciences Inc.
- Endo International Plc
- GlaxoSmithKline Plc
- Medterra CBD
- Novartis AG
- Perrigo Co. Plc
- Pfizer Inc.
- Piramal Enterprises Ltd.
- Reckitt Benckiser Group Plc
- Sanofi SA
- Sun Pharmaceutical Industries Ltd.
- Takeda Pharmaceutical Co. Ltd.
- Teva Pharmaceutical Industries Ltd.
- Viatris Inc.
- Weefsel Pharma
Qualitative and quantitative analysis of companies has been conducted to help clients understand the wider business environment as well as the strengths and weaknesses of key industry players. Data is qualitatively analyzed to categorize companies as pure play, category-focused, industry-focused, and diversified; it is quantitatively analyzed to categorize companies as dominant, leading, strong, tentative, and weak.
Research Analyst Overview
The market encompasses a wide range of pain relief products designed to alleviate various types of discomfort. These medications cater to the self-medication trend, allowing individuals to manage their joint pains and other chronic conditions without a prescription. The market consists of two primary segments: nonsteroidal anti-inflammatory drugs (NSAIDs) and salicylates. NSAIDs, which include ibuprofen and naproxen, are effective in managing inflammation and pain associated with musculoskeletal diseases, arthritis, and sports-related injuries. Salicylates, such as aspirin, are another category of OTC analgesics that provide relief from pain, fever, and inflammation. The market for OTC analgesics extends beyond traditional retail pharmacies, with hospital pharmacies and online pharmacies also playing significant roles.
The Over The Counter (OTC) Analgesics Market is transforming with a focus on consumer empowerment and improved health literacy, enabling better patient engagement and enhanced health outcomes. Strategies like cost containment and healthcare affordability support access to pain relief solutions, ensuring sustainable healthcare worldwide. In global health, emerging markets play a crucial role, influenced by economic factors, social factors, and cultural factors linked to lifestyle factors and chronic disease prevalence. The industry aligns with public health initiatives through standardized pain management guidelines, pain management protocols, and evidence-based practice. Clinical practice guidelines drive innovation and accessibility, shaping the future of OTC analgesics in diverse healthcare settings and making pain management more efficient and effective for all.
Analgesic efficacy and analgesic safety are key factors influencing purchases, with pain relief duration playing a crucial role in product selection. Analgesic brand loyalty depends on analgesic consumer preferences, shaped by analgesic advertising strategies and the analgesic regulatory landscape. Ongoing analgesic product development and analgesic formulation innovations improve effectiveness, while advanced analgesic delivery systems enhance convenience. Analgesic clinical studies assess analgesic drug interactions, analgesic adverse effects, and different analgesic dosage forms to ensure safety. Packaging and analgesic labeling influence consumer trust, while analgesic pricing strategies, analgesic distribution channels, and analgesic market segmentation target specific demographics. Factors like analgesic purchasing habits, analgesic brand awareness, and analgesic market competition shape the industry's future.
The market is evolving with advancements in clinical trials and drug safety regulations, ensuring effective pain relief. Generic drug manufacturers and brand-name drug manufacturers compete through marketing and advertising, utilizing digital marketing and social media marketing for direct-to-consumer advertising. Product differentiation is key in new drug development, incorporating formulation technologies and drug delivery systems to enhance pain relief technologies. AI-driven artificial intelligence (AI) and machine learning support data analytics and predictive analytics, enabling personalized medicine and precision medicine. Innovations in pain management apps, virtual healthcare, and health monitoring integrate wearable technology for pain tracking and pain management tools, shaping the future of OTC analgesics.
The geriatric population, middle-lower class families, and pregnant women are among the primary consumers of these products due to the prevalence of chronic pain disorders and the affordability of OTC medications compared to prescription drugs. Chronic pain, a common ailment affecting millions worldwide, drives the demand for pain medicines. Pharmaceutical businesses have responded with advertising campaigns and expanded product offerings to cater to this need. However, consumer preferences and price sensitivity remain crucial factors influencing market dynamics. The holistic health movement and increasing awareness of non-opioid analgesics have led to a growing interest in topical analgesics and non-prescription pain management programs.
The aging population, with its higher prevalence of chronic pain conditions, further bolsters the market's growth. Despite the benefits, there are concerns regarding the misuse and wrong medication of OTC analgesics, particularly among the elderly and those with underlying health conditions. Strict regulations aim to mitigate these risks, ensuring the safety and efficacy of these medications. Cardiovascular disease, muscle injuries, and brain damage are potential side effects associated with certain OTC analgesics, particularly NSAIDs and salicylates. These risks, along with the availability of alternative pain relief methods, such as chiropractic clinics and acupuncture, add complexity to the market landscape.
The Over The Counter (OTC) Analgesics Market is expanding as consumers seek accessible solutions for menstrual cramps and other pain conditions. Oral analgesics remain the most popular choice, with diverse analgesic formulations catering to different needs. Understanding drug interactions is crucial for safe use, especially in consumer self-medication. Widely available in grocery stores, convenience stores, and online retailers, OTC analgesics offer easy access. As prescription alternatives, they include both generic medications and brand-name medications, supported by patient education and consumer awareness initiatives. Ensuring medication adherence aids in chronic pain management, with guidance from pain management clinics and pain management professionals. Interest in alternative medicine, such as herbal remedies, natural pain relief, homeopathic remedies, and functional foods, continues to grow alongside innovations in drug delivery.
The distribution of OTC analgesics extends beyond traditional pharmacies, with off-label drugs and pain management programs offering additional avenues for sales growth. Online distribution channels, including e-commerce platforms and telehealth services, have also emerged as significant players in the market. Regulatory approval processes and health awareness campaigns are essential for ensuring the safe and effective use of OTC analgesics. Consumers seeking relief from muscle aches, joint pain, arthritis, headaches, and fever continue to rely on these medications, making the OTC analgesics market a vital and dynamic sector in the global healthcare industry.
|
Market Scope |
|
|
Report Coverage |
Details |
|
Page number |
171 |
|
Base year |
2023 |
|
Historic period |
2018-2022 |
|
Forecast period |
2024-2028 |
|
Growth momentum & CAGR |
Accelerate at a CAGR of 4.98% |
|
Market growth 2024-2028 |
USD 7.2 billion |
|
Market structure |
Fragmented |
|
YoY growth 2023-2024(%) |
4.65 |
|
Key countries |
US, Germany, China, UK, and Japan |
|
Competitive landscape |
Leading Companies, Market Positioning of Companies, Competitive Strategies, and Industry Risks |
What are the Key Data Covered in this Over-The-Counter (OTC) Analgesics Market Research and Growth Report?
- CAGR of the Over-The-Counter (OTC) Analgesics industry during the forecast period
- Detailed information on factors that will drive the growth and forecasting between 2024 and 2028
- Precise estimation of the size of the market and its contribution of the industry in focus to the parent market
- Accurate predictions about upcoming growth and trends and changes in consumer behaviour
- Growth of the market across North America, Europe, Asia, and Rest of World (ROW)
- Thorough analysis of the market's competitive landscape and detailed information about companies
- Comprehensive analysis of factors that will challenge the over-the-counter (OTC) analgesics market growth of industry companies
We can help! Our analysts can customize this over-the-counter (OTC) analgesics market research report to meet your requirements.
 RIA -
RIA - 
