Overactive Bladder Therapeutics Market Analysis, Size, and Forecast 2025-2029: North America (US and Canada), Europe (France, Germany, and UK), APAC (China, India, Japan, and South Korea), South America (Brazil), and Rest of World (ROW)

Overactive Bladder Therapeutics Market Analysis, Size, and Forecast 2025-2029:
North America (US and Canada), Europe (France, Germany, and UK), APAC (China, India, Japan, and South Korea), South America (Brazil), and Rest of World (ROW)

Published: May 2025 221 Pages SKU: IRTNTR43955

Market Overview at a Glance

$901.9 Mn
Market Opportunity
4%
CAGR
3.8
YoY growth 2024-2025(%)

Overactive Bladder Therapeutics Market Size 2025-2029

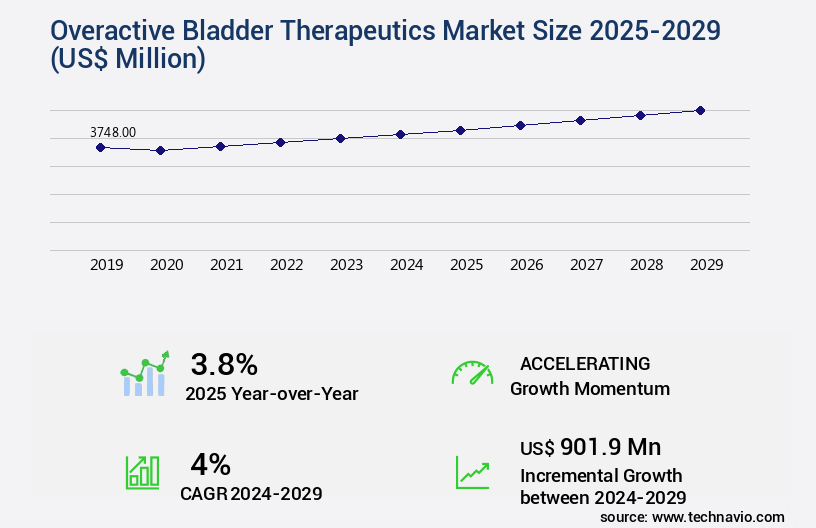
The overactive bladder therapeutics market size is valued to increase USD 901.9 million, at a CAGR of 4% from 2024 to 2029. An aging population will drive the overactive bladder therapeutics market.

Major Market Trends & Insights

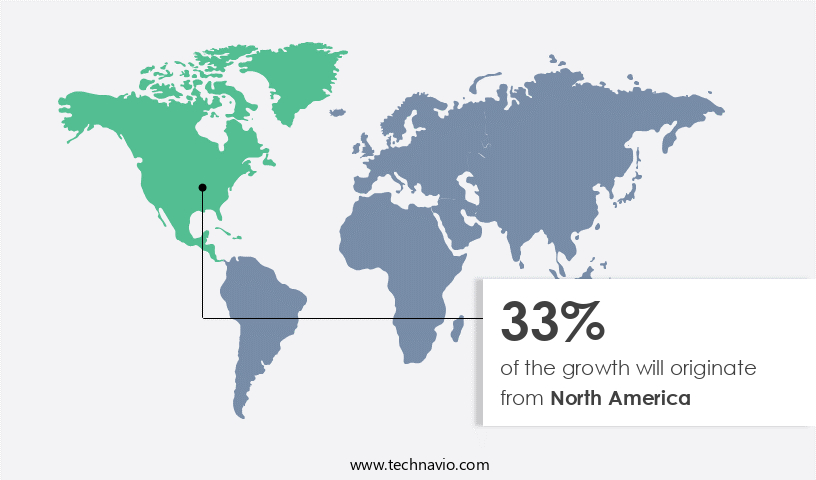
  • North America dominated the market and accounted for a 33% growth during the forecast period.
  • By Product - Anticholinergics segment was valued at USD 2102.20 million in 2023
  • By Distribution Channel - Retail pharmacies segment accounted for the largest market revenue share in 2023

Market Size & Forecast

  • Market Opportunities: USD 36.04 million
  • Market Future Opportunities: USD 901.90 million 
  • CAGR : 4%
  • North America: Largest market in 2023

Market Summary

  • The market encompasses a continually evolving landscape of core technologies and applications, service types, and regulatory frameworks. With an increasing focus on minimally invasive treatments and the adoption of advanced technologies, this market is poised for significant growth in the upcoming years. For instance, the use of botulinum toxin type A (Botox) injections has gained substantial traction, accounting for over 70% of the market share.
  • However, regulatory hurdles and the rising prevalence of aging populations present challenges that market players must navigate. As we look forward, the forecast period will bring new opportunities in the form of innovative product developments and expanding applications, particularly in regions such as North America and Europe.

What will be the Size of the Overactive Bladder Therapeutics Market during the forecast period?

Overactive Bladder Therapeutics Market Size

Get Key Insights on Market Forecast (PDF) Request Free Sample

How is the Overactive Bladder Therapeutics Market Segmented and what are the key trends of market segmentation?

The overactive bladder therapeutics industry research report provides comprehensive data (region-wise segment analysis), with forecasts and estimates in "USD million" for the period 2025-2029, as well as historical data from 2019-2023 for the following segments.

  • Product
    • Anticholinergics
    • Beta-3 adrenergic agonists
    • Others
  • Distribution Channel
    • Retail pharmacies
    • Hospital pharmacies
    • Online
  • Disease Type
    • Idiopathic overactive bladder
    • Neurogenic overactive bladder
  • Geography
    • North America
      • US
      • Canada
    • Europe
      • France
      • Germany
      • UK
    • APAC
      • China
      • India
      • Japan
      • South Korea
    • South America
      • Brazil
    • Rest of World (ROW)

By Product Insights

The anticholinergics segment is estimated to witness significant growth during the forecast period.

Overactive bladder (OAB) is a common condition characterized by symptoms such as frequency, urgency, nocturia, and incontinence. Urodynamic studies and behavioral therapies, including bladder training exercises, dietary modifications, and fluid intake management, are initial treatment approaches. However, pharmacological interventions remain a significant market, with anticholinergic medications, such as oxybutynin, tolterodine, and solifenacin, representing the most commonly prescribed class. These agents inhibit muscarinic receptors in the detrusor muscle, improving bladder storage capacity and reducing involuntary contractions. Oxybutynin, available in various formulations, is a first-line therapy for OAB. Tolterodine, with its improved tolerability profile, and solifenacin, offering greater bladder selectivity and longer duration of action, are also popular choices.

Other therapeutic options include beta-3 agonists, nerve stimulation therapy, botulinum toxin injections, and muscarinic receptor antagonists. These treatments aim to address bladder dysfunction, detrusor overactivity, and overactive bladder symptoms, such as urge incontinence and stress incontinence. The market for OAB therapeutics is continually evolving, with ongoing research and development efforts. For instance, mirabegron, a beta-3 agonist, has shown significant symptom improvement for patients with OAB and has gained FDA approval. Sacral neuromodulation, a nerve stimulation therapy, has demonstrated long-term efficacy for the treatment of urinary incontinence, including mixed incontinence. Furthermore, patient reported outcomes have gained increasing importance in the evaluation of treatment efficacy, emphasizing the need for continuous improvement in therapeutic options.

Overactive Bladder Therapeutics Market Size

Request Free Sample

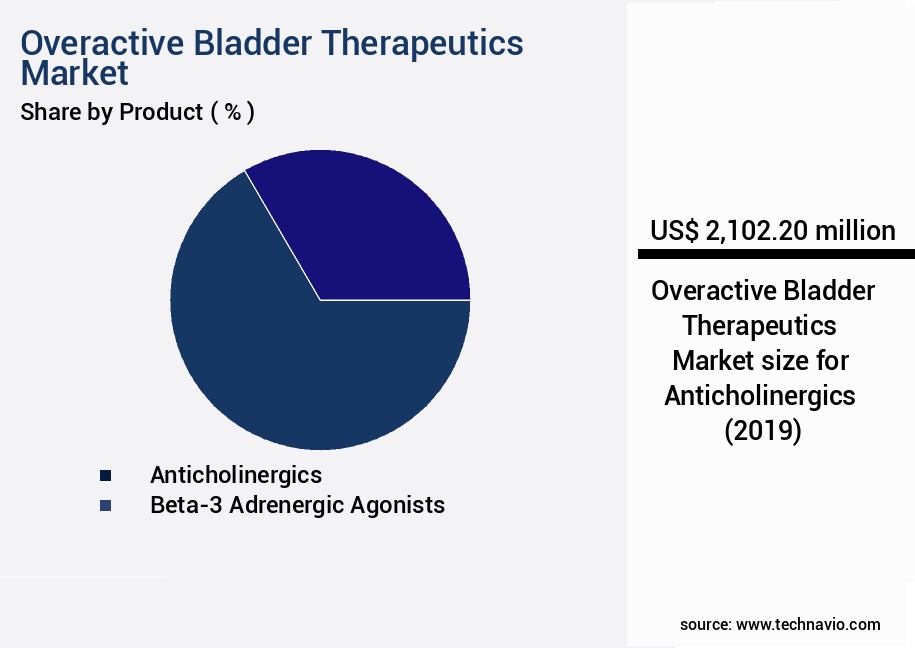
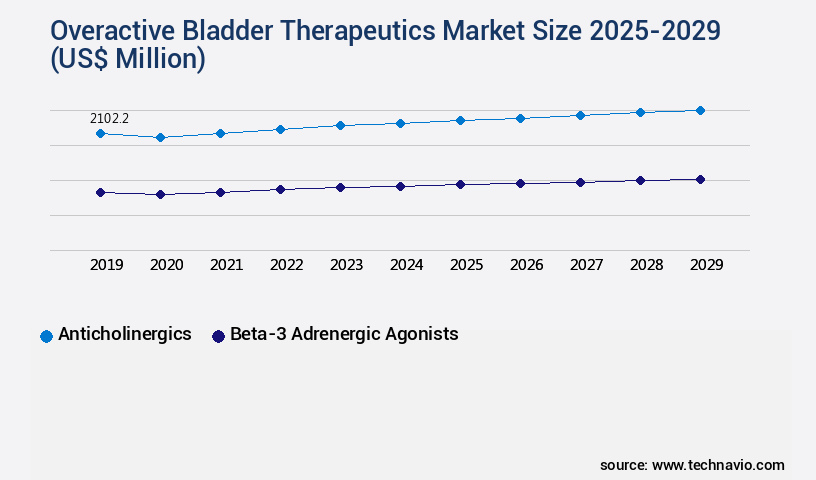
The Anticholinergics segment was valued at USD 2,102.20 million in 2019 and showed a gradual increase during the forecast period.

According to recent studies, the market for OAB therapeutics is experiencing significant growth, with an estimated 12.5% of the global population suffering from the condition. Furthermore, the market is projected to expand by 15% within the next five years, driven by increasing awareness, improved diagnostic tools, and the development of novel therapeutic approaches. Despite these promising developments, the market faces challenges, including the need for long-term adherence to treatment regimens, potential side effects, and the high cost of some therapies. In summary, the market for overactive bladder therapeutics is a dynamic and evolving landscape, with a growing number of treatment options available to address the needs of the millions of individuals affected by this condition.

Anticholinergics, beta-3 agonists, nerve stimulation therapies, and other interventions continue to play a central role in the management of OAB, with ongoing research and development efforts driving innovation and expansion within the market.

Overactive Bladder Therapeutics Market Size

Request Free Sample

Regional Analysis

North America is estimated to contribute 33% to the growth of the global market during the forecast period. Technavio's analysts have elaborately explained the regional trends and drivers that shape the market during the forecast period.

Overactive Bladder Therapeutics Market Share by Geography

See How Overactive Bladder Therapeutics Market Demand is Rising in North America Request Free Sample

North America's market maintains a leading position globally, fueled by demographic trends, healthcare investment, pharmaceutical innovation, public awareness, and a robust distribution network. The United States, with a USD 4.9 trillion healthcare investment in 2023, allocates significant resources to advanced diagnostics and diverse treatment options for chronic conditions like OAB, ensuring early detection and personalized care. Approximately 35 million Americans experience OAB symptoms, and this number is projected to grow by 45% by 2030.

In 2022, the market size was estimated at USD 5.5 billion, with an anticipated increase due to the pipeline of novel treatments and the expanding patient population. Additionally, the growing prevalence of obesity and an aging population further bolsters market growth.

Market Dynamics

Our researchers analyzed the data with 2024 as the base year, along with the key drivers, trends, and challenges. A holistic analysis of drivers will help companies refine their marketing strategies to gain a competitive advantage.

The overactive bladder (OAB) therapeutics market encompasses a range of treatments aimed at managing symptoms such as urinary frequency, urgency, and incontinence. One significant area of research focuses on muscarinic receptor subtype selectivity and the efficacy and safety of beta-3 agonists. These medications offer potential advantages over traditional anticholinergic medications, which can have detrimental effects on cognition. Sacral neuromodulation (SNM) is another promising therapy, with ongoing efforts to optimize parameters for improved outcomes. Botulinum toxin injections, a common treatment, require careful injection technique and dosage consideration. Pelvic floor muscle training protocols and behavioral therapy for urge incontinence are also effective, non-pharmacological options.

Fluid intake plays a role in bladder symptoms, with some studies suggesting a correlation between increased intake and severity of symptoms. Assessing detrusor overactivity severity and the correlation between urodynamic parameters and symptoms is crucial for effective treatment planning. Combination therapies, including the use of anticholinergics and botulinum toxin injections, have shown promise in managing OAB symptoms. Comparing the effectiveness of different surgical treatments, such as augmentation cystoplasty and artificial urinary sphincter implantation, is an ongoing area of research. Long-term outcomes of botulinum toxin injections and patient-reported outcomes, including quality of life, are essential considerations in treatment decision-making. Cost-effectiveness analyses of various treatments can help healthcare providers make informed decisions.

Adherence to medication regimens and lifestyle changes, such as bladder training and diet modifications, can significantly impact symptom management. Management of neurogenic bladder and treatment for interstitial cystitis are specific areas of focus within the OAB therapeutics market. Adverse effects of medications, such as dry mouth and constipation, must be carefully weighed against their benefits. Ongoing research in these areas aims to improve treatment efficacy and safety. According to a recent study, botulinum toxin injections resulted in a 53% reduction in incontinence episodes per week compared to a 28% reduction with placebo (P<0.001). This comparison highlights the significant impact of botulinum toxin injections on managing OAB symptoms.

Overactive Bladder Therapeutics Market Size

What are the key market drivers leading to the rise in the adoption of Overactive Bladder Therapeutics Industry?

  • The aging population serves as the primary catalyst for market growth, as an increasing number of older individuals require products and services that cater to their unique needs. 
  • The market experiences continuous growth due to the increasing prevalence of this condition among the aging population. With approximately 1.2 billion individuals aged 60 and above in 2024, representing around 12% of the global population, this demographic is projected to double by 2050, reaching 2.1 billion and accounting for 26% of the global population. The number of individuals aged 80 and above is anticipated to triple, reaching 426 million by the same year.
  • This demographic shift highlights the expanding demand for healthcare interventions addressing age-related conditions, including those focused on bladder dysfunction. The ongoing evolution of this market is marked by advancements in technology and research, providing new treatment options for those affected by overactive bladder.

What are the market trends shaping the Overactive Bladder Therapeutics Industry?

  • The adoption of minimally invasive treatments is becoming increasingly mandated in the healthcare industry. This trend signifies a shift towards less invasive procedures, offering numerous benefits to patients.
  • The market is witnessing a notable shift towards minimally invasive treatments. These innovative therapies, which encompass botulinum toxin injections and neuromodulation techniques, are gaining popularity due to their clinical efficacy and favorable safety profiles. In contrast to traditional oral medications that may cause systemic side effects or lose effectiveness over time, minimally invasive options provide targeted relief with fewer adverse outcomes. This makes them an attractive alternative for patients with refractory symptoms or those intolerant to pharmacological therapies. Botulinum toxin, specifically onabotulinumtoxinA, is administered directly into the bladder muscle to inhibit nerve activity and reduce involuntary contractions.
  • This approach has yielded substantial improvements in urgency, frequency, and incontinence episodes for patients who have not responded to anticholinergics or beta-3 adrenergic agonists. The adoption of these minimally invasive treatments is on the rise, with a growing number of patients seeking targeted relief from overactive bladder symptoms. These therapies represent a significant advancement in the field of urology, offering patients a more effective and safer treatment option.

What challenges does the Overactive Bladder Therapeutics Industry face during its growth?

  • The growth of the industry is significantly impeded by regulatory hurdles, which present a formidable challenge that must be addressed by industry professionals. 
  • Regulatory hurdles pose a significant challenge in the global overactive bladder (OAB) therapeutics market, impacting both pharmaceutical and medical device sectors. Strict regulatory bodies, including the U.S. Food and Drug Administration (FDA) and the European Medicines Agency (EMA), enforce stringent clinical trial requirements to ensure the safety, efficacy, and tolerability of OAB treatments. Phase III trials necessitate statistically significant improvements in symptoms like urgency, frequency, and incontinence episodes compared to placebo or existing therapies.
  • These trials are resource-intensive, demanding considerable financial investment and extended timelines, frequently lasting several years. Post-marketing surveillance obligations also apply following initial approval. These regulatory challenges contribute to the complexity and dynamism of the OAB therapeutics market, necessitating continuous adaptation and innovation from industry players.

Exclusive Customer Landscape

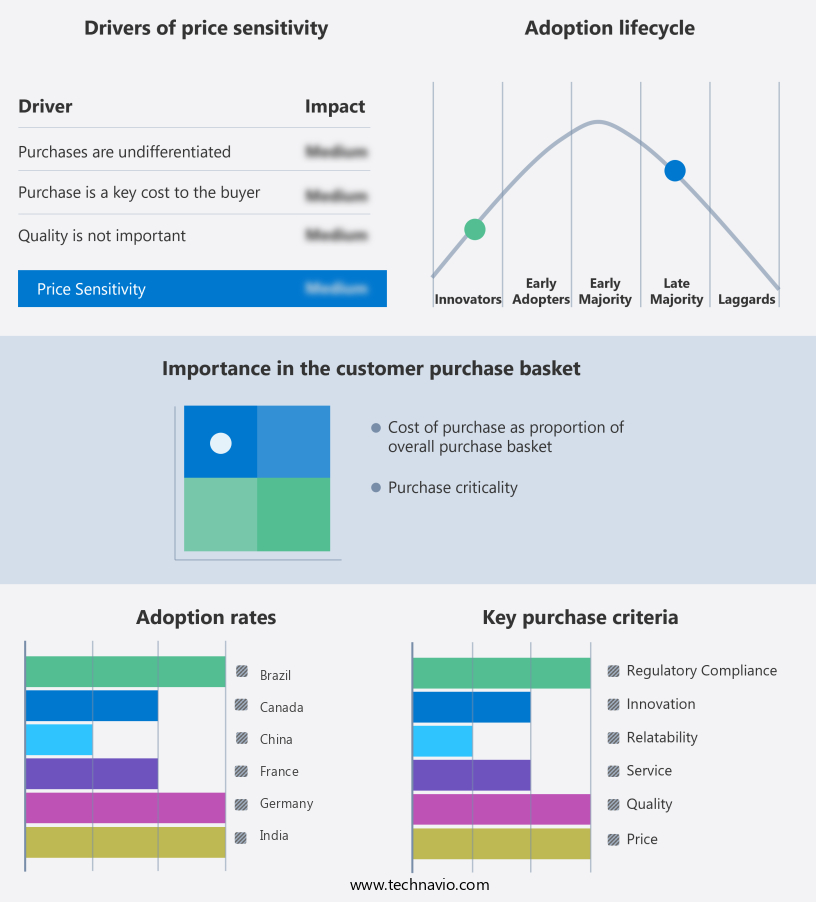
The overactive bladder therapeutics market forecasting report includes the adoption lifecycle of the market, covering from the innovator's stage to the laggard's stage. It focuses on adoption rates in different regions based on penetration. Furthermore, the overactive bladder therapeutics market report also includes key purchase criteria and drivers of price sensitivity to help companies evaluate and develop their market growth analysis strategies.

Overactive Bladder Therapeutics Market Share by Geography

 Customer Landscape of Overactive Bladder Therapeutics Industry

Competitive Landscape & Market Insights

Companies are implementing various strategies, such as strategic alliances, overactive bladder therapeutics market forecast, partnerships, mergers and acquisitions, geographical expansion, and product/service launches, to enhance their presence in the industry.

AbbVie Inc. - The company specializes in providing therapeutic solutions for overactive bladder symptoms in adults.

The industry research and growth report includes detailed analyses of the competitive landscape of the market and information about key companies, including:

  • AbbVie Inc.
  • Apotex Inc.
  • Astellas Pharma Inc.
  • Aurobindo Pharma Ltd.
  • Axonics Inc.
  • Dr Reddys Laboratories Ltd.
  • Ferring BV
  • Imbrium Therapeutics L.P
  • Johnson and Johnson Services Inc.
  • Lipella Pharmaceuticals Inc.
  • Lupin Ltd.
  • Medtronic Plc
  • Medytox
  • Merck and Co. Inc.
  • Ono Pharmaceutical Co. Ltd.
  • Pfizer Inc.
  • Sumitomo Pharma Co. Ltd.
  • Sun Pharmaceutical Industries Ltd.
  • Teva Pharmaceutical Industries Ltd.
  • Viatris Inc.

Qualitative and quantitative analysis of companies has been conducted to help clients understand the wider business environment as well as the strengths and weaknesses of key industry players. Data is qualitatively analyzed to categorize companies as pure play, category-focused, industry-focused, and diversified; it is quantitatively analyzed to categorize companies as dominant, leading, strong, tentative, and weak.

Recent Development and News in Overactive Bladder Therapeutics Market

  • In January 2024, AstraZeneca and Neurim Pharmaceuticals announced the U.S. Food and Drug Administration (FDA) approval of Saphris (asenapine) tablets for the treatment of symptoms of overactive bladder (OAB) in adults. This marked the first FDA approval of an atypical antipsychotic for OAB, expanding the therapeutic options for patients (AstraZeneca press release, 2024).
  • In March 2024, Allergan plc and Saturna Biomedical, Inc. entered into a strategic collaboration to develop and commercialize Saturna's investigational neurostimulation technology for the treatment of OAB. The collaboration aimed to leverage Allergan's expertise in urology and neurosciences to bring the technology to market (Allergan press release, 2024).
  • In April 2025, Merck KGaA, Darmstadt, Germany, and The Medicines Company completed their merger, creating a new entity called Merck KGaA, Darmstadt, Germany, Healthcare. The combined company's portfolio included several OAB treatments, positioning it as a significant player in the market (Merck KGaA press release, 2025).
  • In May 2025, the European Commission granted marketing authorization for Myrbetriq XR (mirabegron) extended-release tablets for the treatment of OAB with symptoms of urge urinary incontinence, urgency, and frequency in adults. The approval marked a significant milestone for Astellas Pharma Europe B.V., which markets Myrbetriq XR in Europe (Astellas Pharma Europe press release, 2025).

Dive into Technavio's robust research methodology, blending expert interviews, extensive data synthesis, and validated models for unparalleled Overactive Bladder Therapeutics Market insights. See full methodology.

Market Scope

Report Coverage

Details

Page number

221

Base year

2024

Historic period

2019-2023

Forecast period

2025-2029

Growth momentum & CAGR

Accelerate at a CAGR of 4%

Market growth 2025-2029

USD 901.9 million

Market structure

Fragmented

YoY growth 2024-2025(%)

3.8

Key countries

US, China, Germany, India, UK, Canada, France, Japan, Brazil, and South Korea

Competitive landscape

Leading Companies, Market Positioning of Companies, Competitive Strategies, and Industry Risks

Request Free Sample

Research Analyst Overview

  • In the realm of therapeutics, the overactive bladder (OAB) market continues to evolve, driven by innovative treatments and growing patient demand. Urodynamic studies, a diagnostic tool, plays a crucial role in identifying bladder dysfunction, including detrusor overactivity and detrusor underactivity. Behavioral therapies, such as bladder training exercises and fluid intake management, remain foundational interventions. Beta-3 agonists, a newer class of medications, have gained traction due to their ability to improve bladder capacity measurement and voiding efficiency. Anticholinergic medications, long-standing mainstays, continue to be utilized for symptom improvement, targeting urinary frequency, urgency, and nocturia. Nerve stimulation therapies, including sacral neuromodulation and mirrorbegron mechanism, have emerged as effective treatments for urge incontinence and mixed incontinence.
  • Botulinum toxin injections and muscarinic receptor antagonists are additional interventions for managing OAB symptoms. The market landscape is marked by ongoing research and development, with a focus on patient reported outcomes and treatment efficacy. Dietary modifications and bladder capacity measurement techniques are also gaining attention as potential adjunctive therapies. The treatment landscape for urinary incontinence, a common manifestation of OAB, is diverse, encompassing various interventions for stress incontinence, urge incontinence, and neurogenic bladder. The goal is to address the severity of symptoms and improve overall quality of life for those affected. In the realm of OAB therapeutics, the dynamic interplay between established and emerging treatments underscores the importance of ongoing research and innovation.
  • The market continues to evolve, offering new possibilities for those seeking relief from bladder dysfunction.

What are the Key Data Covered in this Overactive Bladder Therapeutics Market Research and Growth Report?

  • What is the expected growth of the Overactive Bladder Therapeutics Market between 2025 and 2029?

    • USD 901.9 million, at a CAGR of 4%

  • What segmentation does the market report cover?

    • The report segmented by Product (Anticholinergics, Beta-3 adrenergic agonists, and Others), Distribution Channel (Retail pharmacies, Hospital pharmacies, and Online), Disease Type (Idiopathic overactive bladder and Neurogenic overactive bladder), and Geography (North America, Europe, Asia, and Rest of World (ROW))

  • Which regions are analyzed in the report?

    • North America, Europe, Asia, and Rest of World (ROW)

  • What are the key growth drivers and market challenges?

    • Aging population, Regulatory hurdles

  • Who are the major players in the Overactive Bladder Therapeutics Market?

    • Key Companies AbbVie Inc., Apotex Inc., Astellas Pharma Inc., Aurobindo Pharma Ltd., Axonics Inc., Dr Reddys Laboratories Ltd., Ferring BV, Imbrium Therapeutics L.P, Johnson and Johnson Services Inc., Lipella Pharmaceuticals Inc., Lupin Ltd., Medtronic Plc, Medytox, Merck and Co. Inc., Ono Pharmaceutical Co. Ltd., Pfizer Inc., Sumitomo Pharma Co. Ltd., Sun Pharmaceutical Industries Ltd., Teva Pharmaceutical Industries Ltd., and Viatris Inc.

Market Research Insights

  • The market encompasses a diverse range of treatments, including device-based therapies and extended-release formulations. According to industry estimates, the market for extended-release formulations is projected to grow at a steady rate, reaching USD 3.5 billion by 2025. In contrast, the market for device-based therapies, such as electrical stimulation and drug delivery systems, is anticipated to expand more rapidly, reaching USD 4.2 billion by the same year. Effective treatment adherence is a critical factor in achieving positive long-term outcomes for overactive bladder patients.
  • For instance, sensory thresholds and patient satisfaction are significantly improved with minimally invasive procedures like magnetic stimulation and cognitive behavioral therapy. However, non-invasive treatments, such as biofeedback therapy and abdominal pressure monitoring, also play a crucial role in enhancing functional bladder capacity, bladder compliance, and detrusor pressure. Ultimately, a combination of therapies tailored to individual patient needs may yield the best results in managing overactive bladder symptoms.

We can help! Our analysts can customize this overactive bladder therapeutics market research report to meet your requirements.

Get in touch

1 Executive Summary

  • 1.1 Market overview
    • Executive Summary - Chart on Market Overview
    • Executive Summary - Data Table on Market Overview
    • Executive Summary - Chart on Global Market Characteristics
    • Executive Summary - Chart on Market by Geography
    • Executive Summary - Chart on Market Segmentation by Product
    • Executive Summary - Chart on Market Segmentation by Distribution Channel
    • Executive Summary - Chart on Market Segmentation by Disease Type
    • Executive Summary - Chart on Incremental Growth
    • Executive Summary - Data Table on Incremental Growth
    • Executive Summary - Chart on Company Market Positioning

2 Technavio Analysis

  • 2.1 Analysis of price sensitivity, lifecycle, customer purchase basket, adoption rates, and purchase criteria
    • Analysis of price sensitivity, lifecycle, customer purchase basket, adoption rates, and purchase criteria
  • 2.2 Criticality of inputs and Factors of differentiation
    • Overview on criticality of inputs and factors of differentiation
  • 2.3 Factors of disruption
    • Overview on factors of disruption
  • 2.4 Impact of drivers and challenges
    • Impact of drivers and challenges in 2024 and 2029

3 Market Landscape

  • 3.1 Market ecosystem
    • Parent Market
    • Data Table on - Parent Market
  • 3.2 Market characteristics
    • Market characteristics analysis
  • 3.3 Value chain analysis
    • Value chain analysis

4 Market Sizing

  • 4.1 Market definition
    • Offerings of companies included in the market definition
  • 4.2 Market segment analysis
    • Market segments
  • 4.3 Market size 2024
    • 4.4 Market outlook: Forecast for 2024-2029
      • Chart on Global - Market size and forecast 2024-2029 ($ million)
      • Data Table on Global - Market size and forecast 2024-2029 ($ million)
      • Chart on Global Market: Year-over-year growth 2024-2029 (%)
      • Data Table on Global Market: Year-over-year growth 2024-2029 (%)

    5 Historic Market Size

    • 5.1 Global Overactive Bladder Therapeutics Market 2019 - 2023
      • Historic Market Size - Data Table on Global Overactive Bladder Therapeutics Market 2019 - 2023 ($ million)
    • 5.2 Product segment analysis 2019 - 2023
      • Historic Market Size - Product Segment 2019 - 2023 ($ million)
    • 5.3 Distribution Channel segment analysis 2019 - 2023
      • Historic Market Size - Distribution Channel Segment 2019 - 2023 ($ million)
    • 5.4 Disease Type segment analysis 2019 - 2023
      • Historic Market Size - Disease Type Segment 2019 - 2023 ($ million)
    • 5.5 Geography segment analysis 2019 - 2023
      • Historic Market Size - Geography Segment 2019 - 2023 ($ million)
    • 5.6 Country segment analysis 2019 - 2023
      • Historic Market Size - Country Segment 2019 - 2023 ($ million)

    6 Qualitative Analysis

    • 6.1 Impact Analysis of U.S. Tariffs on Global Overactive Bladder Therapeutics Market

      7 Five Forces Analysis

      • 7.1 Five forces summary
        • Five forces analysis - Comparison between 2024 and 2029
      • 7.2 Bargaining power of buyers
        • Bargaining power of buyers - Impact of key factors 2024 and 2029
      • 7.3 Bargaining power of suppliers
        • Bargaining power of suppliers - Impact of key factors in 2024 and 2029
      • 7.4 Threat of new entrants
        • Threat of new entrants - Impact of key factors in 2024 and 2029
      • 7.5 Threat of substitutes
        • Threat of substitutes - Impact of key factors in 2024 and 2029
      • 7.6 Threat of rivalry
        • Threat of rivalry - Impact of key factors in 2024 and 2029
      • 7.7 Market condition
        • Chart on Market condition - Five forces 2024 and 2029

      8 Market Segmentation by Product

      • 8.1 Market segments
        • Chart on Product - Market share 2024-2029 (%)
        • Data Table on Product - Market share 2024-2029 (%)
      • 8.2 Comparison by Product
        • Chart on Comparison by Product
        • Data Table on Comparison by Product
      • 8.3 Anticholinergics - Market size and forecast 2024-2029
        • Chart on Anticholinergics - Market size and forecast 2024-2029 ($ million)
        • Data Table on Anticholinergics - Market size and forecast 2024-2029 ($ million)
        • Chart on Anticholinergics - Year-over-year growth 2024-2029 (%)
        • Data Table on Anticholinergics - Year-over-year growth 2024-2029 (%)
      • 8.4 Beta-3 adrenergic agonists - Market size and forecast 2024-2029
        • Chart on Beta-3 adrenergic agonists - Market size and forecast 2024-2029 ($ million)
        • Data Table on Beta-3 adrenergic agonists - Market size and forecast 2024-2029 ($ million)
        • Chart on Beta-3 adrenergic agonists - Year-over-year growth 2024-2029 (%)
        • Data Table on Beta-3 adrenergic agonists - Year-over-year growth 2024-2029 (%)
      • 8.5 Others - Market size and forecast 2024-2029
        • Chart on Others - Market size and forecast 2024-2029 ($ million)
        • Data Table on Others - Market size and forecast 2024-2029 ($ million)
        • Chart on Others - Year-over-year growth 2024-2029 (%)
        • Data Table on Others - Year-over-year growth 2024-2029 (%)
      • 8.6 Market opportunity by Product
        • Market opportunity by Product ($ million)
        • Data Table on Market opportunity by Product ($ million)

      9 Market Segmentation by Distribution Channel

      • 9.1 Market segments
        • Chart on Distribution Channel - Market share 2024-2029 (%)
        • Data Table on Distribution Channel - Market share 2024-2029 (%)
      • 9.2 Comparison by Distribution Channel
        • Chart on Comparison by Distribution Channel
        • Data Table on Comparison by Distribution Channel
      • 9.3 Retail pharmacies - Market size and forecast 2024-2029
        • Chart on Retail pharmacies - Market size and forecast 2024-2029 ($ million)
        • Data Table on Retail pharmacies - Market size and forecast 2024-2029 ($ million)
        • Chart on Retail pharmacies - Year-over-year growth 2024-2029 (%)
        • Data Table on Retail pharmacies - Year-over-year growth 2024-2029 (%)
      • 9.4 Hospital pharmacies - Market size and forecast 2024-2029
        • Chart on Hospital pharmacies - Market size and forecast 2024-2029 ($ million)
        • Data Table on Hospital pharmacies - Market size and forecast 2024-2029 ($ million)
        • Chart on Hospital pharmacies - Year-over-year growth 2024-2029 (%)
        • Data Table on Hospital pharmacies - Year-over-year growth 2024-2029 (%)
      • 9.5 Online - Market size and forecast 2024-2029
        • Chart on Online - Market size and forecast 2024-2029 ($ million)
        • Data Table on Online - Market size and forecast 2024-2029 ($ million)
        • Chart on Online - Year-over-year growth 2024-2029 (%)
        • Data Table on Online - Year-over-year growth 2024-2029 (%)
      • 9.6 Market opportunity by Distribution Channel
        • Market opportunity by Distribution Channel ($ million)
        • Data Table on Market opportunity by Distribution Channel ($ million)

      10 Market Segmentation by Disease Type

      • 10.1 Market segments
        • Chart on Disease Type - Market share 2024-2029 (%)
        • Data Table on Disease Type - Market share 2024-2029 (%)
      • 10.2 Comparison by Disease Type
        • Chart on Comparison by Disease Type
        • Data Table on Comparison by Disease Type
      • 10.3 Idiopathic overactive bladder - Market size and forecast 2024-2029
        • Chart on Idiopathic overactive bladder - Market size and forecast 2024-2029 ($ million)
        • Data Table on Idiopathic overactive bladder - Market size and forecast 2024-2029 ($ million)
        • Chart on Idiopathic overactive bladder - Year-over-year growth 2024-2029 (%)
        • Data Table on Idiopathic overactive bladder - Year-over-year growth 2024-2029 (%)
      • 10.4 Neurogenic overactive bladder - Market size and forecast 2024-2029
        • Chart on Neurogenic overactive bladder - Market size and forecast 2024-2029 ($ million)
        • Data Table on Neurogenic overactive bladder - Market size and forecast 2024-2029 ($ million)
        • Chart on Neurogenic overactive bladder - Year-over-year growth 2024-2029 (%)
        • Data Table on Neurogenic overactive bladder - Year-over-year growth 2024-2029 (%)
      • 10.5 Market opportunity by Disease Type
        • Market opportunity by Disease Type ($ million)
        • Data Table on Market opportunity by Disease Type ($ million)

      11 Customer Landscape

      • 11.1 Customer landscape overview
        • Analysis of price sensitivity, lifecycle, customer purchase basket, adoption rates, and purchase criteria

      12 Geographic Landscape

      • 12.1 Geographic segmentation
        • Chart on Market share by geography 2024-2029 (%)
        • Data Table on Market share by geography 2024-2029 (%)
      • 12.2 Geographic comparison
        • Chart on Geographic comparison
        • Data Table on Geographic comparison
      • 12.3 North America - Market size and forecast 2024-2029
        • Chart on North America - Market size and forecast 2024-2029 ($ million)
        • Data Table on North America - Market size and forecast 2024-2029 ($ million)
        • Chart on North America - Year-over-year growth 2024-2029 (%)
        • Data Table on North America - Year-over-year growth 2024-2029 (%)
      • 12.4 Europe - Market size and forecast 2024-2029
        • Chart on Europe - Market size and forecast 2024-2029 ($ million)
        • Data Table on Europe - Market size and forecast 2024-2029 ($ million)
        • Chart on Europe - Year-over-year growth 2024-2029 (%)
        • Data Table on Europe - Year-over-year growth 2024-2029 (%)
      • 12.5 Asia - Market size and forecast 2024-2029
        • Chart on Asia - Market size and forecast 2024-2029 ($ million)
        • Data Table on Asia - Market size and forecast 2024-2029 ($ million)
        • Chart on Asia - Year-over-year growth 2024-2029 (%)
        • Data Table on Asia - Year-over-year growth 2024-2029 (%)
      • 12.6 Rest of World (ROW) - Market size and forecast 2024-2029
        • Chart on Rest of World (ROW) - Market size and forecast 2024-2029 ($ million)
        • Data Table on Rest of World (ROW) - Market size and forecast 2024-2029 ($ million)
        • Chart on Rest of World (ROW) - Year-over-year growth 2024-2029 (%)
        • Data Table on Rest of World (ROW) - Year-over-year growth 2024-2029 (%)
      • 12.7 US - Market size and forecast 2024-2029
        • Chart on US - Market size and forecast 2024-2029 ($ million)
        • Data Table on US - Market size and forecast 2024-2029 ($ million)
        • Chart on US - Year-over-year growth 2024-2029 (%)
        • Data Table on US - Year-over-year growth 2024-2029 (%)
      • 12.8 China - Market size and forecast 2024-2029
        • Chart on China - Market size and forecast 2024-2029 ($ million)
        • Data Table on China - Market size and forecast 2024-2029 ($ million)
        • Chart on China - Year-over-year growth 2024-2029 (%)
        • Data Table on China - Year-over-year growth 2024-2029 (%)
      • 12.9 Germany - Market size and forecast 2024-2029
        • Chart on Germany - Market size and forecast 2024-2029 ($ million)
        • Data Table on Germany - Market size and forecast 2024-2029 ($ million)
        • Chart on Germany - Year-over-year growth 2024-2029 (%)
        • Data Table on Germany - Year-over-year growth 2024-2029 (%)
      • 12.10 India - Market size and forecast 2024-2029
        • Chart on India - Market size and forecast 2024-2029 ($ million)
        • Data Table on India - Market size and forecast 2024-2029 ($ million)
        • Chart on India - Year-over-year growth 2024-2029 (%)
        • Data Table on India - Year-over-year growth 2024-2029 (%)
      • 12.11 UK - Market size and forecast 2024-2029
        • Chart on UK - Market size and forecast 2024-2029 ($ million)
        • Data Table on UK - Market size and forecast 2024-2029 ($ million)
        • Chart on UK - Year-over-year growth 2024-2029 (%)
        • Data Table on UK - Year-over-year growth 2024-2029 (%)
      • 12.12 Canada - Market size and forecast 2024-2029
        • Chart on Canada - Market size and forecast 2024-2029 ($ million)
        • Data Table on Canada - Market size and forecast 2024-2029 ($ million)
        • Chart on Canada - Year-over-year growth 2024-2029 (%)
        • Data Table on Canada - Year-over-year growth 2024-2029 (%)
      • 12.13 France - Market size and forecast 2024-2029
        • Chart on France - Market size and forecast 2024-2029 ($ million)
        • Data Table on France - Market size and forecast 2024-2029 ($ million)
        • Chart on France - Year-over-year growth 2024-2029 (%)
        • Data Table on France - Year-over-year growth 2024-2029 (%)
      • 12.14 Japan - Market size and forecast 2024-2029
        • Chart on Japan - Market size and forecast 2024-2029 ($ million)
        • Data Table on Japan - Market size and forecast 2024-2029 ($ million)
        • Chart on Japan - Year-over-year growth 2024-2029 (%)
        • Data Table on Japan - Year-over-year growth 2024-2029 (%)
      • 12.15 Brazil - Market size and forecast 2024-2029
        • Chart on Brazil - Market size and forecast 2024-2029 ($ million)
        • Data Table on Brazil - Market size and forecast 2024-2029 ($ million)
        • Chart on Brazil - Year-over-year growth 2024-2029 (%)
        • Data Table on Brazil - Year-over-year growth 2024-2029 (%)
      • 12.16 South Korea - Market size and forecast 2024-2029
        • Chart on South Korea - Market size and forecast 2024-2029 ($ million)
        • Data Table on South Korea - Market size and forecast 2024-2029 ($ million)
        • Chart on South Korea - Year-over-year growth 2024-2029 (%)
        • Data Table on South Korea - Year-over-year growth 2024-2029 (%)
      • 12.17 Market opportunity by geography
        • Market opportunity by geography ($ million)
        • Data Tables on Market opportunity by geography ($ million)

      13 Drivers, Challenges, and Opportunity/Restraints

      • 13.1 Market drivers
        • 13.2 Market challenges
          • 13.3 Impact of drivers and challenges
            • Impact of drivers and challenges in 2024 and 2029
          • 13.4 Market opportunities/restraints

            14 Competitive Landscape

            • 14.1 Overview
              • 14.2 Competitive Landscape
                • Overview on criticality of inputs and factors of differentiation
              • 14.3 Landscape disruption
                • Overview on factors of disruption
              • 14.4 Industry risks
                • Impact of key risks on business

              15 Competitive Analysis

              • 15.1 Companies profiled
                • Companies covered
              • 15.2 Company ranking index
                • Company ranking index
              • 15.3 Market positioning of companies
                • Matrix on companies position and classification
              • 15.4 AbbVie Inc.
                • AbbVie Inc. - Overview
                • AbbVie Inc. - Product / Service
                • AbbVie Inc. - Key news
                • AbbVie Inc. - Key offerings
                • SWOT
              • 15.5 Apotex Inc.
                • Apotex Inc. - Overview
                • Apotex Inc. - Product / Service
                • Apotex Inc. - Key news
                • Apotex Inc. - Key offerings
                • SWOT
              • 15.6 Astellas Pharma Inc.
                • Astellas Pharma Inc. - Overview
                • Astellas Pharma Inc. - Product / Service
                • Astellas Pharma Inc. - Key offerings
                • SWOT
              • 15.7 Aurobindo Pharma Ltd.
                • Aurobindo Pharma Ltd. - Overview
                • Aurobindo Pharma Ltd. - Product / Service
                • Aurobindo Pharma Ltd. - Key offerings
                • SWOT
              • 15.8 Axonics Inc.
                • Axonics Inc. - Overview
                • Axonics Inc. - Business segments
                • Axonics Inc. - Key offerings
                • Axonics Inc. - Segment focus
                • SWOT
              • 15.9 Dr Reddys Laboratories Ltd.
                • Dr Reddys Laboratories Ltd. - Overview
                • Dr Reddys Laboratories Ltd. - Business segments
                • Dr Reddys Laboratories Ltd. - Key news
                • Dr Reddys Laboratories Ltd. - Key offerings
                • Dr Reddys Laboratories Ltd. - Segment focus
                • SWOT
              • 15.10 Johnson and Johnson Services Inc.
                • Johnson and Johnson Services Inc. - Overview
                • Johnson and Johnson Services Inc. - Business segments
                • Johnson and Johnson Services Inc. - Key news
                • Johnson and Johnson Services Inc. - Key offerings
                • Johnson and Johnson Services Inc. - Segment focus
                • SWOT
              • 15.11 Lupin Ltd.
                • Lupin Ltd. - Overview
                • Lupin Ltd. - Business segments
                • Lupin Ltd. - Key news
                • Lupin Ltd. - Key offerings
                • Lupin Ltd. - Segment focus
                • SWOT
              • 15.12 Medtronic Plc
                • Medtronic Plc - Overview
                • Medtronic Plc - Business segments
                • Medtronic Plc - Key news
                • Medtronic Plc - Key offerings
                • Medtronic Plc - Segment focus
                • SWOT
              • 15.13 Merck and Co. Inc.
                • Merck and Co. Inc. - Overview
                • Merck and Co. Inc. - Business segments
                • Merck and Co. Inc. - Key news
                • Merck and Co. Inc. - Key offerings
                • Merck and Co. Inc. - Segment focus
                • SWOT
              • 15.14 Ono Pharmaceutical Co. Ltd.
                • Ono Pharmaceutical Co. Ltd. - Overview
                • Ono Pharmaceutical Co. Ltd. - Product / Service
                • Ono Pharmaceutical Co. Ltd. - Key offerings
                • SWOT
              • 15.15 Pfizer Inc.
                • Pfizer Inc. - Overview
                • Pfizer Inc. - Product / Service
                • Pfizer Inc. - Key news
                • Pfizer Inc. - Key offerings
                • SWOT
              • 15.16 Sumitomo Pharma Co. Ltd.
                • Sumitomo Pharma Co. Ltd. - Overview
                • Sumitomo Pharma Co. Ltd. - Business segments
                • Sumitomo Pharma Co. Ltd. - Key offerings
                • Sumitomo Pharma Co. Ltd. - Segment focus
                • SWOT
              • 15.17 Sun Pharmaceutical Industries Ltd.
                • Sun Pharmaceutical Industries Ltd. - Overview
                • Sun Pharmaceutical Industries Ltd. - Product / Service
                • Sun Pharmaceutical Industries Ltd. - Key news
                • Sun Pharmaceutical Industries Ltd. - Key offerings
                • SWOT
              • 15.18 Teva Pharmaceutical Industries Ltd.
                • Teva Pharmaceutical Industries Ltd. - Overview
                • Teva Pharmaceutical Industries Ltd. - Business segments
                • Teva Pharmaceutical Industries Ltd. - Key news
                • Teva Pharmaceutical Industries Ltd. - Key offerings
                • Teva Pharmaceutical Industries Ltd. - Segment focus
                • SWOT

              16 Appendix

              • 16.1 Scope of the report
                • 16.2 Inclusions and exclusions checklist
                  • Inclusions checklist
                  • Exclusions checklist
                • 16.3 Currency conversion rates for US$
                  • Currency conversion rates for US$
                • 16.4 Research methodology
                  • Research methodology
                • 16.5 Data procurement
                  • Information sources
                • 16.6 Data validation
                  • Data validation
                • 16.7 Validation techniques employed for market sizing
                  • Validation techniques employed for market sizing
                • 16.8 Data synthesis
                  • Data synthesis
                • 16.9 360 degree market analysis
                  • 360 degree market analysis
                • 16.10 List of abbreviations
                  • List of abbreviations

                Research Methodology

                Technavio presents a detailed picture of the market by way of study, synthesis, and summation of data from multiple sources. The analysts have presented the various facets of the market with a particular focus on identifying the key industry influencers. The data thus presented is comprehensive, reliable, and the result of extensive research, both primary and secondary.

                INFORMATION SOURCES

                Primary sources

                • Manufacturers and suppliers
                • Channel partners
                • Industry experts
                • Strategic decision makers

                Secondary sources

                • Industry journals and periodicals
                • Government data
                • Financial reports of key industry players
                • Historical data
                • Press releases

                DATA ANALYSIS

                Data Synthesis

                • Collation of data
                • Estimation of key figures
                • Analysis of derived insights

                Data Validation

                • Triangulation with data models
                • Reference against proprietary databases
                • Corroboration with industry experts

                REPORT WRITING

                Qualitative

                • Market drivers
                • Market challenges
                • Market trends
                • Five forces analysis

                Quantitative

                • Market size and forecast
                • Market segmentation
                • Geographical insights
                • Competitive landscape

                Interested in this report?

                Get your sample now to see our research methodology and insights!

                Download Now

                Frequently Asked Questions

                Overactive Bladder Therapeutics market growth will increase by $ 901.9 mn during 2025-2029.

                The Overactive Bladder Therapeutics market is expected to grow at a CAGR of 4% during 2025-2029.

                Overactive Bladder Therapeutics market is segmented by Product( Anticholinergics, Beta-3 adrenergic agonists, Others) Distribution Channel( Retail pharmacies, Hospital pharmacies, Online, ROW) Disease Type( Idiopathic overactive bladder, Neurogenic overactive bladder)

                AbbVie Inc., Apotex Inc., Astellas Pharma Inc., Aurobindo Pharma Ltd., Axonics Inc., Dr Reddys Laboratories Ltd., Ferring BV, Imbrium Therapeutics L.P, Johnson and Johnson Services Inc., Lipella Pharmaceuticals Inc., Lupin Ltd., Medtronic Plc, Medytox, Merck and Co. Inc., Ono Pharmaceutical Co. Ltd., Pfizer Inc., Sumitomo Pharma Co. Ltd., Sun Pharmaceutical Industries Ltd., Teva Pharmaceutical Industries Ltd., Viatris Inc. are a few of the key vendors in the Overactive Bladder Therapeutics market.

                North America will register the highest growth rate of 33% among the other regions. Therefore, the Overactive Bladder Therapeutics market in North America is expected to garner significant business opportunities for the vendors during the forecast period.

                US, China, Germany, India, UK, Canada, France, Japan, Brazil, South Korea

                • Aging populationThe aging population is a significant driver in the global overactive bladder therapeutics market is the driving factor this market.
                • as advancing age is closely associated with increased prevalence of urinary disorders is the driving factor this market.
                • including OAB. As of 2024 is the driving factor this market.
                • approximately 12 percent of the global population is the driving factor this market.
                • or around 1.2 billion individuals is the driving factor this market.
                • are aged 60 years and older. This demographic is expected to double by 2050 is the driving factor this market.
                • reaching 2.1 billion and comprising 26 percent of the total global population. The number of individuals aged 80 years and above is projected to triple is the driving factor this market.
                • reaching 426 million by the same year. These shifts underscore the growing demand for age-related healthcare interventions is the driving factor this market.
                • including those targeting bladder dysfunction. OAB is particularly common among older adults due to age-related changes in bladder capacity is the driving factor this market.
                • detrusor muscle function is the driving factor this market.
                • and neurological control. Additionally is the driving factor this market.
                • comorbidities such as diabetes is the driving factor this market.
                • stroke is the driving factor this market.
                • and Parkinsons disease is the driving factor this market.
                • which are more prevalent in the elderly is the driving factor this market.
                • further contribute to the onset and severity of OAB symptoms. As a result is the driving factor this market.
                • the aging population represents a key segment for therapeutic intervention is the driving factor this market.
                • with a strong need for both pharmacological and non-pharmacological treatment options. In India is the driving factor this market.
                • the demographic transition is especially pronounced. The proportion of the population aged 60 years and above is projected to rise from 10.5 percent in 2022 to 20.8 percent by 2050. This translates to an increase from approximately 153 million to 347 million elderly individuals. By 2046 is the driving factor this market.
                • the number of elderly citizens is expected to surpass the population of children aged 0 to 15 years is the driving factor this market.
                • marking a significant shift in healthcare priorities. This demographic evolution is expected to influence healthcare systems is the driving factor this market.
                • policy planning is the driving factor this market.
                • and pharmaceutical strategies is the driving factor this market.
                • reinforcing the importance of developing accessible is the driving factor this market.
                • effective is the driving factor this market.
                • and age-appropriate OAB therapies to meet the needs of a rapidly aging global population. is the driving factor this market.

                The Overactive Bladder Therapeutics market vendors should focus on grabbing business opportunities from the Anticholinergics segment as it accounted for the largest market share in the base year.