Overall Equipment Effectiveness Software Market Analysis, Size, and Forecast 2026-2030: North America (US, Canada, and Mexico), Europe (Germany, France, and UK), APAC (China, Japan, and India), South America (Brazil and Argentina), Middle East and Africa (Saudi Arabia, UAE, and South Africa), and Rest of World (ROW)

Overall Equipment Effectiveness Software Market Analysis, Size, and Forecast 2026-2030:
North America (US, Canada, and Mexico), Europe (Germany, France, and UK), APAC (China, Japan, and India), South America (Brazil and Argentina), Middle East and Africa (Saudi Arabia, UAE, and South Africa), and Rest of World (ROW)

Published: Dec 2025 300 Pages SKU: IRTNTR81218

Market Overview at a Glance

$53.06 B
Market Opportunity
10.8%
CAGR 2025 - 2030
38.6%
North America Growth
$48.20 B
Software segment 2024

Overall Equipment Effectiveness Software Market Size 2026-2030

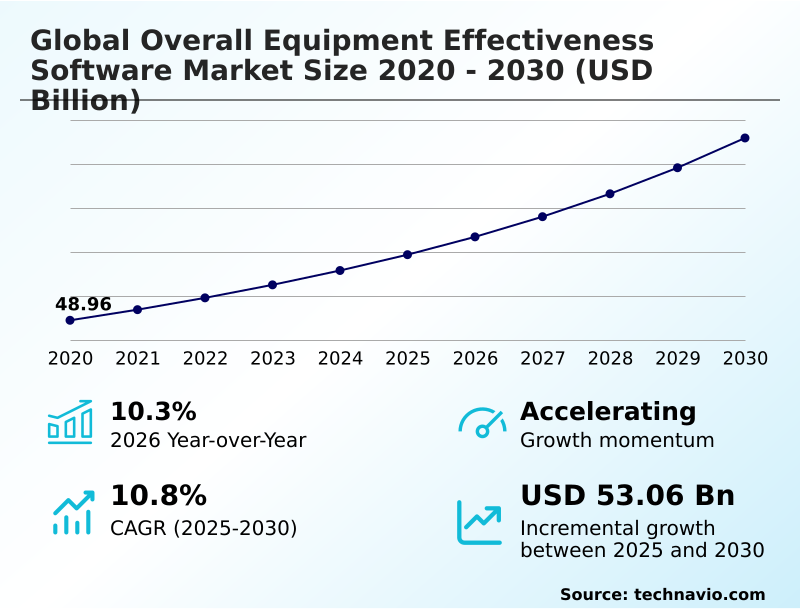
The overall equipment effectiveness software market size is valued to increase by USD 53.06 billion, at a CAGR of 10.8% from 2025 to 2030. Imperative for operational excellence amidst global competition and economic pressures will drive the overall equipment effectiveness software market.

Major Market Trends & Insights

  • North America dominated the market and accounted for a 38.6% growth during the forecast period.
  • By Component - Software segment was valued at USD 48.20 billion in 2024
  • By Deployment - Cloud based segment accounted for the largest market revenue share in 2024

Market Size & Forecast

  • Market Opportunities: USD 82.87 billion
  • Market Future Opportunities: USD 53.06 billion
  • CAGR from 2025 to 2030 : 10.8%

Market Summary

  • The overall equipment effectiveness software market is a critical enabler of modern industrial productivity, moving beyond simple measurement to become a cornerstone of the smart factory. Its primary function is to provide a standardized, data-driven methodology for identifying and quantifying production losses, allowing organizations to pursue operational excellence through process optimization.
  • A key driver is the convergence of the industrial internet of things (IIoT) for real-time data collection with AI-powered analytics. In a typical scenario, a manufacturer facing recurrent micro-stoppages on a packaging line can leverage machine learning algorithms within their OEE platform for automated root cause analysis.
  • Instead of relying on manual observation, the system analyzes sensor data patterns to pinpoint a faulty conveyor motor, enabling predictive maintenance before a major breakdown occurs. This shift from reactive to proactive management is transforming production efficiency. The market is also shaped by the move toward cloud-based OEE solutions, which lowers barriers to entry for smaller firms.
  • However, challenges such as data harmonization with legacy systems and the need for robust cybersecurity persist. The ultimate goal is a state of lean manufacturing where downtime tracking and production monitoring feed a cycle of continuous improvement.

What will be the Size of the Overall Equipment Effectiveness Software Market during the forecast period?

Get Key Insights on Market Forecast (PDF) Request Free Sample

How is the Overall Equipment Effectiveness Software Market Segmented?

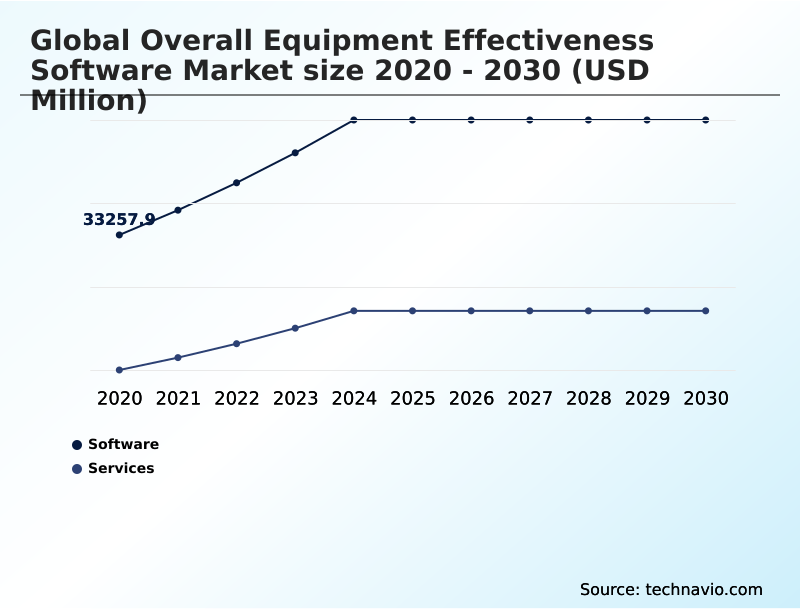
The overall equipment effectiveness software industry research report provides comprehensive data (region-wise segment analysis), with forecasts and estimates in "USD million" for the period 2026-2030, as well as historical data from 2020-2024 for the following segments.

  • Component
    • Software
    • Services
  • Deployment
    • Cloud based
    • On premises
  • Application
    • Manufacturing
    • Automotive
    • Food and beverage
    • Pharmaceuticals
    • Others
  • Geography
    • North America
      • US
      • Canada
      • Mexico
    • Europe
      • Germany
      • France
      • UK
    • APAC
      • China
      • Japan
      • India
    • South America
      • Brazil
      • Argentina
    • Middle East and Africa
      • Saudi Arabia
      • UAE
      • South Africa
    • Rest of World (ROW)

By Component Insights

The software segment is estimated to witness significant growth during the forecast period.

The software segment is the core of the market, evolving from basic logging tools to sophisticated, intelligent platforms.

A major shift is towards the SaaS deployment model, which enhances accessibility and scalability for users, including those in OEE software for automotive manufacturing. These platforms leverage IIoT integration for OEE tracking to enable real-time data collection and analysis.

Innovation focuses on integrating artificial intelligence to move beyond reactive monitoring to proactive systems that perform advanced root cause analysis. A key differentiator is now the user experience in OEE platforms, with intuitive dashboards and mobile applications driving wider adoption.

Firms using these advanced systems report improvements in production efficiency, with some achieving a 15% reduction in unplanned downtime by leveraging predictive alerts.

Request Free Sample

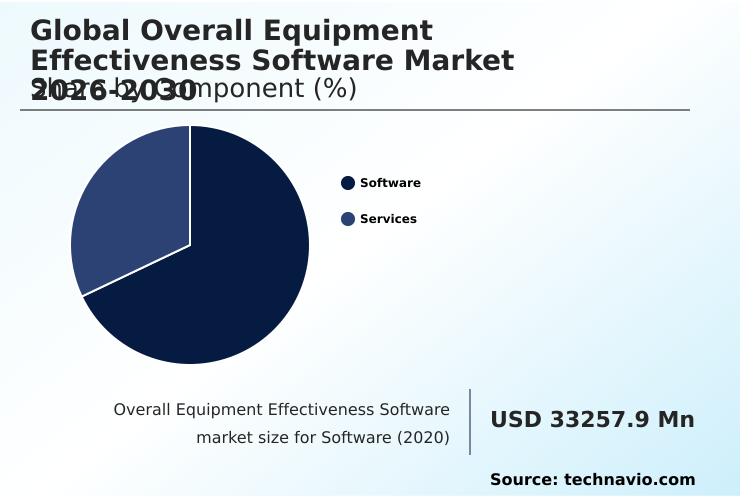
The Software segment was valued at USD 48.20 billion in 2024 and showed a gradual increase during the forecast period.

Request Free Sample

Regional Analysis

North America is estimated to contribute 38.6% to the growth of the global market during the forecast period.Technavio’s analysts have elaborately explained the regional trends and drivers that shape the market during the forecast period.

See How Overall Equipment Effectiveness Software Market Demand is Rising in North America Request Free Sample

The geographic landscape of the overall equipment effectiveness software market is diverse. North America accounts for over 38% of the market's incremental growth, driven by mature industries focused on digital transformation and advanced lean manufacturing practices.

The APAC region, however, is projected to grow fastest, with a CAGR of 11.5%, fueled by government initiatives and the rapid industrialization of economies like China and India.

In Europe, the focus is on integrating OEE within sophisticated smart factory ecosystems, emphasizing MES and ERP integration with OEE.

The adoption of cloud-based OEE solutions for SMEs is a global phenomenon, democratizing access to powerful analytics and a standardized OEE calculation and formula that were previously exclusive to large corporations.

Market Dynamics

Our researchers analyzed the data with 2025 as the base year, along with the key drivers, trends, and challenges. A holistic analysis of drivers will help companies refine their marketing strategies to gain a competitive advantage.

  • Manufacturers are increasingly focused on how to improve overall equipment effectiveness by moving beyond basic monitoring to strategic optimization. A key part of this strategy involves using AI for predictive maintenance scheduling, which allows for proactive interventions that minimize disruptions.
  • For instance, in the consumer goods sector, real-time OEE for food and beverage applications have become critical for managing perishable inventory and frequent line changeovers, with a focus on reducing changeover time with OEE software. The benefits of cloud based OEE software include scalability and lower upfront costs, making advanced analytics accessible to more businesses.
  • However, successful deployment hinges on effective OEE software integration with ERP systems to create a single source of truth for operational data. Advanced platforms now leverage machine learning for production loss analysis, automating the difficult task of tracking the six big losses in manufacturing and enabling generative AI for root cause analysis.
  • This intelligence is delivered through intuitive interfaces, where the user interface design for OEE dashboards and the availability of mobile OEE apps for shop floor operators are crucial for shop-floor engagement. For security-conscious industries, understanding cybersecurity best practices for OT networks is non-negotiable, often leading to a discussion of comparing on premises vs cloud OEE.
  • The role of IIoT in automated data collection and the use of edge computing applications in OEE systems are foundational to the smart factory OEE implementation roadmap. Ultimately, the goal is to implement lean manufacturing with OEE data, where prescriptive analytics for process optimization guides decision-making.
  • Firms that effectively utilize OEE for both asset performance management vs OEE and using OEE data for sustainability reporting report efficiency gains that are more than double those of their peers who only track basic metrics. This is true whether calculating OEE for discrete manufacturing lines or managing complex pharmaceutical processes that demand strict OEE software for pharmaceutical compliance.
  • The evolution toward how industrial copilots improve OEE and address data harmonization for legacy manufacturing equipment marks the next frontier of operational excellence.

What are the key market drivers leading to the rise in the adoption of Overall Equipment Effectiveness Software Industry?

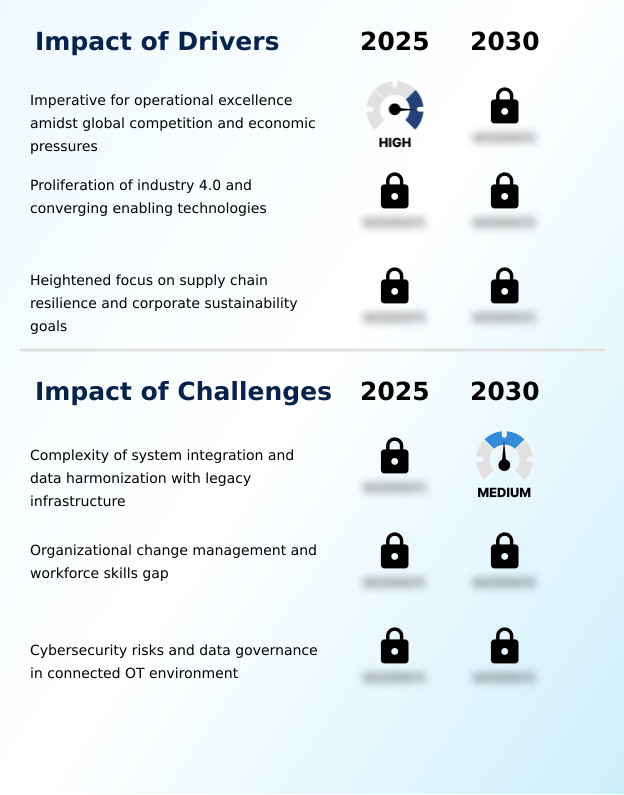
  • The imperative for operational excellence, driven by global competition and economic pressures, remains a key driver for the market.

  • The primary driver for market adoption is the pursuit of operational excellence in a competitive landscape. The convergence of enabling technologies, particularly the industrial internet of things (IIoT), has revolutionized data acquisition, making automated downtime tracking both feasible and accurate.
  • This real-time data is the foundation for continuous improvement, with implementations showing up to a 25% reduction in unplanned stops. The benefits of OEE software extend beyond productivity; improved efficiency directly impacts sustainability.
  • Organizations are increasingly using these platforms for sustainability reporting with OEE, as reducing waste and energy consumption aligns with corporate goals.
  • This dual incentive, enhancing both profitability and environmental performance, has broadened the software's appeal, accelerating adoption across diverse manufacturing sectors.

What are the market trends shaping the Overall Equipment Effectiveness Software Industry?

  • A defining market trend is the infusion of artificial intelligence, evolving overall equipment effectiveness software from descriptive reporting to predictive and prescriptive analytics.

  • The evolution of OEE software is marked by the integration of artificial intelligence, shifting capabilities from descriptive reporting to advanced prescriptive analytics. This trend transforms platforms into active advisors for the smart factory, recommending specific actions to prevent losses. Innovations in user accessibility, such as low-code OEE platforms, empower non-technical staff to customize reports, improving adoption rates by over 40%.
  • The real-time OEE dashboard is now a standard, providing instant visibility into performance against targets, especially critical in sectors like the OEE for food and beverage industry where changeover speed is key. These systems enable a more dynamic approach to tackling the Six Big Losses, with AI-driven root cause analysis identifying underlying issues 60% faster than manual methods.

What challenges does the Overall Equipment Effectiveness Software Industry face during its growth?

  • The complexity of system integration and data harmonization with legacy infrastructure presents a key challenge to industry growth.

  • A significant challenge is the complexity of data harmonization, especially when integrating modern software with legacy equipment. This requires significant effort in manufacturing execution systems integration (MES) to create a unified data model. Adherence to OEE implementation best practices is crucial to overcome cultural resistance and bridge skills gaps, as employees may view the new transparency as a surveillance tool.
  • Furthermore, as systems become connected, cybersecurity for OEE systems becomes a critical concern, with cyberattacks on operational technology (OT) networks posing a significant risk. This has led many organizations to adopt a hybrid cloud OEE architecture, which balances the real-time performance of on-premises systems with the scalability of the cloud while keeping sensitive data secure.

Exclusive Technavio Analysis on Customer Landscape

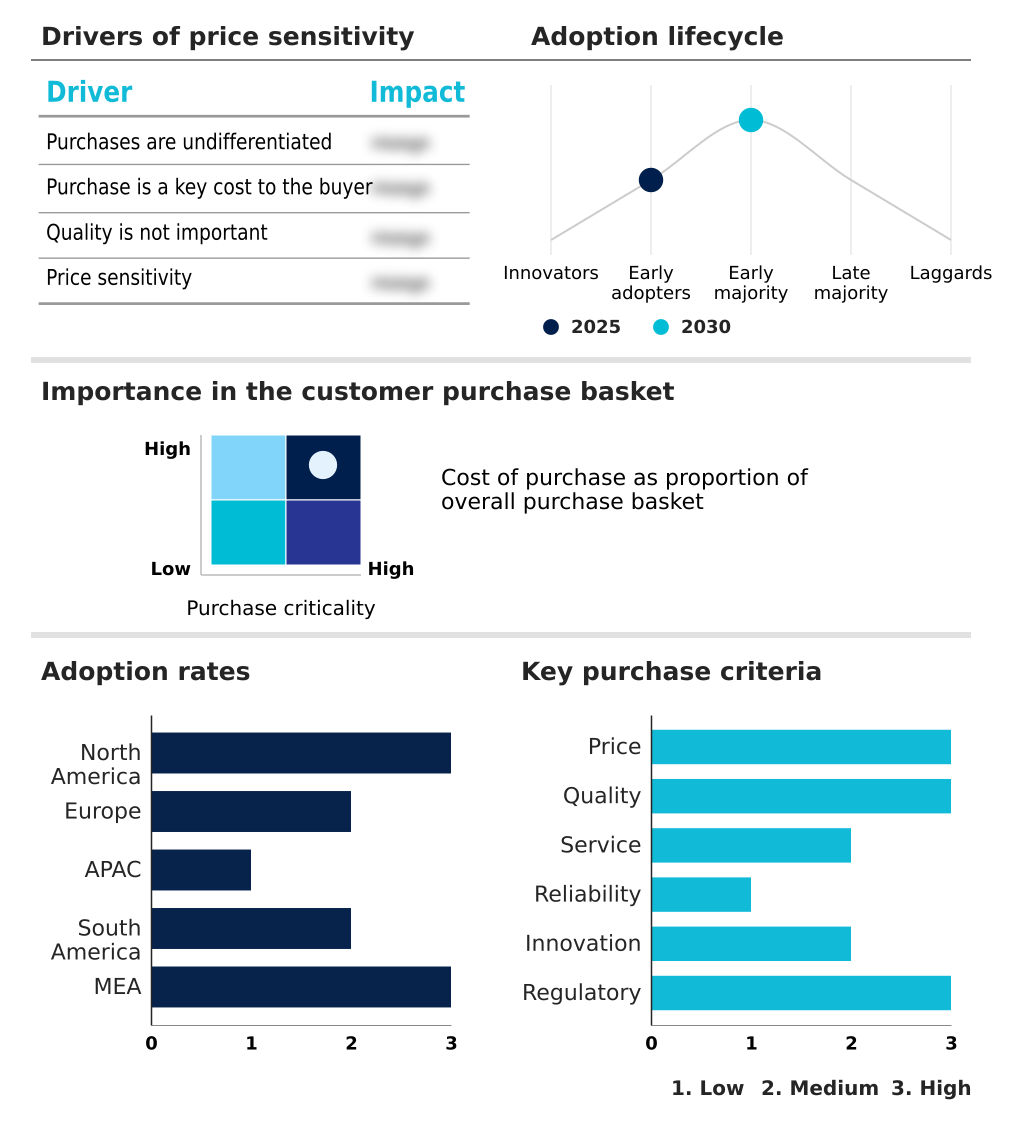
The overall equipment effectiveness software market forecasting report includes the adoption lifecycle of the market, covering from the innovator’s stage to the laggard’s stage. It focuses on adoption rates in different regions based on penetration. Furthermore, the overall equipment effectiveness software market report also includes key purchase criteria and drivers of price sensitivity to help companies evaluate and develop their market growth analysis strategies.

Customer Landscape of Overall Equipment Effectiveness Software Industry

Competitive Landscape

Companies are implementing various strategies, such as strategic alliances, overall equipment effectiveness software market forecast, partnerships, mergers and acquisitions, geographical expansion, and product/service launches, to enhance their presence in the industry.

ABB Ltd. - Delivers real-time OEE calculation, analysis, and visualization through integrated manufacturing operations management modules, enhancing production visibility and control.

The industry research and growth report includes detailed analyses of the competitive landscape of the market and information about key companies, including:

  • ABB Ltd.
  • Augury Inc.
  • eschbach
  • Evocon
  • FourJaw Manufacturing
  • Lighthouse Systems
  • Litmus Automation Inc.
  • MachineMetrics
  • OEEsystems
  • Plex Systems Inc.
  • Rockwell Automation Inc.
  • Schneider Electric SE
  • Siemens AG
  • Symbium Corp.
  • UpKeep Technologies Inc.

Qualitative and quantitative analysis of companies has been conducted to help clients understand the wider business environment as well as the strengths and weaknesses of key industry players. Data is qualitatively analyzed to categorize companies as pure play, category-focused, industry-focused, and diversified; it is quantitatively analyzed to categorize companies as dominant, leading, strong, tentative, and weak.

Recent Development and News in Overall equipment effectiveness software market

  • In November, 2024, ABB India formed a strategic alliance with Deloitte India to accelerate digital transformation for manufacturers, combining AI-enabled tools and connected systems with strategic consulting to enhance operational efficiency.
  • In May, 2025, Augury Inc. launched its Machine Health Ultra Low solution, which employs AI and specialized ultrasonic sensors to provide predictive diagnostics for slow-rotating machinery, an area traditionally difficult to monitor.
  • In March, 2025, MachineMetrics launched a predictive tool monitoring solution that utilizes AI to analyze operational data, diagnose issues, and prevent machine tool failures before they occur.
  • In April, 2025, Schneider Electric SE, in collaboration with Microsoft, unveiled its industrial copilot at Automate 2025, integrating generative AI into its automation platform to offer predictive maintenance advice and guide operators through complex procedures.

Dive into Technavio’s robust research methodology, blending expert interviews, extensive data synthesis, and validated models for unparalleled Overall Equipment Effectiveness Software Market insights. See full methodology.

Market Scope
Page number 300
Base year 2025
Historic period 2020-2024
Forecast period 2026-2030
Growth momentum & CAGR Accelerate at a CAGR of 10.8%
Market growth 2026-2030 USD 53057.6 million
Market structure Fragmented
YoY growth 2025-2026(%) 10.3%
Key countries US, Canada, Mexico, Germany, France, UK, Italy, Spain, The Netherlands, China, Japan, India, South Korea, Australia, Indonesia, Brazil, Argentina, Chile, Saudi Arabia, UAE, South Africa, Israel and Turkey
Competitive landscape Leading Companies, Market Positioning of Companies, Competitive Strategies, and Industry Risks

Request Free Sample

Research Analyst Overview

  • The overall equipment effectiveness software market is fundamentally reshaping manufacturing through digital transformation. The core technology is evolving beyond simple downtime tracking and production monitoring into a central nervous system for the smart factory. A key trend is the integration of AI-powered analytics, which enables not only predictive maintenance but also advanced prescriptive analytics for real-time process optimization.
  • This shift is made possible by the industrial internet of things (IIoT) for real-time data collection and edge computing for immediate analysis. Boardroom decisions are increasingly influenced by the choice between a cloud-based OEE in a SaaS deployment model versus on-premises solutions, impacting CapEx and OpEx strategies.
  • Successful implementation requires seamless manufacturing execution systems integration and careful data harmonization to tackle the Six Big Losses effectively. The emergence of industrial copilots powered by generative AI is making complex root cause analysis accessible to more users, driving the pursuit of operational excellence.
  • This aligns with lean manufacturing principles and enhances asset performance management, with firms deploying such systems reporting up to a 30% reduction in production cycle times. This focus on production efficiency is paramount.

What are the Key Data Covered in this Overall Equipment Effectiveness Software Market Research and Growth Report?

  • What is the expected growth of the Overall Equipment Effectiveness Software Market between 2026 and 2030?

    • USD 53.06 billion, at a CAGR of 10.8%

  • What segmentation does the market report cover?

    • The report is segmented by Component (Software, and Services), Deployment (Cloud based, and On premises), Application (Manufacturing, Automotive, Food and beverage, Pharmaceuticals and Others) and Geography (North America, Europe, APAC, South America, Middle East and Africa)

  • Which regions are analyzed in the report?

    • North America, Europe, APAC, South America and Middle East and Africa

  • What are the key growth drivers and market challenges?

    • Imperative for operational excellence amidst global competition and economic pressures, Complexity of system integration and data harmonization with legacy infrastructure

  • Who are the major players in the Overall Equipment Effectiveness Software Market?

    • ABB Ltd., Augury Inc., eschbach, Evocon, FourJaw Manufacturing, Lighthouse Systems, Litmus Automation Inc., MachineMetrics, OEEsystems, Plex Systems Inc., Rockwell Automation Inc., Schneider Electric SE, Siemens AG, Symbium Corp. and UpKeep Technologies Inc.

Market Research Insights

  • The market is driven by specific industry needs, from OEE software for automotive manufacturing to pharmaceutical manufacturing OEE compliance. The adoption of cloud-based OEE solutions for SMEs has democratized access to tools that were once exclusive, with firms reporting ROI improvements of over 200% within two years.
  • IIoT integration for OEE tracking is now a standard, enabling features like OEE software predictive tool monitoring. The effective use of AI in manufacturing process optimization is a key differentiator, particularly in OEE for discrete manufacturing and OEE for process manufacturing.
  • A superior user experience in OEE platforms, featuring a real-time OEE dashboard and powerful mobile OEE applications, is critical for adoption. Understanding the benefits of OEE software and following OEE implementation best practices are crucial for success, especially concerning cybersecurity for OEE systems.
  • Integration capabilities, such as MES and ERP integration with OEE, and flexible architectures like hybrid cloud OEE architecture, support complex needs. The ability to use the system for sustainability reporting with OEE adds another layer of value, moving beyond just reducing downtime with OEE software.
  • The OEE calculation and formula remain central, but the focus is on the top OEE software features, including low-code OEE platforms, which are becoming standard.

We can help! Our analysts can customize this overall equipment effectiveness software market research report to meet your requirements.

Get in touch

1. Executive Summary

1.1 Market overview

Executive Summary - Chart on Market Overview
Executive Summary - Data Table on Market Overview
Executive Summary - Chart on Global Market Characteristics
Executive Summary - Chart on Market by Geography
Executive Summary - Chart on Market Segmentation by Component
Executive Summary - Chart on Market Segmentation by Deployment
Executive Summary - Chart on Market Segmentation by Application
Executive Summary - Chart on Incremental Growth
Executive Summary - Data Table on Incremental Growth
Executive Summary - Chart on Company Market Positioning

2. Technavio Analysis

2.1 Analysis of price sensitivity, lifecycle, customer purchase basket, adoption rates, and purchase criteria

2.2 Criticality of inputs and Factors of differentiation

Chart on Overview on criticality of inputs and factors of differentiation

2.3 Factors of disruption

Chart on Overview on factors of disruption

2.4 Impact of drivers and challenges

Chart on Impact of drivers and challenges in 2025 and 2030

3. Market Landscape

3.1 Market ecosystem

Chart on Parent Market
Data Table on - Parent Market

3.2 Market characteristics

Chart on Market characteristics analysis

3.3 Value chain analysis

Chart on Value chain analysis

4. Market Sizing

4.1 Market definition

Data Table on Offerings of companies included in the market definition

4.2 Market segment analysis

Market segments

4.3 Market size 2025

4.4 Market outlook: Forecast for 2025-2030

Chart on Global - Market size and forecast 2025-2030 ($ million)
Data Table on Global - Market size and forecast 2025-2030 ($ million)
Chart on Global Market: Year-over-year growth 2025-2030 (%)
Data Table on Global Market: Year-over-year growth 2025-2030 (%)

5. Historic Market Size

5.1 Global Overall Equipment Effectiveness Software Market 2020 - 2024

Historic Market Size - Data Table on Global Overall Equipment Effectiveness Software Market 2020 - 2024 ($ million)

5.2 Component segment analysis 2020 - 2024

Historic Market Size - Component Segment 2020 - 2024 ($ million)

5.3 Deployment segment analysis 2020 - 2024

Historic Market Size - Deployment Segment 2020 - 2024 ($ million)

5.4 Application segment analysis 2020 - 2024

Historic Market Size - Application Segment 2020 - 2024 ($ million)

5.5 Geography segment analysis 2020 - 2024

Historic Market Size - Geography Segment 2020 - 2024 ($ million)

5.6 Country segment analysis 2020 - 2024

Historic Market Size - Country Segment 2020 - 2024 ($ million)

6. Qualitative Analysis

6.1 The AI impact on global overall equipment effectiveness software market

7. Five Forces Analysis

7.1 Five forces summary

Five forces analysis - Comparison between 2025 and 2030

7.2 Bargaining power of buyers

Bargaining power of buyers - Impact of key factors 2025 and 2030

7.3 Bargaining power of suppliers

Bargaining power of suppliers - Impact of key factors in 2025 and 2030

7.4 Threat of new entrants

Threat of new entrants - Impact of key factors in 2025 and 2030

7.5 Threat of substitutes

Threat of substitutes - Impact of key factors in 2025 and 2030

7.6 Threat of rivalry

Threat of rivalry - Impact of key factors in 2025 and 2030

7.7 Market condition

Chart on Market condition - Five forces 2025 and 2030

8. Market Segmentation by Component

8.1 Market segments

Chart on Component - Market share 2025-2030 (%)
Data Table on Component - Market share 2025-2030 (%)

8.2 Comparison by Component

Chart on Comparison by Component
Data Table on Comparison by Component

8.3 Software - Market size and forecast 2025-2030

Chart on Software - Market size and forecast 2025-2030 ($ million)
Data Table on Software - Market size and forecast 2025-2030 ($ million)
Chart on Software - Year-over-year growth 2025-2030 (%)
Data Table on Software - Year-over-year growth 2025-2030 (%)

8.4 Services - Market size and forecast 2025-2030

Chart on Services - Market size and forecast 2025-2030 ($ million)
Data Table on Services - Market size and forecast 2025-2030 ($ million)
Chart on Services - Year-over-year growth 2025-2030 (%)
Data Table on Services - Year-over-year growth 2025-2030 (%)

8.5 Market opportunity by Component

Market opportunity by Component ($ million)
Data Table on Market opportunity by Component ($ million)

9. Market Segmentation by Deployment

9.1 Market segments

Chart on Deployment - Market share 2025-2030 (%)
Data Table on Deployment - Market share 2025-2030 (%)

9.2 Comparison by Deployment

Chart on Comparison by Deployment
Data Table on Comparison by Deployment

9.3 Cloud based - Market size and forecast 2025-2030

Chart on Cloud based - Market size and forecast 2025-2030 ($ million)
Data Table on Cloud based - Market size and forecast 2025-2030 ($ million)
Chart on Cloud based - Year-over-year growth 2025-2030 (%)
Data Table on Cloud based - Year-over-year growth 2025-2030 (%)

9.4 On premises - Market size and forecast 2025-2030

Chart on On premises - Market size and forecast 2025-2030 ($ million)
Data Table on On premises - Market size and forecast 2025-2030 ($ million)
Chart on On premises - Year-over-year growth 2025-2030 (%)
Data Table on On premises - Year-over-year growth 2025-2030 (%)

9.5 Market opportunity by Deployment

Market opportunity by Deployment ($ million)
Data Table on Market opportunity by Deployment ($ million)

10. Market Segmentation by Application

10.1 Market segments

Chart on Application - Market share 2025-2030 (%)
Data Table on Application - Market share 2025-2030 (%)

10.2 Comparison by Application

Chart on Comparison by Application
Data Table on Comparison by Application

10.3 Manufacturing - Market size and forecast 2025-2030

Chart on Manufacturing - Market size and forecast 2025-2030 ($ million)
Data Table on Manufacturing - Market size and forecast 2025-2030 ($ million)
Chart on Manufacturing - Year-over-year growth 2025-2030 (%)
Data Table on Manufacturing - Year-over-year growth 2025-2030 (%)

10.4 Automotive - Market size and forecast 2025-2030

Chart on Automotive - Market size and forecast 2025-2030 ($ million)
Data Table on Automotive - Market size and forecast 2025-2030 ($ million)
Chart on Automotive - Year-over-year growth 2025-2030 (%)
Data Table on Automotive - Year-over-year growth 2025-2030 (%)

10.5 Food and beverage - Market size and forecast 2025-2030

Chart on Food and beverage - Market size and forecast 2025-2030 ($ million)
Data Table on Food and beverage - Market size and forecast 2025-2030 ($ million)
Chart on Food and beverage - Year-over-year growth 2025-2030 (%)
Data Table on Food and beverage - Year-over-year growth 2025-2030 (%)

10.6 Pharmaceuticals - Market size and forecast 2025-2030

Chart on Pharmaceuticals - Market size and forecast 2025-2030 ($ million)
Data Table on Pharmaceuticals - Market size and forecast 2025-2030 ($ million)
Chart on Pharmaceuticals - Year-over-year growth 2025-2030 (%)
Data Table on Pharmaceuticals - Year-over-year growth 2025-2030 (%)

10.7 Others - Market size and forecast 2025-2030

Chart on Others - Market size and forecast 2025-2030 ($ million)
Data Table on Others - Market size and forecast 2025-2030 ($ million)
Chart on Others - Year-over-year growth 2025-2030 (%)
Data Table on Others - Year-over-year growth 2025-2030 (%)

10.8 Market opportunity by Application

Market opportunity by Application ($ million)
Data Table on Market opportunity by Application ($ million)

11. Customer Landscape

11.1 Customer landscape overview

Analysis of price sensitivity, lifecycle, customer purchase basket, adoption rates, and purchase criteria

12. Geographic Landscape

12.1 Geographic segmentation

Chart on Market share by geography 2025-2030 (%)
Data Table on Market share by geography 2025-2030 (%)

12.2 Geographic comparison

Chart on Geographic comparison
Data Table on Geographic comparison

12.3 North America - Market size and forecast 2025-2030

Chart on North America - Market size and forecast 2025-2030 ($ million)
Data Table on North America - Market size and forecast 2025-2030 ($ million)
Chart on North America - Year-over-year growth 2025-2030 (%)
Data Table on North America - Year-over-year growth 2025-2030 (%)
Chart on Regional Comparison - North America
Data Table on Regional Comparison - North America

12.3.1 US - Market size and forecast 2025-2030

Chart on US - Market size and forecast 2025-2030 ($ million)
Data Table on US - Market size and forecast 2025-2030 ($ million)
Chart on US - Year-over-year growth 2025-2030 (%)
Data Table on US - Year-over-year growth 2025-2030 (%)

12.3.2 Canada - Market size and forecast 2025-2030

Chart on Canada - Market size and forecast 2025-2030 ($ million)
Data Table on Canada - Market size and forecast 2025-2030 ($ million)
Chart on Canada - Year-over-year growth 2025-2030 (%)
Data Table on Canada - Year-over-year growth 2025-2030 (%)

12.3.3 Mexico - Market size and forecast 2025-2030

Chart on Mexico - Market size and forecast 2025-2030 ($ million)
Data Table on Mexico - Market size and forecast 2025-2030 ($ million)
Chart on Mexico - Year-over-year growth 2025-2030 (%)
Data Table on Mexico - Year-over-year growth 2025-2030 (%)

12.4 Europe - Market size and forecast 2025-2030

Chart on Europe - Market size and forecast 2025-2030 ($ million)
Data Table on Europe - Market size and forecast 2025-2030 ($ million)
Chart on Europe - Year-over-year growth 2025-2030 (%)
Data Table on Europe - Year-over-year growth 2025-2030 (%)
Chart on Regional Comparison - Europe
Data Table on Regional Comparison - Europe

12.4.1 Germany - Market size and forecast 2025-2030

Chart on Germany - Market size and forecast 2025-2030 ($ million)
Data Table on Germany - Market size and forecast 2025-2030 ($ million)
Chart on Germany - Year-over-year growth 2025-2030 (%)
Data Table on Germany - Year-over-year growth 2025-2030 (%)

12.4.2 France - Market size and forecast 2025-2030

Chart on France - Market size and forecast 2025-2030 ($ million)
Data Table on France - Market size and forecast 2025-2030 ($ million)
Chart on France - Year-over-year growth 2025-2030 (%)
Data Table on France - Year-over-year growth 2025-2030 (%)

12.4.3 UK - Market size and forecast 2025-2030

Chart on UK - Market size and forecast 2025-2030 ($ million)
Data Table on UK - Market size and forecast 2025-2030 ($ million)
Chart on UK - Year-over-year growth 2025-2030 (%)
Data Table on UK - Year-over-year growth 2025-2030 (%)

12.4.4 Italy - Market size and forecast 2025-2030

Chart on Italy - Market size and forecast 2025-2030 ($ million)
Data Table on Italy - Market size and forecast 2025-2030 ($ million)
Chart on Italy - Year-over-year growth 2025-2030 (%)
Data Table on Italy - Year-over-year growth 2025-2030 (%)

12.4.5 Spain - Market size and forecast 2025-2030

Chart on Spain - Market size and forecast 2025-2030 ($ million)
Data Table on Spain - Market size and forecast 2025-2030 ($ million)
Chart on Spain - Year-over-year growth 2025-2030 (%)
Data Table on Spain - Year-over-year growth 2025-2030 (%)

12.4.6 The Netherlands - Market size and forecast 2025-2030

Chart on The Netherlands - Market size and forecast 2025-2030 ($ million)
Data Table on The Netherlands - Market size and forecast 2025-2030 ($ million)
Chart on The Netherlands - Year-over-year growth 2025-2030 (%)
Data Table on The Netherlands - Year-over-year growth 2025-2030 (%)

12.5 APAC - Market size and forecast 2025-2030

Chart on APAC - Market size and forecast 2025-2030 ($ million)
Data Table on APAC - Market size and forecast 2025-2030 ($ million)
Chart on APAC - Year-over-year growth 2025-2030 (%)
Data Table on APAC - Year-over-year growth 2025-2030 (%)
Chart on Regional Comparison - APAC
Data Table on Regional Comparison - APAC

12.5.1 China - Market size and forecast 2025-2030

Chart on China - Market size and forecast 2025-2030 ($ million)
Data Table on China - Market size and forecast 2025-2030 ($ million)
Chart on China - Year-over-year growth 2025-2030 (%)
Data Table on China - Year-over-year growth 2025-2030 (%)

12.5.2 Japan - Market size and forecast 2025-2030

Chart on Japan - Market size and forecast 2025-2030 ($ million)
Data Table on Japan - Market size and forecast 2025-2030 ($ million)
Chart on Japan - Year-over-year growth 2025-2030 (%)
Data Table on Japan - Year-over-year growth 2025-2030 (%)

12.5.3 India - Market size and forecast 2025-2030

Chart on India - Market size and forecast 2025-2030 ($ million)
Data Table on India - Market size and forecast 2025-2030 ($ million)
Chart on India - Year-over-year growth 2025-2030 (%)
Data Table on India - Year-over-year growth 2025-2030 (%)

12.5.4 South Korea - Market size and forecast 2025-2030

Chart on South Korea - Market size and forecast 2025-2030 ($ million)
Data Table on South Korea - Market size and forecast 2025-2030 ($ million)
Chart on South Korea - Year-over-year growth 2025-2030 (%)
Data Table on South Korea - Year-over-year growth 2025-2030 (%)

12.5.5 Australia - Market size and forecast 2025-2030

Chart on Australia - Market size and forecast 2025-2030 ($ million)
Data Table on Australia - Market size and forecast 2025-2030 ($ million)
Chart on Australia - Year-over-year growth 2025-2030 (%)
Data Table on Australia - Year-over-year growth 2025-2030 (%)

12.5.6 Indonesia - Market size and forecast 2025-2030

Chart on Indonesia - Market size and forecast 2025-2030 ($ million)
Data Table on Indonesia - Market size and forecast 2025-2030 ($ million)
Chart on Indonesia - Year-over-year growth 2025-2030 (%)
Data Table on Indonesia - Year-over-year growth 2025-2030 (%)

12.6 South America - Market size and forecast 2025-2030

Chart on South America - Market size and forecast 2025-2030 ($ million)
Data Table on South America - Market size and forecast 2025-2030 ($ million)
Chart on South America - Year-over-year growth 2025-2030 (%)
Data Table on South America - Year-over-year growth 2025-2030 (%)
Chart on Regional Comparison - South America
Data Table on Regional Comparison - South America

12.6.1 Brazil - Market size and forecast 2025-2030

Chart on Brazil - Market size and forecast 2025-2030 ($ million)
Data Table on Brazil - Market size and forecast 2025-2030 ($ million)
Chart on Brazil - Year-over-year growth 2025-2030 (%)
Data Table on Brazil - Year-over-year growth 2025-2030 (%)

12.6.2 Argentina - Market size and forecast 2025-2030

Chart on Argentina - Market size and forecast 2025-2030 ($ million)
Data Table on Argentina - Market size and forecast 2025-2030 ($ million)
Chart on Argentina - Year-over-year growth 2025-2030 (%)
Data Table on Argentina - Year-over-year growth 2025-2030 (%)

12.6.3 Chile - Market size and forecast 2025-2030

Chart on Chile - Market size and forecast 2025-2030 ($ million)
Data Table on Chile - Market size and forecast 2025-2030 ($ million)
Chart on Chile - Year-over-year growth 2025-2030 (%)
Data Table on Chile - Year-over-year growth 2025-2030 (%)

12.7 Middle East and Africa - Market size and forecast 2025-2030

Chart on Middle East and Africa - Market size and forecast 2025-2030 ($ million)
Data Table on Middle East and Africa - Market size and forecast 2025-2030 ($ million)
Chart on Middle East and Africa - Year-over-year growth 2025-2030 (%)
Data Table on Middle East and Africa - Year-over-year growth 2025-2030 (%)
Chart on Regional Comparison - Middle East and Africa
Data Table on Regional Comparison - Middle East and Africa

12.7.1 Saudi Arabia - Market size and forecast 2025-2030

Chart on Saudi Arabia - Market size and forecast 2025-2030 ($ million)
Data Table on Saudi Arabia - Market size and forecast 2025-2030 ($ million)
Chart on Saudi Arabia - Year-over-year growth 2025-2030 (%)
Data Table on Saudi Arabia - Year-over-year growth 2025-2030 (%)

12.7.2 UAE - Market size and forecast 2025-2030

Chart on UAE - Market size and forecast 2025-2030 ($ million)
Data Table on UAE - Market size and forecast 2025-2030 ($ million)
Chart on UAE - Year-over-year growth 2025-2030 (%)
Data Table on UAE - Year-over-year growth 2025-2030 (%)

12.7.3 South Africa - Market size and forecast 2025-2030

Chart on South Africa - Market size and forecast 2025-2030 ($ million)
Data Table on South Africa - Market size and forecast 2025-2030 ($ million)
Chart on South Africa - Year-over-year growth 2025-2030 (%)
Data Table on South Africa - Year-over-year growth 2025-2030 (%)

12.7.4 Israel - Market size and forecast 2025-2030

Chart on Israel - Market size and forecast 2025-2030 ($ million)
Data Table on Israel - Market size and forecast 2025-2030 ($ million)
Chart on Israel - Year-over-year growth 2025-2030 (%)
Data Table on Israel - Year-over-year growth 2025-2030 (%)

12.7.5 Turkey - Market size and forecast 2025-2030

Chart on Turkey - Market size and forecast 2025-2030 ($ million)
Data Table on Turkey - Market size and forecast 2025-2030 ($ million)
Chart on Turkey - Year-over-year growth 2025-2030 (%)
Data Table on Turkey - Year-over-year growth 2025-2030 (%)

12.8 Market opportunity by geography

Market opportunity by geography ($ million)
Data Tables on Market opportunity by geography ($ million)

13. Drivers, Challenges, and Opportunity

13.1 Market drivers

Imperative for operational excellence amidst global competition and economic pressures
Proliferation of industry 4.0 and converging enabling technologies
Heightened focus on supply chain resilience and corporate sustainability goals

13.2 Market challenges

Complexity of system integration and data harmonization with legacy infrastructure
Organizational change management and workforce skills gap
Cybersecurity risks and data governance in connected OT environment

13.3 Impact of drivers and challenges

Impact of drivers and challenges in 2025 and 2030

13.4 Market opportunities

Infusion of AI evolving from descriptive to predictive and prescriptive analytics
Ascendancy of cloud-based saas and emergence of hybrid architectures
Hyper-focus on user experience, mobility, and low code or no code platforms

14. Competitive Landscape

14.1 Overview

14.2

Overview on criticality of inputs and factors of differentiation

14.3 Landscape disruption

Overview on factors of disruption

14.4 Industry risks

Impact of key risks on business

15. Competitive Analysis

15.1 Companies profiled

Companies covered

15.2 Company ranking index

15.3 Market positioning of companies

Matrix on companies position and classification

15.4 ABB Ltd.

ABB Ltd. - Overview
ABB Ltd. - Business segments
ABB Ltd. - Key news
ABB Ltd. - Key offerings
ABB Ltd. - Segment focus
SWOT

15.5 Augury Inc.

Augury Inc. - Overview
Augury Inc. - Product / Service
Augury Inc. - Key offerings
SWOT

15.6 eschbach

eschbach - Overview
eschbach - Product / Service
eschbach - Key offerings
SWOT

15.7 Evocon

Evocon - Overview
Evocon - Product / Service
Evocon - Key offerings
SWOT

15.8 FourJaw Manufacturing

FourJaw Manufacturing - Overview
FourJaw Manufacturing - Product / Service
FourJaw Manufacturing - Key offerings
SWOT

15.9 Lighthouse Systems

Lighthouse Systems - Overview
Lighthouse Systems - Product / Service
Lighthouse Systems - Key offerings
SWOT

15.10 Litmus Automation Inc.

Litmus Automation Inc. - Overview
Litmus Automation Inc. - Product / Service
Litmus Automation Inc. - Key offerings
SWOT

15.11 MachineMetrics

MachineMetrics - Overview
MachineMetrics - Product / Service
MachineMetrics - Key offerings
SWOT

15.12 OEEsystems

OEEsystems - Overview
OEEsystems - Product / Service
OEEsystems - Key offerings
SWOT

15.13 Plex Systems Inc.

Plex Systems Inc. - Overview
Plex Systems Inc. - Product / Service
Plex Systems Inc. - Key offerings
SWOT

15.14 Rockwell Automation Inc.

Rockwell Automation Inc. - Overview
Rockwell Automation Inc. - Business segments
Rockwell Automation Inc. - Key news
Rockwell Automation Inc. - Key offerings
Rockwell Automation Inc. - Segment focus
SWOT

15.15 Schneider Electric SE

Schneider Electric SE - Overview
Schneider Electric SE - Business segments
Schneider Electric SE - Key news
Schneider Electric SE - Key offerings
Schneider Electric SE - Segment focus
SWOT

15.16 Siemens AG

Siemens AG - Overview
Siemens AG - Business segments
Siemens AG - Key news
Siemens AG - Key offerings
Siemens AG - Segment focus
SWOT

15.17 Symbium Corp.

Symbium Corp. - Overview
Symbium Corp. - Product / Service
Symbium Corp. - Key offerings
SWOT

15.18 UpKeep Technologies Inc.

UpKeep Technologies Inc. - Overview
UpKeep Technologies Inc. - Product / Service
UpKeep Technologies Inc. - Key offerings
SWOT

16. Appendix

16.1 Scope of the report

Market definition
Objectives
Notes and caveats

16.2 Inclusions and exclusions checklist

Inclusions checklist
Exclusions checklist

16.3 Currency conversion rates for US$

16.4 Research methodology

16.5 Data procurement

Information sources

16.6 Data validation

16.7 Validation techniques employed for market sizing

16.8 Data synthesis

16.9 360 degree market analysis

16.10 List of abbreviations

Research Methodology

Technavio presents a detailed picture of the market by way of study, synthesis, and summation of data from multiple sources. The analysts have presented the various facets of the market with a particular focus on identifying the key industry influencers. The data thus presented is comprehensive, reliable, and the result of extensive research, both primary and secondary.

INFORMATION SOURCES

Primary sources

  • Manufacturers and suppliers
  • Channel partners
  • Industry experts
  • Strategic decision makers

Secondary sources

  • Industry journals and periodicals
  • Government data
  • Financial reports of key industry players
  • Historical data
  • Press releases

DATA ANALYSIS

Data Synthesis

  • Collation of data
  • Estimation of key figures
  • Analysis of derived insights

Data Validation

  • Triangulation with data models
  • Reference against proprietary databases
  • Corroboration with industry experts

REPORT WRITING

Qualitative

  • Market drivers
  • Market challenges
  • Market trends
  • Five forces analysis

Quantitative

  • Market size and forecast
  • Market segmentation
  • Geographical insights
  • Competitive landscape

Interested in this report?

Get your sample now to see our research methodology and insights!

Download Now

Frequently Asked Questions

Overall Equipment Effectiveness Software market growth will increase by USD 53057.6 million during 2026-2030 .

The Overall Equipment Effectiveness Software market is expected to grow at a CAGR of 10.8% during 2026-2030 .

Overall Equipment Effectiveness Software market is segmented by Component (Software, Services) Deployment (Cloud based, On premises) Application (Manufacturing, Automotive, Food and beverage, Pharmaceuticals, Others)

ABB Ltd., Augury Inc., eschbach, Evocon, FourJaw Manufacturing, Lighthouse Systems, Litmus Automation Inc., MachineMetrics, OEEsystems, Plex Systems Inc., Rockwell Automation Inc., Schneider Electric SE, Siemens AG, Symbium Corp., UpKeep Technologies Inc. are a few of the key vendors in the Overall Equipment Effectiveness Software market.

North America will register the highest growth rate of 38.6% among the other regions. Therefore, the Overall Equipment Effectiveness Software market in North America is expected to garner significant business opportunities for the vendors during the forecast period.

US, Canada, Mexico, Germany, France, UK, Italy, Spain, The Netherlands, China, Japan, India, South Korea, Australia, Indonesia, Brazil, Argentina, Chile, Saudi Arabia, UAE, South Africa, Israel, Turkey

  • Imperative for operational excellence amidst global competition and economic pressures is the driving factor this market.

The Overall Equipment Effectiveness Software market vendors should focus on grabbing business opportunities from the Component segment as it accounted for the largest market share in the base year.