Perishable Goods Transportation Market Analysis, Size, and Forecast 2026-2030: North America (US, Canada, and Mexico), Europe (Germany, UK, and France), APAC (China, Japan, and India), South America (Brazil and Argentina), Middle East and Africa (Saudi Arabia, UAE, and South Africa), and Rest of World (ROW)

Perishable Goods Transportation Market Analysis, Size, and Forecast 2026-2030:
North America (US, Canada, and Mexico), Europe (Germany, UK, and France), APAC (China, Japan, and India), South America (Brazil and Argentina), Middle East and Africa (Saudi Arabia, UAE, and South Africa), and Rest of World (ROW)

Published: Mar 2026 302 Pages SKU: IRTNTR73012

Market Overview at a Glance

$10.66 B
Market Opportunity
8.8%
CAGR 2025 - 2030
35.9%
APAC Growth
$7.26 B
MPS segment 2024

Perishable Goods Transportation Market Size 2026-2030

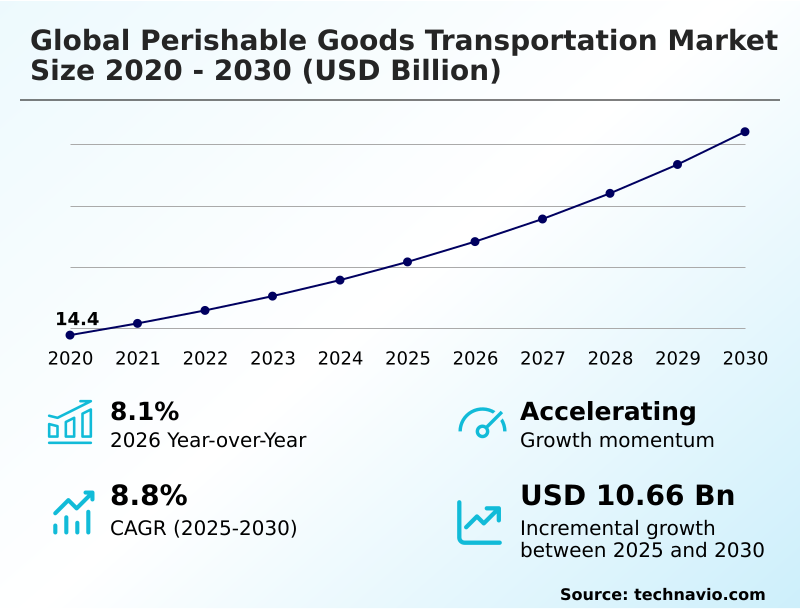
The perishable goods transportation market size is valued to increase by USD 10.66 billion, at a CAGR of 8.8% from 2025 to 2030. Rising global demand for biopharmaceuticals will drive the perishable goods transportation market.

Major Market Trends & Insights

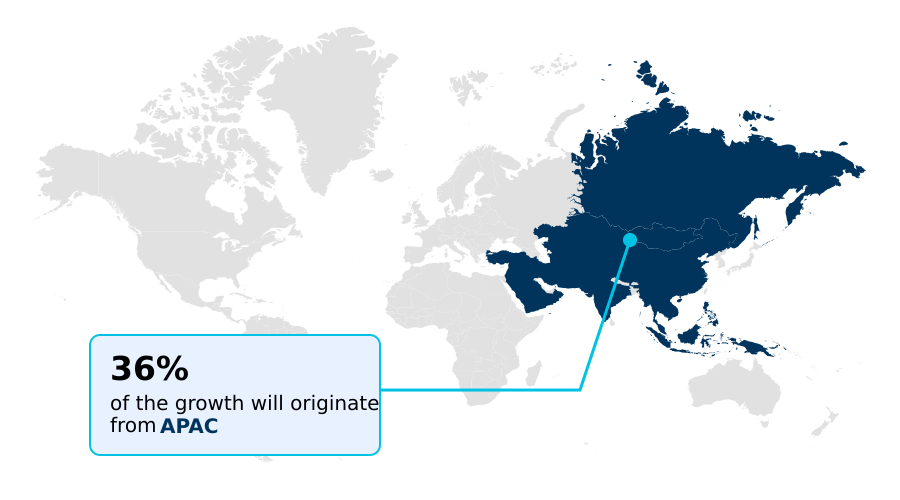
  • APAC dominated the market and accounted for a 35.9% growth during the forecast period.
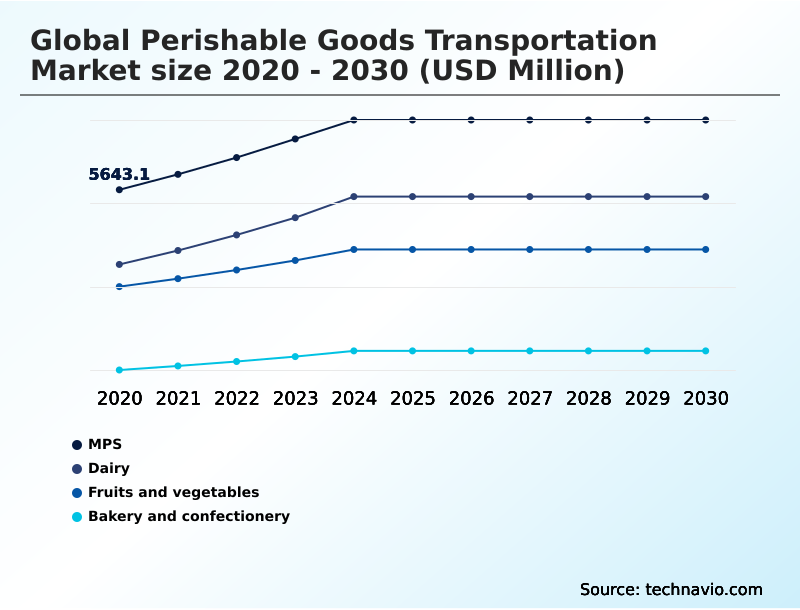
  • By Product - MPS segment was valued at USD 7.26 billion in 2024
  • By Mode of Transportation - Road transportation segment accounted for the largest market revenue share in 2024

Market Size & Forecast

  • Market Opportunities: USD 16.65 billion
  • Market Future Opportunities: USD 10.66 billion
  • CAGR from 2025 to 2030 : 8.8%

Market Summary

  • The perishable goods transportation market is an essential component of global trade, centered on maintaining the integrity of temperature-sensitive products. This sector's growth is driven by the rising consumer demand for fresh foods and the global expansion of the pharmaceutical industry.
  • Success hinges on a sophisticated interplay of technology and logistics, including refrigerated container logistics and advanced cold chain freight management. A key trend involves leveraging IoT integration for real-time temperature monitoring, ensuring an unbroken cold chain from origin to destination.
  • For instance, a pharmaceutical distributor uses active cooling systems and GPS tracking to transport a batch of vaccines across continents, with automated alerts flagging any temperature deviation, thereby preventing millions in product loss.
  • However, the industry grapples with challenges such as high energy consumption and the complexity of multi-modal logistics, pushing operators toward more sustainable practices like adopting cryogenic cooling technology. The need for a verifiable chain of custody, often managed through blockchain for traceability, is becoming a standard requirement, enhancing transparency and trust among stakeholders.

What will be the Size of the Perishable Goods Transportation Market during the forecast period?

Get Key Insights on Market Forecast (PDF) Request Free Sample

How is the Perishable Goods Transportation Market Segmented?

The perishable goods transportation industry research report provides comprehensive data (region-wise segment analysis), with forecasts and estimates in "USD million" for the period 2026-2030, as well as historical data from 2020-2024 for the following segments.

  • Product
    • MPS
    • Dairy
    • Fruits and vegetables
    • Bakery and confectionery
  • Mode of transportation
    • Road transportation
    • Air transportation
    • Others
  • End-user
    • Food and beverages
    • Healthcare and pharma
    • Others
  • Geography
    • North America
      • US
      • Canada
      • Mexico
    • Europe
      • Germany
      • UK
      • France
    • APAC
      • China
      • Japan
      • India
    • South America
      • Brazil
      • Argentina
    • Middle East and Africa
      • Saudi Arabia
      • UAE
      • South Africa
    • Rest of World (ROW)

By Product Insights

The mps segment is estimated to witness significant growth during the forecast period.

The MPS segment, encompassing meat, poultry, and seafood, is critical within the perishable goods transportation market, defined by its stringent cold chain requirements.

These products necessitate precise, uninterrupted temperature-controlled shipping, often at deep-freeze levels down to -25°C, to inhibit microbial growth and preserve quality. The logistics for this sector involve specialized reefer cargo handling and controlled atmosphere technology to prevent degradation during transit.

Efficient cold chain freight management is paramount, with advanced thermal packaging solutions ensuring product integrity. Adherence to strict regulatory standards for phytosanitary inspections is non-negotiable.

Implementing real-time temperature monitoring has been shown to reduce spoilage events by over 20%, ensuring that high-value protein shipments maintain quality from origin to destination, supported by robust cold storage logistics.

Request Free Sample

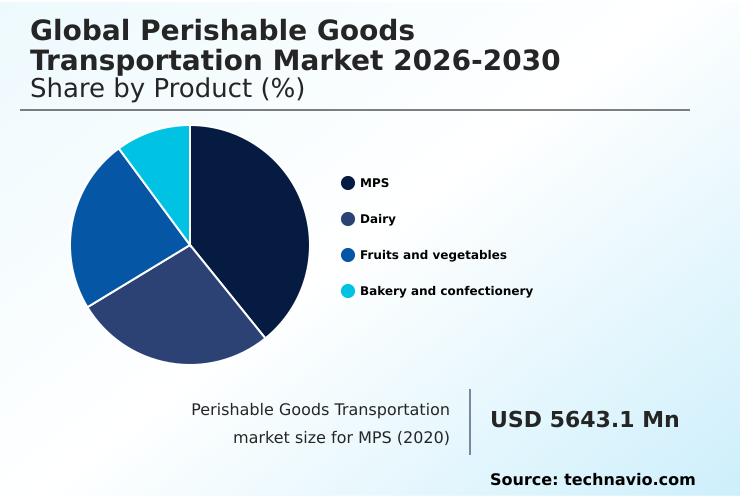
The MPS segment was valued at USD 7.26 billion in 2024 and showed a gradual increase during the forecast period.

Request Free Sample

Regional Analysis

APAC is estimated to contribute 35.9% to the growth of the global market during the forecast period.Technavio’s analysts have elaborately explained the regional trends and drivers that shape the market during the forecast period.

See How Perishable Goods Transportation Market Demand is Rising in APAC Request Free Sample

The geographic landscape of the perishable goods transportation market is characterized by diverse regional dynamics.

The APAC region is experiencing the fastest expansion, accounting for over 35% of the market's incremental growth, fueled by rising disposable incomes and demand for imported goods. This necessitates rapid development in refrigerated port handling and inland temperature-controlled freight brokerage.

In contrast, North America and Europe represent mature markets focused on technological optimization, including advanced cold chain technology and IoT-enabled fleet management to enhance efficiency. These regions see high adoption of electric refrigerated trucks for last-mile delivery.

South America remains a critical export hub, particularly for fresh produce, relying on sophisticated ocean freight logistics to maintain product quality over long distances. The Middle East is investing heavily in cold storage infrastructure to ensure food security.

Market Dynamics

Our researchers analyzed the data with 2025 as the base year, along with the key drivers, trends, and challenges. A holistic analysis of drivers will help companies refine their marketing strategies to gain a competitive advantage.

  • Optimizing the global perishable goods transportation market 2026-2030 requires a multi-faceted approach addressing specific logistical challenges. The comparison between active vs passive cooling systems for perishable transport is central to cost-benefit analyses, as active systems offer precise control for high-value pharmaceuticals while passive solutions suit shorter transits.
  • Sustainable practices in cold chain logistics are becoming a competitive differentiator, moving beyond compliance to meet consumer demand for eco-friendly supply chains. For instance, firms using cryogenic cooling for last-mile delivery report lower carbon footprints than those with conventional diesel units.
  • The role of blockchain in perishable goods traceability is expanding, providing an immutable record that enhances food safety and builds trust. The impact of multi-modal transport on cold chain integrity remains a key focus, as seamless transitions between air, sea, and land are crucial to prevent temperature excursions.
  • Furthermore, best practices for pharmaceutical cold chain management are evolving with the rise of biologics, demanding stricter protocols and advanced monitoring technologies to ensure efficacy and compliance.

What are the key market drivers leading to the rise in the adoption of Perishable Goods Transportation Industry?

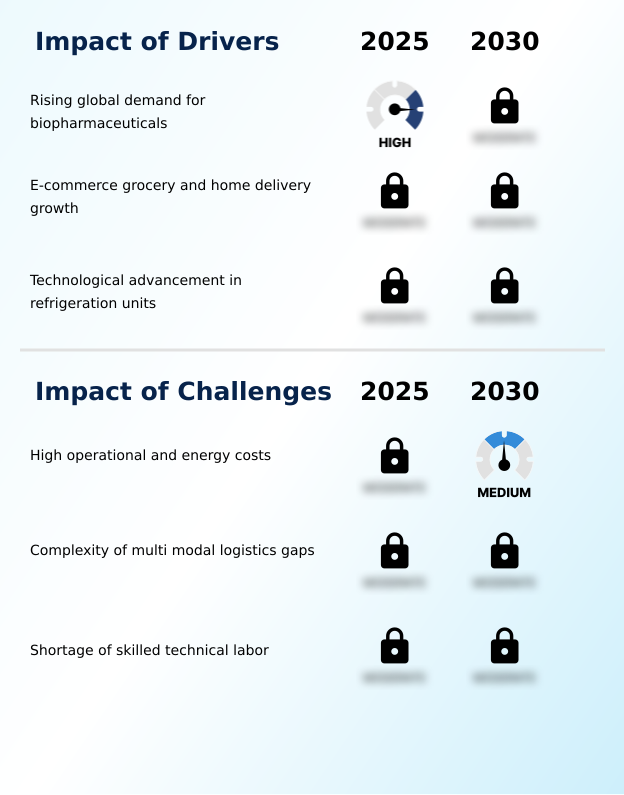
  • The rising global demand for biopharmaceuticals is a key driver propelling growth in the perishable goods transportation market.

  • Market growth is propelled by several key drivers, most notably the expansion of global biopharmaceutical logistics and the boom in e-commerce grocery services.
  • The demand for temperature-controlled shipping for high-value biologics has spurred investment in specialized active cooling systems and thermal packaging. This has led to a 20% year-over-year increase in demand for certified pharma-grade transport.
  • Simultaneously, the rise of online grocery platforms necessitates a robust last-mile delivery network, where electric refrigerated trucks are being deployed to enhance sustainability.
  • Innovations in transport refrigeration units, such as the development of all-electric trailer refrigeration systems, are reducing fuel consumption by as much as 30% for fleet operators.
  • This technological progress in cold chain technology is critical for improving efficiency, reducing operational costs, and meeting evolving consumer and regulatory expectations.

What are the market trends shaping the Perishable Goods Transportation Industry?

  • The integration of advanced IoT sensors across the supply chain is an emerging market trend. This development enhances real-time visibility and integrity for temperature-sensitive products.

  • Key trends are reshaping the perishable goods transportation market, with digitalization and sustainability at the forefront. The widespread adoption of advanced IoT integration is providing unprecedented visibility, as embedded sensors in reefer cargo enable continuous condition monitoring. This technology has been shown to improve on-time, in-full deliveries by up to 12%.
  • Another significant trend is the shift toward sustainable cryogenic cooling technology, which uses natural refrigerants to reduce carbon emissions by over 25% compared to diesel-powered units. The use of blockchain for traceability is also gaining traction, creating an immutable ledger of temperature logs that enhances trust.
  • Furthermore, advancements in controlled atmosphere technology are extending the shelf life of fresh produce, reducing waste and opening new international markets for exporters using reefer containers and specialized maritime logistics.

What challenges does the Perishable Goods Transportation Industry face during its growth?

  • High operational and energy costs present a key challenge affecting the growth and profitability of the industry.

  • The perishable goods transportation market confronts significant operational hurdles, primarily high energy costs and logistical complexities. The expense of powering refrigeration units across a multi-modal logistics network remains a primary concern, with fuel and electricity accounting for a substantial portion of operating budgets, sometimes increasing total trip costs by up to 25% during price spikes.
  • Furthermore, gaps in the cold chain network, especially during transfers between transport modes, create vulnerabilities that can lead to product spoilage. A shortage of skilled labor, particularly technicians versed in modern transport refrigeration units and drivers trained for perishable freight, exacerbates these issues.
  • This scarcity can increase labor costs by 15-20% and leads to longer equipment downtime, impacting service reliability and overall profitability in the temperature-controlled logistics sector.

Exclusive Technavio Analysis on Customer Landscape

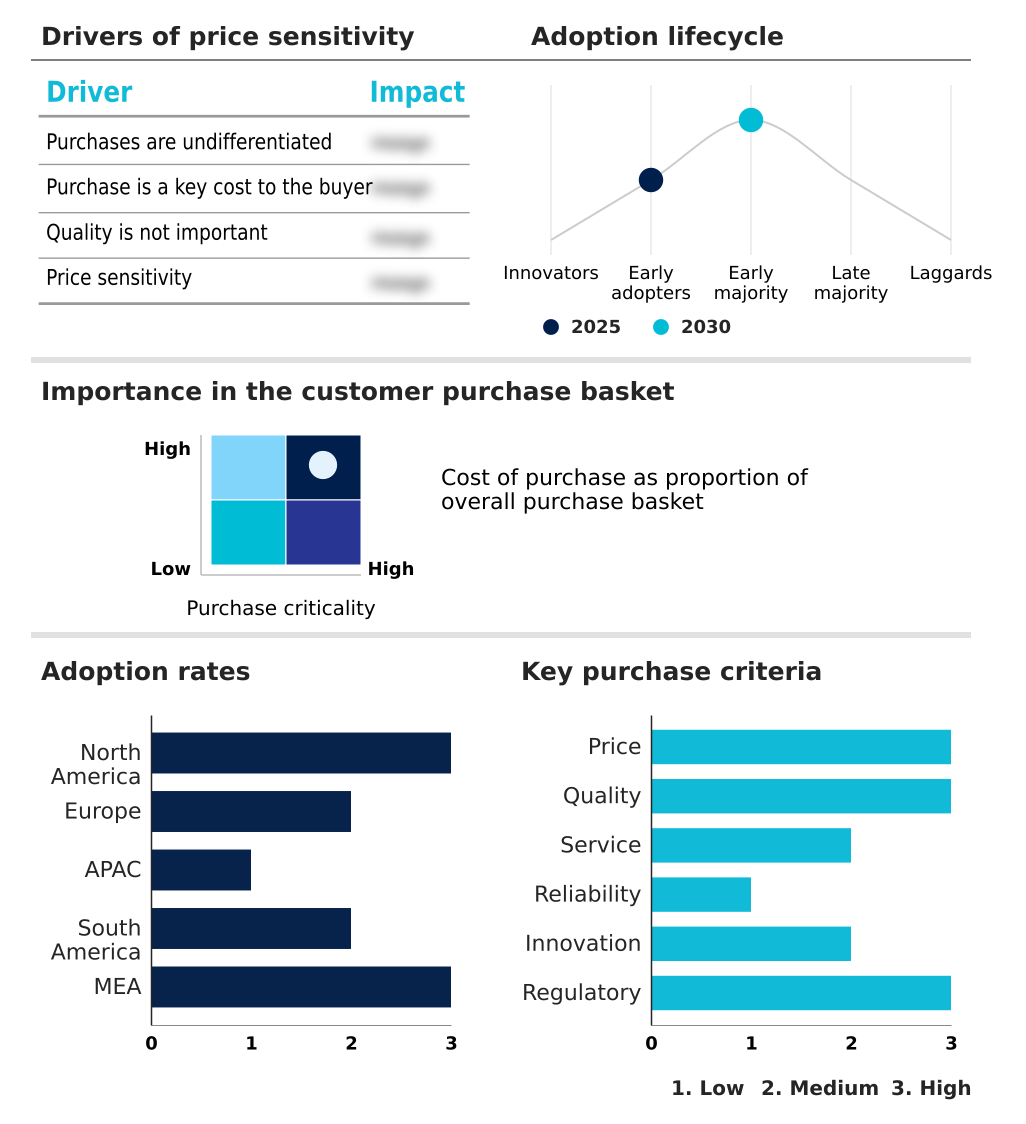
The perishable goods transportation market forecasting report includes the adoption lifecycle of the market, covering from the innovator’s stage to the laggard’s stage. It focuses on adoption rates in different regions based on penetration. Furthermore, the perishable goods transportation market report also includes key purchase criteria and drivers of price sensitivity to help companies evaluate and develop their market growth analysis strategies.

Customer Landscape of Perishable Goods Transportation Industry

Competitive Landscape

Companies are implementing various strategies, such as strategic alliances, perishable goods transportation market forecast, partnerships, mergers and acquisitions, geographical expansion, and product/service launches, to enhance their presence in the industry.

Africa Express Line Ltd. - Offerings include integrated cold chain solutions and temperature-controlled shipping, ensuring verifiable chain of custody for sensitive goods through advanced IoT integration and real-time temperature monitoring.

The industry research and growth report includes detailed analyses of the competitive landscape of the market and information about key companies, including:

  • Africa Express Line Ltd.
  • AP Moller Maersk AS
  • Bay and Bay Transportation
  • C H Robinson Worldwide Inc.
  • CMA CGM Group
  • Columbian Logistics Network
  • COSCO Shipping Ports Ltd.
  • CRST The Transportation Solution
  • DHL International GmbH
  • FST Logistics
  • Hanson Logistics Ltd.
  • Hapag Lloyd AG
  • Hellmann Worldwide Logistics
  • Kuehne Nagel Management AG
  • Mitsui O.S.K. Lines Ltd.
  • Orient Overseas Container Line
  • Schenker AG
  • Swift Cargo Pvt. Ltd.
  • VersaCold Logistics Services
  • Wincanton Plc

Qualitative and quantitative analysis of companies has been conducted to help clients understand the wider business environment as well as the strengths and weaknesses of key industry players. Data is qualitatively analyzed to categorize companies as pure play, category-focused, industry-focused, and diversified; it is quantitatively analyzed to categorize companies as dominant, leading, strong, tentative, and weak.

Recent Development and News in Perishable goods transportation market

  • In August, 2024, Wincanton partnered with a major retailer to deploy autonomous cooling systems in its distribution centers, aiming to enhance energy efficiency and operational autonomy.
  • In October, 2024, Hellmann Worldwide Logistics expanded its specialized healthcare logistics network by opening a new certified facility in South America to support the growing regional pharmaceutical market.
  • In January, 2025, CRST The Transportation Solution expanded its specialized temperature-controlled fleet to better serve the growing demand for pharmaceutical logistics across the Midwest and Eastern seaboard.
  • In May, 2025, Hapag Lloyd implemented a new digital platform that simplifies the booking process for refrigerated shipments, improving booking accuracy and customer experience.

Dive into Technavio’s robust research methodology, blending expert interviews, extensive data synthesis, and validated models for unparalleled Perishable Goods Transportation Market insights. See full methodology.

Market Scope
Page number 302
Base year 2025
Historic period 2020-2024
Forecast period 2026-2030
Growth momentum & CAGR Accelerate at a CAGR of 8.8%
Market growth 2026-2030 USD 10657.1 million
Market structure Fragmented
YoY growth 2025-2026(%) 8.1%
Key countries US, Canada, Mexico, Germany, UK, France, Italy, Spain, The Netherlands, China, Japan, India, South Korea, Australia, Indonesia, Brazil, Argentina, Chile, Saudi Arabia, UAE, South Africa, Turkey and Israel
Competitive landscape Leading Companies, Market Positioning of Companies, Competitive Strategies, and Industry Risks

Request Free Sample

Research Analyst Overview

  • The perishable goods transportation market is advancing through the integration of sophisticated technologies to ensure product integrity across complex supply chains. A core focus is on maintaining a verifiable chain of custody using solutions like blockchain for traceability, which is becoming a boardroom-level priority for mitigating risk and ensuring compliance.
  • The industry relies on specialized infrastructure, including refrigerated warehousing and advanced transport refrigeration units with capabilities such as variable speed compressors. The adoption of smart logistics platforms enables real-time temperature monitoring and predictive maintenance, crucial for high-value shipments in biopharmaceutical logistics. Key components such as active cooling systems and thermal management solutions are essential for this.
  • Operators are leveraging multi-temperature refrigerated trailers for operational efficiency, with some achieving a 15% improvement in asset utilization. This technological shift, coupled with a focus on sustainable cryogenic cooling and efficient last-mile delivery networks, defines the competitive landscape.
  • The market's evolution is driven by the need for precise temperature-controlled freight brokerage and robust cold chain technology to meet stringent regulatory demands.

What are the Key Data Covered in this Perishable Goods Transportation Market Research and Growth Report?

  • What is the expected growth of the Perishable Goods Transportation Market between 2026 and 2030?

    • USD 10.66 billion, at a CAGR of 8.8%

  • What segmentation does the market report cover?

    • The report is segmented by Product (MPS, Dairy, Fruits and vegetables, and Bakery and confectionery), Mode of Transportation (Road transportation, Air transportation, and Others), End-user (Food and beverages, Healthcare and pharma, and Others) and Geography (North America, Europe, APAC, South America, Middle East and Africa)

  • Which regions are analyzed in the report?

    • North America, Europe, APAC, South America and Middle East and Africa

  • What are the key growth drivers and market challenges?

    • Rising global demand for biopharmaceuticals, High operational and energy costs

  • Who are the major players in the Perishable Goods Transportation Market?

    • Africa Express Line Ltd., AP Moller Maersk AS, Bay and Bay Transportation, C H Robinson Worldwide Inc., CMA CGM Group, Columbian Logistics Network, COSCO Shipping Ports Ltd., CRST The Transportation Solution, DHL International GmbH, FST Logistics, Hanson Logistics Ltd., Hapag Lloyd AG, Hellmann Worldwide Logistics, Kuehne Nagel Management AG, Mitsui O.S.K. Lines Ltd., Orient Overseas Container Line, Schenker AG, Swift Cargo Pvt. Ltd., VersaCold Logistics Services and Wincanton Plc

Market Research Insights

  • The dynamics of the perishable goods transportation market are shaped by a push for greater efficiency and sustainability. Adoption of variable speed compressors has improved energy efficiency in transport refrigeration units by up to 30%, a significant cost-saving measure for operators.
  • Meanwhile, the implementation of sustainable cryogenic cooling technologies is growing, with some fleets reporting a 25% reduction in carbon emissions. This shift is reinforced by the adoption of multi-temperature refrigerated trailers, which enhance asset utilization by over 15% by allowing mixed cargo loads. These advancements address both economic pressures and environmental mandates, positioning technologically advanced providers for greater market share.
  • The focus remains on optimizing the entire cold chain network, from refrigerated warehousing to final delivery.

We can help! Our analysts can customize this perishable goods transportation market research report to meet your requirements.

Get in touch

1. Executive Summary

1.1 Market overview

Executive Summary - Chart on Market Overview
Executive Summary - Data Table on Market Overview
Executive Summary - Chart on Global Market Characteristics
Executive Summary - Chart on Market by Geography
Executive Summary - Chart on Market Segmentation by Product
Executive Summary - Chart on Market Segmentation by Mode of Transportation
Executive Summary - Chart on Market Segmentation by End-user
Executive Summary - Chart on Incremental Growth
Executive Summary - Data Table on Incremental Growth
Executive Summary - Chart on Company Market Positioning

2. Technavio Analysis

2.1 Analysis of price sensitivity, lifecycle, customer purchase basket, adoption rates, and purchase criteria

2.2 Criticality of inputs and Factors of differentiation

Chart on Overview on criticality of inputs and factors of differentiation

2.3 Factors of disruption

Chart on Overview on factors of disruption

2.4 Impact of drivers and challenges

Chart on Impact of drivers and challenges in 2025 and 2030

3. Market Landscape

3.1 Market ecosystem

Chart on Parent Market
Data Table on - Parent Market

3.2 Market characteristics

Chart on Market characteristics analysis

3.3 Value chain analysis

Chart on Value chain analysis

4. Market Sizing

4.1 Market definition

Data Table on Offerings of companies included in the market definition

4.2 Market segment analysis

Market segments

4.3 Market size 2025

4.4 Market outlook: Forecast for 2025-2030

Chart on Global - Market size and forecast 2025-2030 ($ million)
Data Table on Global - Market size and forecast 2025-2030 ($ million)
Chart on Global Market: Year-over-year growth 2025-2030 (%)
Data Table on Global Market: Year-over-year growth 2025-2030 (%)

5. Historic Market Size

5.1 Global Perishable Goods Transportation Market 2020 - 2024

Historic Market Size - Data Table on Global Perishable Goods Transportation Market 2020 - 2024 ($ million)

5.2 Product segment analysis 2020 - 2024

Historic Market Size - Product Segment 2020 - 2024 ($ million)

5.3 Mode of Transportation segment analysis 2020 - 2024

Historic Market Size - Mode of Transportation Segment 2020 - 2024 ($ million)

5.4 End-user segment analysis 2020 - 2024

Historic Market Size - End-user Segment 2020 - 2024 ($ million)

5.5 Geography segment analysis 2020 - 2024

Historic Market Size - Geography Segment 2020 - 2024 ($ million)

5.6 Country segment analysis 2020 - 2024

Historic Market Size - Country Segment 2020 - 2024 ($ million)

6. Qualitative Analysis

6.1 Impact of AI on Global Perishable Goods Transportation Market

7. Five Forces Analysis

7.1 Five forces summary

Five forces analysis - Comparison between 2025 and 2030

7.2 Bargaining power of buyers

Bargaining power of buyers - Impact of key factors 2025 and 2030

7.3 Bargaining power of suppliers

Bargaining power of suppliers - Impact of key factors in 2025 and 2030

7.4 Threat of new entrants

Threat of new entrants - Impact of key factors in 2025 and 2030

7.5 Threat of substitutes

Threat of substitutes - Impact of key factors in 2025 and 2030

7.6 Threat of rivalry

Threat of rivalry - Impact of key factors in 2025 and 2030

7.7 Market condition

Chart on Market condition - Five forces 2025 and 2030

8. Market Segmentation by Product

8.1 Market segments

Chart on Product - Market share 2025-2030 (%)
Data Table on Product - Market share 2025-2030 (%)

8.2 Comparison by Product

Chart on Comparison by Product
Data Table on Comparison by Product

8.3 MPS - Market size and forecast 2025-2030

Chart on MPS - Market size and forecast 2025-2030 ($ million)
Data Table on MPS - Market size and forecast 2025-2030 ($ million)
Chart on MPS - Year-over-year growth 2025-2030 (%)
Data Table on MPS - Year-over-year growth 2025-2030 (%)

8.4 Dairy - Market size and forecast 2025-2030

Chart on Dairy - Market size and forecast 2025-2030 ($ million)
Data Table on Dairy - Market size and forecast 2025-2030 ($ million)
Chart on Dairy - Year-over-year growth 2025-2030 (%)
Data Table on Dairy - Year-over-year growth 2025-2030 (%)

8.5 Fruits and vegetables - Market size and forecast 2025-2030

Chart on Fruits and vegetables - Market size and forecast 2025-2030 ($ million)
Data Table on Fruits and vegetables - Market size and forecast 2025-2030 ($ million)
Chart on Fruits and vegetables - Year-over-year growth 2025-2030 (%)
Data Table on Fruits and vegetables - Year-over-year growth 2025-2030 (%)

8.6 Bakery and confectionery - Market size and forecast 2025-2030

Chart on Bakery and confectionery - Market size and forecast 2025-2030 ($ million)
Data Table on Bakery and confectionery - Market size and forecast 2025-2030 ($ million)
Chart on Bakery and confectionery - Year-over-year growth 2025-2030 (%)
Data Table on Bakery and confectionery - Year-over-year growth 2025-2030 (%)

8.7 Market opportunity by Product

Market opportunity by Product ($ million)
Data Table on Market opportunity by Product ($ million)

9. Market Segmentation by Mode of Transportation

9.1 Market segments

Chart on Mode of Transportation - Market share 2025-2030 (%)
Data Table on Mode of Transportation - Market share 2025-2030 (%)

9.2 Comparison by Mode of Transportation

Chart on Comparison by Mode of Transportation
Data Table on Comparison by Mode of Transportation

9.3 Road transportation - Market size and forecast 2025-2030

Chart on Road transportation - Market size and forecast 2025-2030 ($ million)
Data Table on Road transportation - Market size and forecast 2025-2030 ($ million)
Chart on Road transportation - Year-over-year growth 2025-2030 (%)
Data Table on Road transportation - Year-over-year growth 2025-2030 (%)

9.4 Air transportation - Market size and forecast 2025-2030

Chart on Air transportation - Market size and forecast 2025-2030 ($ million)
Data Table on Air transportation - Market size and forecast 2025-2030 ($ million)
Chart on Air transportation - Year-over-year growth 2025-2030 (%)
Data Table on Air transportation - Year-over-year growth 2025-2030 (%)

9.5 Others - Market size and forecast 2025-2030

Chart on Others - Market size and forecast 2025-2030 ($ million)
Data Table on Others - Market size and forecast 2025-2030 ($ million)
Chart on Others - Year-over-year growth 2025-2030 (%)
Data Table on Others - Year-over-year growth 2025-2030 (%)

9.6 Market opportunity by Mode of Transportation

Market opportunity by Mode of Transportation ($ million)
Data Table on Market opportunity by Mode of Transportation ($ million)

10. Market Segmentation by End-user

10.1 Market segments

Chart on End-user - Market share 2025-2030 (%)
Data Table on End-user - Market share 2025-2030 (%)

10.2 Comparison by End-user

Chart on Comparison by End-user
Data Table on Comparison by End-user

10.3 Food and beverages - Market size and forecast 2025-2030

Chart on Food and beverages - Market size and forecast 2025-2030 ($ million)
Data Table on Food and beverages - Market size and forecast 2025-2030 ($ million)
Chart on Food and beverages - Year-over-year growth 2025-2030 (%)
Data Table on Food and beverages - Year-over-year growth 2025-2030 (%)

10.4 Healthcare and pharma - Market size and forecast 2025-2030

Chart on Healthcare and pharma - Market size and forecast 2025-2030 ($ million)
Data Table on Healthcare and pharma - Market size and forecast 2025-2030 ($ million)
Chart on Healthcare and pharma - Year-over-year growth 2025-2030 (%)
Data Table on Healthcare and pharma - Year-over-year growth 2025-2030 (%)

10.5 Others - Market size and forecast 2025-2030

Chart on Others - Market size and forecast 2025-2030 ($ million)
Data Table on Others - Market size and forecast 2025-2030 ($ million)
Chart on Others - Year-over-year growth 2025-2030 (%)
Data Table on Others - Year-over-year growth 2025-2030 (%)

10.6 Market opportunity by End-user

Market opportunity by End-user ($ million)
Data Table on Market opportunity by End-user ($ million)

11. Customer Landscape

11.1 Customer landscape overview

Analysis of price sensitivity, lifecycle, customer purchase basket, adoption rates, and purchase criteria

12. Geographic Landscape

12.1 Geographic segmentation

Chart on Market share by geography 2025-2030 (%)
Data Table on Market share by geography 2025-2030 (%)

12.2 Geographic comparison

Chart on Geographic comparison
Data Table on Geographic comparison

12.3 North America - Market size and forecast 2025-2030

Chart on North America - Market size and forecast 2025-2030 ($ million)
Data Table on North America - Market size and forecast 2025-2030 ($ million)
Chart on North America - Year-over-year growth 2025-2030 (%)
Data Table on North America - Year-over-year growth 2025-2030 (%)
Chart on Regional Comparison - North America
Data Table on Regional Comparison - North America

12.3.1 US - Market size and forecast 2025-2030

Chart on US - Market size and forecast 2025-2030 ($ million)
Data Table on US - Market size and forecast 2025-2030 ($ million)
Chart on US - Year-over-year growth 2025-2030 (%)
Data Table on US - Year-over-year growth 2025-2030 (%)

12.3.2 Canada - Market size and forecast 2025-2030

Chart on Canada - Market size and forecast 2025-2030 ($ million)
Data Table on Canada - Market size and forecast 2025-2030 ($ million)
Chart on Canada - Year-over-year growth 2025-2030 (%)
Data Table on Canada - Year-over-year growth 2025-2030 (%)

12.3.3 Mexico - Market size and forecast 2025-2030

Chart on Mexico - Market size and forecast 2025-2030 ($ million)
Data Table on Mexico - Market size and forecast 2025-2030 ($ million)
Chart on Mexico - Year-over-year growth 2025-2030 (%)
Data Table on Mexico - Year-over-year growth 2025-2030 (%)

12.4 Europe - Market size and forecast 2025-2030

Chart on Europe - Market size and forecast 2025-2030 ($ million)
Data Table on Europe - Market size and forecast 2025-2030 ($ million)
Chart on Europe - Year-over-year growth 2025-2030 (%)
Data Table on Europe - Year-over-year growth 2025-2030 (%)
Chart on Regional Comparison - Europe
Data Table on Regional Comparison - Europe

12.4.1 Germany - Market size and forecast 2025-2030

Chart on Germany - Market size and forecast 2025-2030 ($ million)
Data Table on Germany - Market size and forecast 2025-2030 ($ million)
Chart on Germany - Year-over-year growth 2025-2030 (%)
Data Table on Germany - Year-over-year growth 2025-2030 (%)

12.4.2 UK - Market size and forecast 2025-2030

Chart on UK - Market size and forecast 2025-2030 ($ million)
Data Table on UK - Market size and forecast 2025-2030 ($ million)
Chart on UK - Year-over-year growth 2025-2030 (%)
Data Table on UK - Year-over-year growth 2025-2030 (%)

12.4.3 France - Market size and forecast 2025-2030

Chart on France - Market size and forecast 2025-2030 ($ million)
Data Table on France - Market size and forecast 2025-2030 ($ million)
Chart on France - Year-over-year growth 2025-2030 (%)
Data Table on France - Year-over-year growth 2025-2030 (%)

12.4.4 Italy - Market size and forecast 2025-2030

Chart on Italy - Market size and forecast 2025-2030 ($ million)
Data Table on Italy - Market size and forecast 2025-2030 ($ million)
Chart on Italy - Year-over-year growth 2025-2030 (%)
Data Table on Italy - Year-over-year growth 2025-2030 (%)

12.4.5 Spain - Market size and forecast 2025-2030

Chart on Spain - Market size and forecast 2025-2030 ($ million)
Data Table on Spain - Market size and forecast 2025-2030 ($ million)
Chart on Spain - Year-over-year growth 2025-2030 (%)
Data Table on Spain - Year-over-year growth 2025-2030 (%)

12.4.6 The Netherlands - Market size and forecast 2025-2030

Chart on The Netherlands - Market size and forecast 2025-2030 ($ million)
Data Table on The Netherlands - Market size and forecast 2025-2030 ($ million)
Chart on The Netherlands - Year-over-year growth 2025-2030 (%)
Data Table on The Netherlands - Year-over-year growth 2025-2030 (%)

12.5 APAC - Market size and forecast 2025-2030

Chart on APAC - Market size and forecast 2025-2030 ($ million)
Data Table on APAC - Market size and forecast 2025-2030 ($ million)
Chart on APAC - Year-over-year growth 2025-2030 (%)
Data Table on APAC - Year-over-year growth 2025-2030 (%)
Chart on Regional Comparison - APAC
Data Table on Regional Comparison - APAC

12.5.1 China - Market size and forecast 2025-2030

Chart on China - Market size and forecast 2025-2030 ($ million)
Data Table on China - Market size and forecast 2025-2030 ($ million)
Chart on China - Year-over-year growth 2025-2030 (%)
Data Table on China - Year-over-year growth 2025-2030 (%)

12.5.2 Japan - Market size and forecast 2025-2030

Chart on Japan - Market size and forecast 2025-2030 ($ million)
Data Table on Japan - Market size and forecast 2025-2030 ($ million)
Chart on Japan - Year-over-year growth 2025-2030 (%)
Data Table on Japan - Year-over-year growth 2025-2030 (%)

12.5.3 India - Market size and forecast 2025-2030

Chart on India - Market size and forecast 2025-2030 ($ million)
Data Table on India - Market size and forecast 2025-2030 ($ million)
Chart on India - Year-over-year growth 2025-2030 (%)
Data Table on India - Year-over-year growth 2025-2030 (%)

12.5.4 South Korea - Market size and forecast 2025-2030

Chart on South Korea - Market size and forecast 2025-2030 ($ million)
Data Table on South Korea - Market size and forecast 2025-2030 ($ million)
Chart on South Korea - Year-over-year growth 2025-2030 (%)
Data Table on South Korea - Year-over-year growth 2025-2030 (%)

12.5.5 Australia - Market size and forecast 2025-2030

Chart on Australia - Market size and forecast 2025-2030 ($ million)
Data Table on Australia - Market size and forecast 2025-2030 ($ million)
Chart on Australia - Year-over-year growth 2025-2030 (%)
Data Table on Australia - Year-over-year growth 2025-2030 (%)

12.5.6 Indonesia - Market size and forecast 2025-2030

Chart on Indonesia - Market size and forecast 2025-2030 ($ million)
Data Table on Indonesia - Market size and forecast 2025-2030 ($ million)
Chart on Indonesia - Year-over-year growth 2025-2030 (%)
Data Table on Indonesia - Year-over-year growth 2025-2030 (%)

12.6 South America - Market size and forecast 2025-2030

Chart on South America - Market size and forecast 2025-2030 ($ million)
Data Table on South America - Market size and forecast 2025-2030 ($ million)
Chart on South America - Year-over-year growth 2025-2030 (%)
Data Table on South America - Year-over-year growth 2025-2030 (%)
Chart on Regional Comparison - South America
Data Table on Regional Comparison - South America

12.6.1 Brazil - Market size and forecast 2025-2030

Chart on Brazil - Market size and forecast 2025-2030 ($ million)
Data Table on Brazil - Market size and forecast 2025-2030 ($ million)
Chart on Brazil - Year-over-year growth 2025-2030 (%)
Data Table on Brazil - Year-over-year growth 2025-2030 (%)

12.6.2 Argentina - Market size and forecast 2025-2030

Chart on Argentina - Market size and forecast 2025-2030 ($ million)
Data Table on Argentina - Market size and forecast 2025-2030 ($ million)
Chart on Argentina - Year-over-year growth 2025-2030 (%)
Data Table on Argentina - Year-over-year growth 2025-2030 (%)

12.6.3 Chile - Market size and forecast 2025-2030

Chart on Chile - Market size and forecast 2025-2030 ($ million)
Data Table on Chile - Market size and forecast 2025-2030 ($ million)
Chart on Chile - Year-over-year growth 2025-2030 (%)
Data Table on Chile - Year-over-year growth 2025-2030 (%)

12.7 Middle East and Africa - Market size and forecast 2025-2030

Chart on Middle East and Africa - Market size and forecast 2025-2030 ($ million)
Data Table on Middle East and Africa - Market size and forecast 2025-2030 ($ million)
Chart on Middle East and Africa - Year-over-year growth 2025-2030 (%)
Data Table on Middle East and Africa - Year-over-year growth 2025-2030 (%)
Chart on Regional Comparison - Middle East and Africa
Data Table on Regional Comparison - Middle East and Africa

12.7.1 Saudi Arabia - Market size and forecast 2025-2030

Chart on Saudi Arabia - Market size and forecast 2025-2030 ($ million)
Data Table on Saudi Arabia - Market size and forecast 2025-2030 ($ million)
Chart on Saudi Arabia - Year-over-year growth 2025-2030 (%)
Data Table on Saudi Arabia - Year-over-year growth 2025-2030 (%)

12.7.2 UAE - Market size and forecast 2025-2030

Chart on UAE - Market size and forecast 2025-2030 ($ million)
Data Table on UAE - Market size and forecast 2025-2030 ($ million)
Chart on UAE - Year-over-year growth 2025-2030 (%)
Data Table on UAE - Year-over-year growth 2025-2030 (%)

12.7.3 South Africa - Market size and forecast 2025-2030

Chart on South Africa - Market size and forecast 2025-2030 ($ million)
Data Table on South Africa - Market size and forecast 2025-2030 ($ million)
Chart on South Africa - Year-over-year growth 2025-2030 (%)
Data Table on South Africa - Year-over-year growth 2025-2030 (%)

12.7.4 Turkey - Market size and forecast 2025-2030

Chart on Turkey - Market size and forecast 2025-2030 ($ million)
Data Table on Turkey - Market size and forecast 2025-2030 ($ million)
Chart on Turkey - Year-over-year growth 2025-2030 (%)
Data Table on Turkey - Year-over-year growth 2025-2030 (%)

12.7.5 Israel - Market size and forecast 2025-2030

Chart on Israel - Market size and forecast 2025-2030 ($ million)
Data Table on Israel - Market size and forecast 2025-2030 ($ million)
Chart on Israel - Year-over-year growth 2025-2030 (%)
Data Table on Israel - Year-over-year growth 2025-2030 (%)

12.8 Market opportunity by geography

Market opportunity by geography ($ million)
Data Tables on Market opportunity by geography ($ million)

13. Drivers, Challenges, and Opportunity

13.1 Market drivers

Rising global demand for biopharmaceuticals
E-commerce grocery and home delivery growth
Technological advancement in refrigeration units

13.2 Market challenges

High operational and energy costs
Complexity of multi modal logistics gaps
Shortage of skilled technical labor

13.3 Impact of drivers and challenges

Impact of drivers and challenges in 2025 and 2030

13.4 Market opportunities

Advanced IOT integration across supply chain
Sustainable cryogenic cooling technology adoption
Blockchain for transparent documentation flow

14. Competitive Landscape

14.1 Overview

14.2

Overview on criticality of inputs and factors of differentiation

14.3 Landscape disruption

Overview on factors of disruption

14.4 Industry risks

Impact of key risks on business

15. Competitive Analysis

15.1 Companies profiled

Companies covered

15.2 Company ranking index

15.3 Market positioning of companies

Matrix on companies position and classification

15.4 AP Moller Maersk AS

AP Moller Maersk AS - Overview
AP Moller Maersk AS - Business segments
AP Moller Maersk AS - Key news
AP Moller Maersk AS - Key offerings
AP Moller Maersk AS - Segment focus
SWOT

15.5 Bay and Bay Transportation

Bay and Bay Transportation - Overview
Bay and Bay Transportation - Product / Service
Bay and Bay Transportation - Key offerings
SWOT

15.6 C H Robinson Worldwide Inc.

C H Robinson Worldwide Inc. - Overview
C H Robinson Worldwide Inc. - Product / Service
C H Robinson Worldwide Inc. - Key news
C H Robinson Worldwide Inc. - Key offerings
SWOT

15.7 CMA CGM Group

CMA CGM Group - Overview
CMA CGM Group - Product / Service
CMA CGM Group - Key news
CMA CGM Group - Key offerings
SWOT

15.8 COSCO Shipping Ports Ltd.

COSCO Shipping Ports Ltd. - Overview
COSCO Shipping Ports Ltd. - Business segments
COSCO Shipping Ports Ltd. - Key offerings
COSCO Shipping Ports Ltd. - Segment focus
SWOT

15.9 CRST The Transportation Solution

CRST The Transportation Solution - Overview
CRST The Transportation Solution - Product / Service
CRST The Transportation Solution - Key offerings
SWOT

15.10 DHL International GmbH

DHL International GmbH - Overview
DHL International GmbH - Business segments
DHL International GmbH - Key news
DHL International GmbH - Key offerings
DHL International GmbH - Segment focus
SWOT

15.11 FST Logistics

FST Logistics - Overview
FST Logistics - Product / Service
FST Logistics - Key offerings
SWOT

15.12 Hapag Lloyd AG

Hapag Lloyd AG - Overview
Hapag Lloyd AG - Product / Service
Hapag Lloyd AG - Key offerings
SWOT

15.13 Hellmann Worldwide Logistics

Hellmann Worldwide Logistics - Overview
Hellmann Worldwide Logistics - Product / Service
Hellmann Worldwide Logistics - Key offerings
SWOT

15.14 Kuehne Nagel Management AG

Kuehne Nagel Management AG - Overview
Kuehne Nagel Management AG - Business segments
Kuehne Nagel Management AG - Key news
Kuehne Nagel Management AG - Key offerings
Kuehne Nagel Management AG - Segment focus
SWOT

15.15 Mitsui O.S.K. Lines Ltd.

Mitsui O.S.K. Lines Ltd. - Overview
Mitsui O.S.K. Lines Ltd. - Business segments
Mitsui O.S.K. Lines Ltd. - Key offerings
Mitsui O.S.K. Lines Ltd. - Segment focus
SWOT

15.16 Orient Overseas Container Line

Orient Overseas Container Line - Overview
Orient Overseas Container Line - Product / Service
Orient Overseas Container Line - Key offerings
SWOT

15.17 Schenker AG

Schenker AG - Overview
Schenker AG - Product / Service
Schenker AG - Key offerings
SWOT

15.18 Wincanton Plc

Wincanton Plc - Overview
Wincanton Plc - Business segments
Wincanton Plc - Key offerings
Wincanton Plc - Segment focus
SWOT

16. Appendix

16.1 Scope of the report

Market definition
Objectives
Notes and caveats

16.2 Inclusions and exclusions checklist

Inclusions checklist
Exclusions checklist

16.3 Currency conversion rates for US$

16.4 Research methodology

16.5 Data procurement

Information sources

16.6 Data validation

16.7 Validation techniques employed for market sizing

16.8 Data synthesis

16.9 360 degree market analysis

16.10 List of abbreviations

Research Methodology

Technavio presents a detailed picture of the market by way of study, synthesis, and summation of data from multiple sources. The analysts have presented the various facets of the market with a particular focus on identifying the key industry influencers. The data thus presented is comprehensive, reliable, and the result of extensive research, both primary and secondary.

INFORMATION SOURCES

Primary sources

  • Manufacturers and suppliers
  • Channel partners
  • Industry experts
  • Strategic decision makers

Secondary sources

  • Industry journals and periodicals
  • Government data
  • Financial reports of key industry players
  • Historical data
  • Press releases

DATA ANALYSIS

Data Synthesis

  • Collation of data
  • Estimation of key figures
  • Analysis of derived insights

Data Validation

  • Triangulation with data models
  • Reference against proprietary databases
  • Corroboration with industry experts

REPORT WRITING

Qualitative

  • Market drivers
  • Market challenges
  • Market trends
  • Five forces analysis

Quantitative

  • Market size and forecast
  • Market segmentation
  • Geographical insights
  • Competitive landscape

Interested in this report?

Get your sample now to see our research methodology and insights!

Download Now

Frequently Asked Questions

Perishable Goods Transportation market growth will increase by USD 10657.1 million during 2026-2030.

The Perishable Goods Transportation market is expected to grow at a CAGR of 8.8% during 2026-2030.

Perishable Goods Transportation market is segmented by Product (MPS, Dairy, Fruits and vegetables, Bakery and confectionery) Mode of transportation (Road transportation, Air transportation, Others) End-user (Food and beverages, Healthcare and pharma, Others)

Africa Express Line Ltd., AP Moller Maersk AS, Bay and Bay Transportation, C H Robinson Worldwide Inc., CMA CGM Group, Columbian Logistics Network, COSCO Shipping Ports Ltd., CRST The Transportation Solution, DHL International GmbH, FST Logistics, Hanson Logistics Ltd., Hapag Lloyd AG, Hellmann Worldwide Logistics, Kuehne Nagel Management AG, Mitsui O.S.K. Lines Ltd., Orient Overseas Container Line, Schenker AG, Swift Cargo Pvt. Ltd., VersaCold Logistics Services, Wincanton Plc are a few of the key vendors in the Perishable Goods Transportation market.

APAC will register the highest growth rate of 35.9% among the other regions. Therefore, the Perishable Goods Transportation market in APAC is expected to garner significant business opportunities for the vendors during the forecast period.

US, Canada, Mexico, Germany, UK, France, Italy, Spain, The Netherlands, China, Japan, India, South Korea, Australia, Indonesia, Brazil, Argentina, Chile, Saudi Arabia, UAE, South Africa, Turkey, Israel

  • Rising global demand for biopharmaceuticals is the driving factor this market.

The Perishable Goods Transportation market vendors should focus on grabbing business opportunities from the Product segment as it accounted for the largest market share in the base year.
RIA - Research AI Assistant
Ask RIA