Personal AI Assistant Market Analysis, Size, and Forecast 2026-2030: North America (US, Canada, and Mexico), APAC (China, Japan, and India), Europe (Germany, UK, and France), Middle East and Africa (Saudi Arabia, UAE, and South Africa), South America (Brazil and Argentina), and Rest of World (ROW)

Personal AI Assistant Market Analysis, Size, and Forecast 2026-2030:
North America (US, Canada, and Mexico), APAC (China, Japan, and India), Europe (Germany, UK, and France), Middle East and Africa (Saudi Arabia, UAE, and South Africa), South America (Brazil and Argentina), and Rest of World (ROW)

Published: Apr 2026 299 Pages SKU: IRTNTR80704

Market Overview at a Glance

$12.36 B
Market Opportunity
34.8%
CAGR 2025 - 2030
40.6%
North America Growth
$1.89 B
Chatbot segment 2024

Personal AI Assistant Market Size 2026-2030

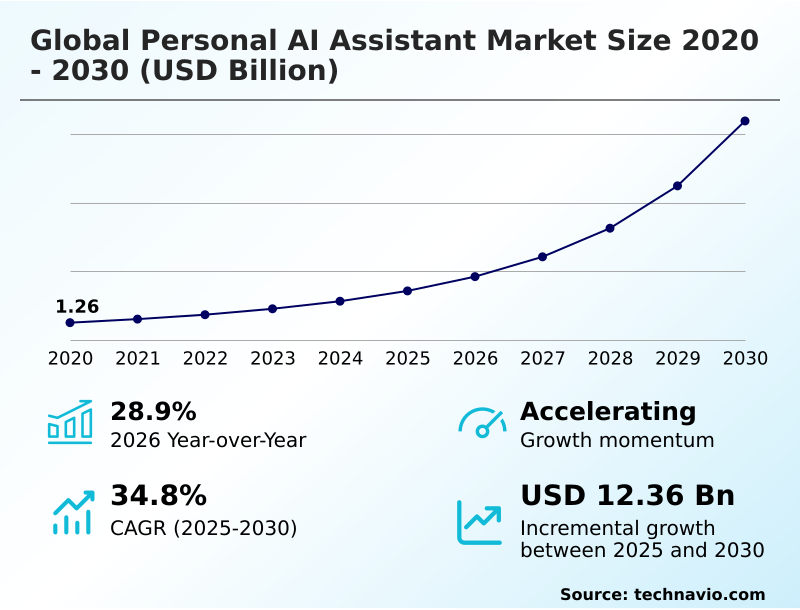
The personal ai assistant market size is valued to increase by USD 12.36 billion, at a CAGR of 34.8% from 2025 to 2030. Proliferation of multimodal large language models will drive the personal ai assistant market.

Major Market Trends & Insights

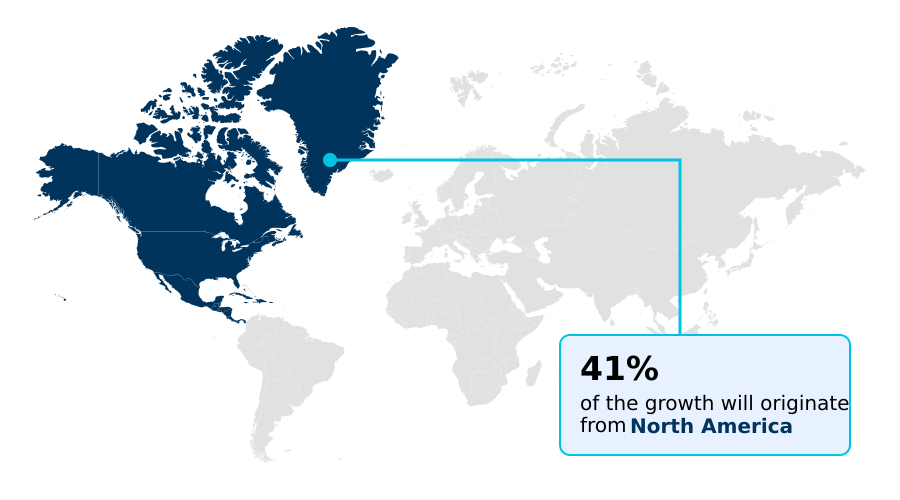
  • North America dominated the market and accounted for a 40.6% growth during the forecast period.
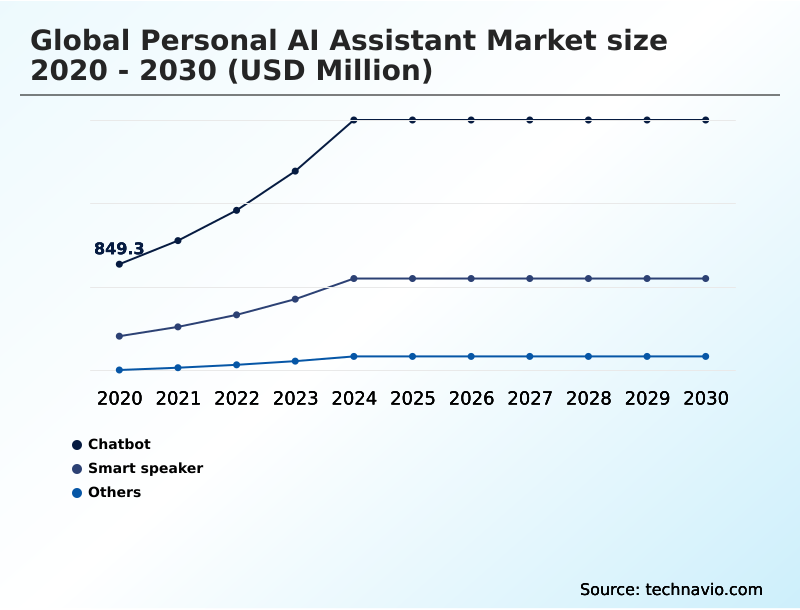
  • By Product - Chatbot segment was valued at USD 1.89 billion in 2024
  • By Technology - Natural language processing segment accounted for the largest market revenue share in 2024

Market Size & Forecast

  • Market Opportunities: USD 14.67 billion
  • Market Future Opportunities: USD 12.36 billion
  • CAGR from 2025 to 2030 : 34.8%

Market Summary

  • The personal AI assistant market is defined by the development of sophisticated software agents that leverage natural language processing and machine learning to execute diverse tasks for individual users. These systems function by synthesizing vast data quantities, learning user preferences over time to deliver proactive recommendations and streamline task execution.
  • Key applications include administrative scheduling, smart home integration, and complex information retrieval. By utilizing neural networks, these assistants provide significant advantages in operational efficiency and cognitive offloading, enabling users to delegate repetitive processes to an intelligent interface.
  • In a business context, this translates to tangible productivity gains; for example, an assistant can autonomously monitor project timelines, flag potential delays by analyzing communications, and schedule resolution meetings, freeing up managerial resources for strategic decision-making. As these systems evolve from reactive tools to predictive partners, they become essential assets for enhancing productivity.
  • The market is a cornerstone for future advancements in ambient intelligence and hyper-personalized consumer technology, representing a critical shift toward human-centric computing.

What will be the Size of the Personal AI Assistant Market during the forecast period?

Get Key Insights on Market Forecast (PDF) Request Free Sample

How is the Personal AI Assistant Market Segmented?

The personal ai assistant industry research report provides comprehensive data (region-wise segment analysis), with forecasts and estimates in "USD million" for the period 2026-2030, as well as historical data from 2020-2024 for the following segments.

  • Product
    • Chatbot
    • Smart speaker
    • Others
  • Technology
    • Natural language processing
    • Machine learning
    • Text-based
  • Deployment
    • Cloud-based
    • On-premises
  • Geography
    • North America
      • US
      • Canada
      • Mexico
    • APAC
      • China
      • Japan
      • India
    • Europe
      • Germany
      • UK
      • France
    • Middle East and Africa
      • Saudi Arabia
      • UAE
      • South Africa
    • South America
      • Brazil
      • Argentina
    • Rest of World (ROW)

By Product Insights

The chatbot segment is estimated to witness significant growth during the forecast period.

The chatbot sub-segment is evolving from simple interfaces into sophisticated agentic systems capable of complex reasoning and multi-step task execution. These digital assistants are integrated into mobile apps and enterprise communication platforms, serving as a primary touchpoint for digital interaction.

Modern chatbots leverage generative artificial intelligence to provide nuanced responses, transitioning from reactive tools to proactive digital companions.

Through deep personalization, these conversational AI services learn behavioral patterns to anticipate needs, powering enterprise automation and delivering AI-driven insights that improve workflow efficiency by over 25%.

The scalability of chatbot software allows for immediate deployment of updates, ensuring advancements are available to a global user base and enabling unified communications for seamless cross-platform experiences, whether through voice interaction or text for task automation.

Request Free Sample

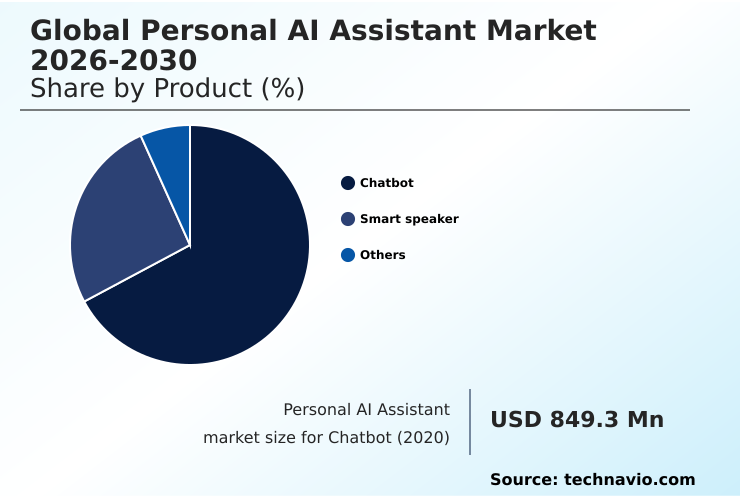
The Chatbot segment was valued at USD 1.89 billion in 2024 and showed a gradual increase during the forecast period.

Request Free Sample

Regional Analysis

North America is estimated to contribute 40.6% to the growth of the global market during the forecast period.Technavio’s analysts have elaborately explained the regional trends and drivers that shape the market during the forecast period.

See How Personal AI Assistant Market Demand is Rising in North America Request Free Sample

The market exhibits distinct regional dynamics. North America leads in adoption, driven by mature smart home ecosystems and a focus on cognitive offloading, with over 60% of users leveraging assistants for productivity. The region pioneers hyper-personalized digital experiences.

In APAC, the focus is on mobile-first applications and voice-first interfaces that support linguistic diversity, with some markets seeing a 50% year-over-year increase in text-based interaction for e-commerce.

Europe prioritizes consumer data protection, favoring assistants with strong privacy controls and low-latency performance.

The development of robotic companions in Japan and smart city integration in China showcase the diverse applications of the technology, from enhancing situational awareness to enabling complex multi-step task execution.

This global digital transformation is supported by both cloud-based deployment and localized processing.

Market Dynamics

Our researchers analyzed the data with 2025 as the base year, along with the key drivers, trends, and challenges. A holistic analysis of drivers will help companies refine their marketing strategies to gain a competitive advantage.

  • The adoption of a personal AI assistant for productivity is accelerating as users seek to automate administrative tasks and enhance efficiency. The move toward agentic AI for task management allows these systems to operate with greater independence, coordinating complex workflows across multiple applications.
  • This evolution is particularly impactful for enterprise use of personal assistants, where AI task orchestration across apps can streamline operations. A key area of innovation is in on-device AI for data privacy, which addresses security concerns by processing sensitive information locally.
  • This technology is central to privacy-first personal AI solutions and is often deployed through edge AI in wearable devices, creating a seamless user experience. The integration of AI for hyper-personalized experiences is another critical factor, with assistants learning individual preferences to offer tailored suggestions.
  • This is enabled by advances in both natural language processing for assistants and machine learning in personal AI. The debate between cloud vs on-premise AI assistants continues, with each model offering distinct benefits in scalability and security.
  • In consumer technology, multimodal AI in smart glasses and AI assistants in connected vehicles are becoming more common, while the AI assistant for smart homes market matures. A primary challenge remains in reducing algorithmic hallucination in AI and overcoming AI ecosystem fragmentation to create a truly unified experience.
  • For instance, integrated supply chain platforms using agentic AI have demonstrated a greater than 35% improvement in forecast accuracy compared to siloed legacy systems by enabling generative AI for cognitive offloading and leveraging localized intelligence in AI assistants through ambient intelligence and IoT integration.

What are the key market drivers leading to the rise in the adoption of Personal AI Assistant Industry?

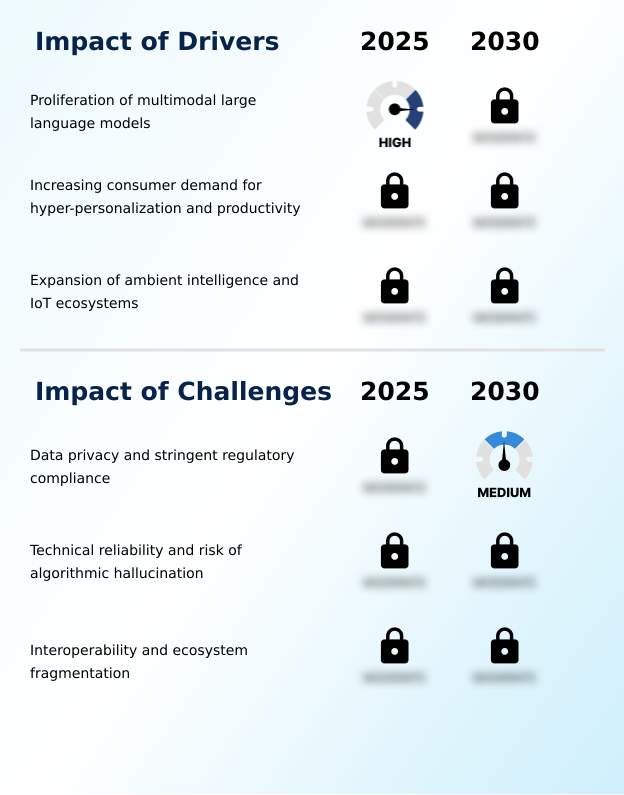
  • The proliferation of multimodal large language models that process diverse data formats is a primary driver for the personal AI assistant market.

  • The proliferation of multimodal large language models is a primary market driver, enabling intelligent automation and sophisticated task orchestration. These models, powered by machine learning and generative artificial intelligence, can synthesize information from text, audio, and visual data.
  • This facilitates ambient integration into daily life, providing a continuous stream of support. The expansion of edge AI processing supports autonomous agent capabilities with enhanced user-centric security protocols, allowing for complex computations directly on user devices.
  • This approach improves performance by over 30% in response time for critical applications.
  • Advancements in reinforcement learning and zero-shot learning are expanding assistant functionalities into new domains, such as personal finance management, without requiring explicit training, further cementing their role as indispensable tools.

What are the market trends shaping the Personal AI Assistant Industry?

  • A prominent market trend is the shift toward agentic autonomy, where personal assistants evolve from passive tools to proactive entities capable of independent task orchestration.

  • The market is shifting toward agentic autonomy, with proactive digital companions evolving beyond simple commands. This trend is fueled by advances in natural language processing and the integration of persistent memory, allowing for more nuanced interactions. A parallel movement is the rise of privacy-first localized intelligence and data sovereignty, with on-device processing reducing reliance on the cloud and enhancing security.
  • This approach mitigates risks like algorithmic hallucination. The convergence of multimodal capabilities is evident in new form factors like augmented reality glasses, which provide real-time contextual information. These systems enable new agent-to-agent communication protocols, paving the way for hyper-realistic AI assistants.
  • In some sectors, this shift has led to subscription-based revenue models for advanced features, with firms reporting up to a 15% increase in customer retention for premium AI-driven insights.

What challenges does the Personal AI Assistant Industry face during its growth?

  • Navigating complex data privacy regulations and ensuring stringent regulatory compliance represents a key challenge for the personal AI assistant market.

  • A significant market challenge is ecosystem fragmentation, where proprietary silos prevent seamless interoperability and a unified user experience. While the agentic AI moment promises great efficiency, this fragmentation hinders progress. The development of small language models designed for on-premises deployment on dedicated neural processing units offers a solution by enabling powerful on-device processing.
  • This approach, which supports agentic creativity tools and low-code development, ensures low-latency performance and enhanced security. However, it requires significant investment in privacy-enhancing technologies. The complexity is compounded by the technical need for advanced semantic understanding and unsupervised learning techniques to make these local models effective.
  • Organizations adopting on-device strategies have reported a 40% reduction in data transmission costs but face higher initial hardware expenditures.

Exclusive Technavio Analysis on Customer Landscape

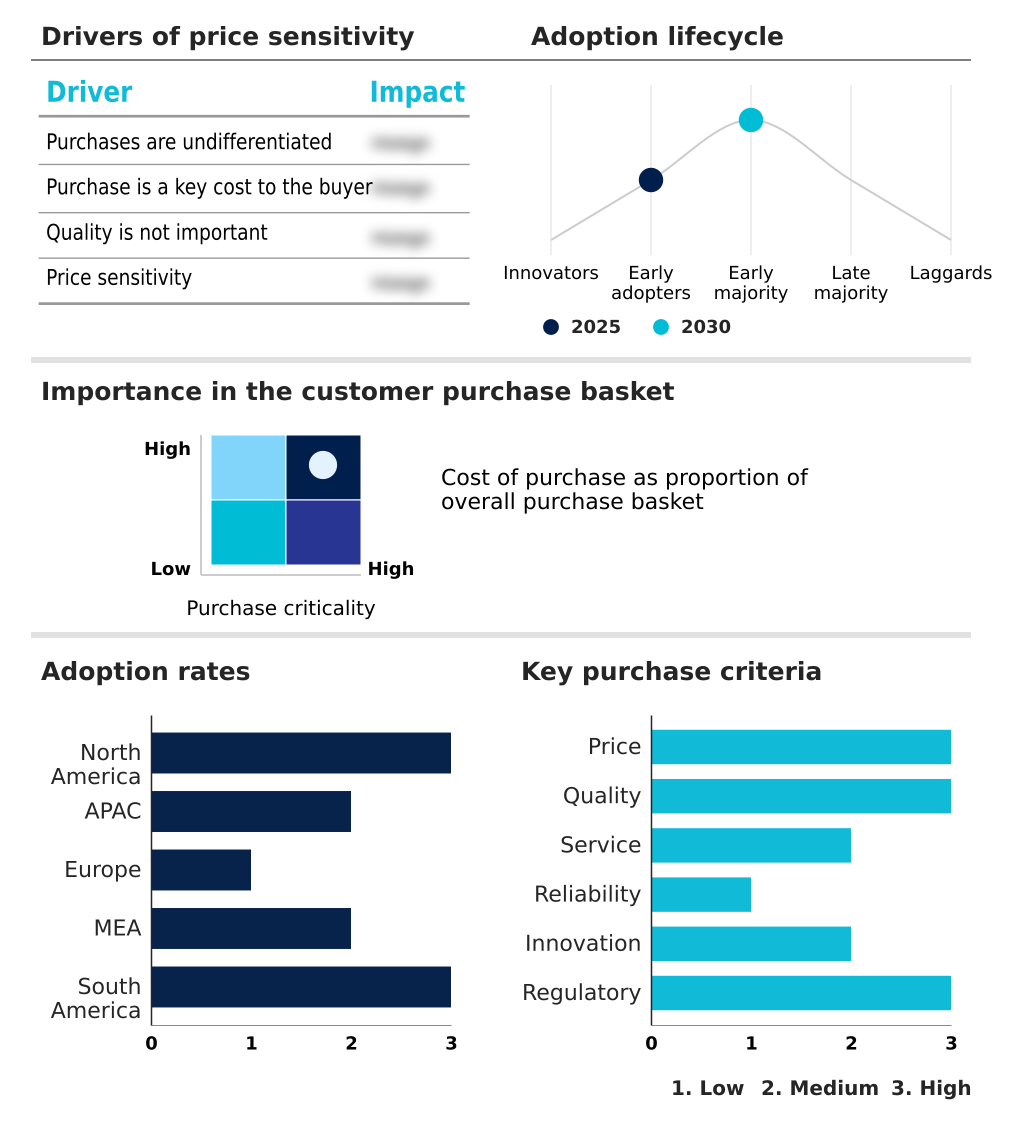
The personal ai assistant market forecasting report includes the adoption lifecycle of the market, covering from the innovator’s stage to the laggard’s stage. It focuses on adoption rates in different regions based on penetration. Furthermore, the personal ai assistant market report also includes key purchase criteria and drivers of price sensitivity to help companies evaluate and develop their market growth analysis strategies.

Customer Landscape of Personal AI Assistant Industry

Competitive Landscape

Companies are implementing various strategies, such as strategic alliances, personal ai assistant market forecast, partnerships, mergers and acquisitions, geographical expansion, and product/service launches, to enhance their presence in the industry.

Alibaba Group Holding Ltd. - Key offerings focus on deploying sophisticated software agents that utilize natural language processing and machine learning for hyper-personalized task execution and cognitive offloading for individual users.

The industry research and growth report includes detailed analyses of the competitive landscape of the market and information about key companies, including:

  • Alibaba Group Holding Ltd.
  • Amazon.com Inc.
  • Anthropic
  • Apple Inc.
  • Baidu Inc.
  • Cerence Inc.
  • Google LLC
  • Huawei Technologies Co. Ltd.
  • IBM Corp.
  • Infosys Ltd.
  • LG Electronics Inc.
  • Microsoft Corp.
  • NAVER CORP.
  • Orange SA
  • Samsung Electronics Co. Ltd.
  • SK Telecom Co. Ltd.
  • Sony Group Corp.
  • SoundHound AI Inc.
  • Yandex NV
  • Zapier Inc.

Qualitative and quantitative analysis of companies has been conducted to help clients understand the wider business environment as well as the strengths and weaknesses of key industry players. Data is qualitatively analyzed to categorize companies as pure play, category-focused, industry-focused, and diversified; it is quantitatively analyzed to categorize companies as dominant, leading, strong, tentative, and weak.

Recent Development and News in Personal ai assistant market

  • In May 2025, Mistral AI announced the launch of its new Agents API, a major advancement designed to transform traditional language models into action-oriented AI systems capable of interacting with real-world applications.
  • In February 2025, Amazon.com Inc introduced Alexa Plus, the next generation of its personal artificial intelligence assistant, powered by generative AI to enable more conversational and task-oriented interactions for users.
  • In February 2025, French startup Mistral AI launched 'Le Chat,' a new mobile application for its generative AI assistant, positioning it as a strong alternative to existing AI tools with high-speed response capabilities.
  • In June 2025, Apple Inc set an internal target of spring 2026 for releasing its long-delayed Siri artificial intelligence upgrade, aiming to deliver deeper app integration and more natural interactions across its device ecosystem.

Dive into Technavio’s robust research methodology, blending expert interviews, extensive data synthesis, and validated models for unparalleled Personal AI Assistant Market insights. See full methodology.

Market Scope
Page number 299
Base year 2025
Historic period 2020-2024
Forecast period 2026-2030
Growth momentum & CAGR Accelerate at a CAGR of 34.8%
Market growth 2026-2030 USD 12360.3 million
Market structure Fragmented
YoY growth 2025-2026(%) 28.9%
Key countries US, Canada, Mexico, China, Japan, India, South Korea, Australia, Indonesia, Germany, UK, France, Italy, Spain, The Netherlands, Saudi Arabia, UAE, South Africa, Israel, Turkey, Brazil, Argentina and Chile
Competitive landscape Leading Companies, Market Positioning of Companies, Competitive Strategies, and Industry Risks

Request Free Sample

Research Analyst Overview

  • The personal AI assistant market is undergoing a significant architectural shift from reactive tools to proactive partners. This evolution is driven by advancements in multimodal processing and ambient intelligence, which allow assistants to understand user context with greater depth.
  • The integration of conversational intelligence platforms into everyday applications provides enhanced productivity assistance, moving beyond simple voice interaction to handle complex task automation. For corporate leadership, this transition presents a strategic choice regarding investment in proprietary ecosystems versus open, interoperable web-based service models. The decision directly impacts long-term data strategy and customer retention.
  • For instance, systems that enable deep personalization by learning user behavior have shown the ability to reduce customer service escalations by over 20%, demonstrating a clear return on investment. As assistants become more embedded in workflows, their role expands from mere convenience to a critical component of operational efficiency and a key driver of competitive differentiation.

What are the Key Data Covered in this Personal AI Assistant Market Research and Growth Report?

  • What is the expected growth of the Personal AI Assistant Market between 2026 and 2030?

    • USD 12.36 billion, at a CAGR of 34.8%

  • What segmentation does the market report cover?

    • The report is segmented by Product (Chatbot, Smart speaker, and Others), Technology (Natural language processing, Machine learning, and Text-based), Deployment (Cloud-based, and On-premises) and Geography (North America, APAC, Europe, Middle East and Africa, South America)

  • Which regions are analyzed in the report?

    • North America, APAC, Europe, Middle East and Africa and South America

  • What are the key growth drivers and market challenges?

    • Proliferation of multimodal large language models, Data privacy and stringent regulatory compliance

  • Who are the major players in the Personal AI Assistant Market?

    • Alibaba Group Holding Ltd., Amazon.com Inc., Anthropic, Apple Inc., Baidu Inc., Cerence Inc., Google LLC, Huawei Technologies Co. Ltd., IBM Corp., Infosys Ltd., LG Electronics Inc., Microsoft Corp., NAVER CORP., Orange SA, Samsung Electronics Co. Ltd., SK Telecom Co. Ltd., Sony Group Corp., SoundHound AI Inc., Yandex NV and Zapier Inc.

Market Research Insights

  • The market is evolving through the rapid integration of autonomous agent capabilities, which enable assistants to perform complex workflows with minimal user intervention, increasing task completion rates by up to 40%. A focus on hyper-personalized digital experiences is driving adoption, as machine learning models create deeply tailored user interactions.
  • Demand for robust user-centric security protocols is also shaping development, with on-device processing reducing data vulnerability. The pursuit of seamless cross-platform experiences remains a central goal, although it presents technical challenges.
  • In specialized applications like personal finance management, AI-driven insights have demonstrated a 15% improvement in identifying savings opportunities for users, underscoring the technology's practical value and alignment with consumer data protection standards.

We can help! Our analysts can customize this personal ai assistant market research report to meet your requirements.

Get in touch

1. Executive Summary

1.1 Market overview

Executive Summary - Chart on Market Overview
Executive Summary - Data Table on Market Overview
Executive Summary - Chart on Global Market Characteristics
Executive Summary - Chart on Market by Geography
Executive Summary - Chart on Market Segmentation by Product
Executive Summary - Chart on Market Segmentation by Technology
Executive Summary - Chart on Market Segmentation by Deployment
Executive Summary - Chart on Incremental Growth
Executive Summary - Data Table on Incremental Growth
Executive Summary - Chart on Company Market Positioning

2. Technavio Analysis

2.1 Analysis of price sensitivity, lifecycle, customer purchase basket, adoption rates, and purchase criteria

2.2 Criticality of inputs and Factors of differentiation

Chart on Overview on criticality of inputs and factors of differentiation

2.3 Factors of disruption

Chart on Overview on factors of disruption

2.4 Impact of drivers and challenges

Chart on Impact of drivers and challenges in 2025 and 2030

3. Market Landscape

3.1 Market ecosystem

Chart on Parent Market
Data Table on - Parent Market

3.2 Market characteristics

Chart on Market characteristics analysis

3.3 Value chain analysis

Chart on Value chain analysis

4. Market Sizing

4.1 Market definition

Data Table on Offerings of companies included in the market definition

4.2 Market segment analysis

Market segments

4.3 Market size 2025

4.4 Market outlook: Forecast for 2025-2030

Chart on Global - Market size and forecast 2025-2030 ($ million)
Data Table on Global - Market size and forecast 2025-2030 ($ million)
Chart on Global Market: Year-over-year growth 2025-2030 (%)
Data Table on Global Market: Year-over-year growth 2025-2030 (%)

5. Historic Market Size

5.1 Global Personal AI Assistant Market 2020 - 2024

Historic Market Size - Data Table on Global Personal AI Assistant Market 2020 - 2024 ($ million)

5.2 Product segment analysis 2020 - 2024

Historic Market Size - Product Segment 2020 - 2024 ($ million)

5.3 Technology segment analysis 2020 - 2024

Historic Market Size - Technology Segment 2020 - 2024 ($ million)

5.4 Deployment segment analysis 2020 - 2024

Historic Market Size - Deployment Segment 2020 - 2024 ($ million)

5.5 Geography segment analysis 2020 - 2024

Historic Market Size - Geography Segment 2020 - 2024 ($ million)

5.6 Country segment analysis 2020 - 2024

Historic Market Size - Country Segment 2020 - 2024 ($ million)

6. Qualitative Analysis

6.1 Impact of Geopolitical Conflict on Global Personal AI Assistant Market

7. Five Forces Analysis

7.1 Five forces summary

Five forces analysis - Comparison between 2025 and 2030

7.2 Bargaining power of buyers

Bargaining power of buyers - Impact of key factors 2025 and 2030

7.3 Bargaining power of suppliers

Bargaining power of suppliers - Impact of key factors in 2025 and 2030

7.4 Threat of new entrants

Threat of new entrants - Impact of key factors in 2025 and 2030

7.5 Threat of substitutes

Threat of substitutes - Impact of key factors in 2025 and 2030

7.6 Threat of rivalry

Threat of rivalry - Impact of key factors in 2025 and 2030

7.7 Market condition

Chart on Market condition - Five forces 2025 and 2030

8. Market Segmentation by Product

8.1 Market segments

Chart on Product - Market share 2025-2030 (%)
Data Table on Product - Market share 2025-2030 (%)

8.2 Comparison by Product

Chart on Comparison by Product
Data Table on Comparison by Product

8.3 Chatbot - Market size and forecast 2025-2030

Chart on Chatbot - Market size and forecast 2025-2030 ($ million)
Data Table on Chatbot - Market size and forecast 2025-2030 ($ million)
Chart on Chatbot - Year-over-year growth 2025-2030 (%)
Data Table on Chatbot - Year-over-year growth 2025-2030 (%)

8.4 Smart speaker - Market size and forecast 2025-2030

Chart on Smart speaker - Market size and forecast 2025-2030 ($ million)
Data Table on Smart speaker - Market size and forecast 2025-2030 ($ million)
Chart on Smart speaker - Year-over-year growth 2025-2030 (%)
Data Table on Smart speaker - Year-over-year growth 2025-2030 (%)

8.5 Others - Market size and forecast 2025-2030

Chart on Others - Market size and forecast 2025-2030 ($ million)
Data Table on Others - Market size and forecast 2025-2030 ($ million)
Chart on Others - Year-over-year growth 2025-2030 (%)
Data Table on Others - Year-over-year growth 2025-2030 (%)

8.6 Market opportunity by Product

Market opportunity by Product ($ million)
Data Table on Market opportunity by Product ($ million)

9. Market Segmentation by Technology

9.1 Market segments

Chart on Technology - Market share 2025-2030 (%)
Data Table on Technology - Market share 2025-2030 (%)

9.2 Comparison by Technology

Chart on Comparison by Technology
Data Table on Comparison by Technology

9.3 Natural language processing - Market size and forecast 2025-2030

Chart on Natural language processing - Market size and forecast 2025-2030 ($ million)
Data Table on Natural language processing - Market size and forecast 2025-2030 ($ million)
Chart on Natural language processing - Year-over-year growth 2025-2030 (%)
Data Table on Natural language processing - Year-over-year growth 2025-2030 (%)

9.4 Machine learning - Market size and forecast 2025-2030

Chart on Machine learning - Market size and forecast 2025-2030 ($ million)
Data Table on Machine learning - Market size and forecast 2025-2030 ($ million)
Chart on Machine learning - Year-over-year growth 2025-2030 (%)
Data Table on Machine learning - Year-over-year growth 2025-2030 (%)

9.5 Text-based - Market size and forecast 2025-2030

Chart on Text-based - Market size and forecast 2025-2030 ($ million)
Data Table on Text-based - Market size and forecast 2025-2030 ($ million)
Chart on Text-based - Year-over-year growth 2025-2030 (%)
Data Table on Text-based - Year-over-year growth 2025-2030 (%)

9.6 Market opportunity by Technology

Market opportunity by Technology ($ million)
Data Table on Market opportunity by Technology ($ million)

10. Market Segmentation by Deployment

10.1 Market segments

Chart on Deployment - Market share 2025-2030 (%)
Data Table on Deployment - Market share 2025-2030 (%)

10.2 Comparison by Deployment

Chart on Comparison by Deployment
Data Table on Comparison by Deployment

10.3 Cloud-based - Market size and forecast 2025-2030

Chart on Cloud-based - Market size and forecast 2025-2030 ($ million)
Data Table on Cloud-based - Market size and forecast 2025-2030 ($ million)
Chart on Cloud-based - Year-over-year growth 2025-2030 (%)
Data Table on Cloud-based - Year-over-year growth 2025-2030 (%)

10.4 On-premises - Market size and forecast 2025-2030

Chart on On-premises - Market size and forecast 2025-2030 ($ million)
Data Table on On-premises - Market size and forecast 2025-2030 ($ million)
Chart on On-premises - Year-over-year growth 2025-2030 (%)
Data Table on On-premises - Year-over-year growth 2025-2030 (%)

10.5 Market opportunity by Deployment

Market opportunity by Deployment ($ million)
Data Table on Market opportunity by Deployment ($ million)

11. Customer Landscape

11.1 Customer landscape overview

Analysis of price sensitivity, lifecycle, customer purchase basket, adoption rates, and purchase criteria

12. Geographic Landscape

12.1 Geographic segmentation

Chart on Market share by geography 2025-2030 (%)
Data Table on Market share by geography 2025-2030 (%)

12.2 Geographic comparison

Chart on Geographic comparison
Data Table on Geographic comparison

12.3 North America - Market size and forecast 2025-2030

Chart on North America - Market size and forecast 2025-2030 ($ million)
Data Table on North America - Market size and forecast 2025-2030 ($ million)
Chart on North America - Year-over-year growth 2025-2030 (%)
Data Table on North America - Year-over-year growth 2025-2030 (%)
Chart on Regional Comparison - North America
Data Table on Regional Comparison - North America

12.3.1 US - Market size and forecast 2025-2030

Chart on US - Market size and forecast 2025-2030 ($ million)
Data Table on US - Market size and forecast 2025-2030 ($ million)
Chart on US - Year-over-year growth 2025-2030 (%)
Data Table on US - Year-over-year growth 2025-2030 (%)

12.3.2 Canada - Market size and forecast 2025-2030

Chart on Canada - Market size and forecast 2025-2030 ($ million)
Data Table on Canada - Market size and forecast 2025-2030 ($ million)
Chart on Canada - Year-over-year growth 2025-2030 (%)
Data Table on Canada - Year-over-year growth 2025-2030 (%)

12.3.3 Mexico - Market size and forecast 2025-2030

Chart on Mexico - Market size and forecast 2025-2030 ($ million)
Data Table on Mexico - Market size and forecast 2025-2030 ($ million)
Chart on Mexico - Year-over-year growth 2025-2030 (%)
Data Table on Mexico - Year-over-year growth 2025-2030 (%)

12.4 APAC - Market size and forecast 2025-2030

Chart on APAC - Market size and forecast 2025-2030 ($ million)
Data Table on APAC - Market size and forecast 2025-2030 ($ million)
Chart on APAC - Year-over-year growth 2025-2030 (%)
Data Table on APAC - Year-over-year growth 2025-2030 (%)
Chart on Regional Comparison - APAC
Data Table on Regional Comparison - APAC

12.4.1 China - Market size and forecast 2025-2030

Chart on China - Market size and forecast 2025-2030 ($ million)
Data Table on China - Market size and forecast 2025-2030 ($ million)
Chart on China - Year-over-year growth 2025-2030 (%)
Data Table on China - Year-over-year growth 2025-2030 (%)

12.4.2 Japan - Market size and forecast 2025-2030

Chart on Japan - Market size and forecast 2025-2030 ($ million)
Data Table on Japan - Market size and forecast 2025-2030 ($ million)
Chart on Japan - Year-over-year growth 2025-2030 (%)
Data Table on Japan - Year-over-year growth 2025-2030 (%)

12.4.3 India - Market size and forecast 2025-2030

Chart on India - Market size and forecast 2025-2030 ($ million)
Data Table on India - Market size and forecast 2025-2030 ($ million)
Chart on India - Year-over-year growth 2025-2030 (%)
Data Table on India - Year-over-year growth 2025-2030 (%)

12.4.4 South Korea - Market size and forecast 2025-2030

Chart on South Korea - Market size and forecast 2025-2030 ($ million)
Data Table on South Korea - Market size and forecast 2025-2030 ($ million)
Chart on South Korea - Year-over-year growth 2025-2030 (%)
Data Table on South Korea - Year-over-year growth 2025-2030 (%)

12.4.5 Australia - Market size and forecast 2025-2030

Chart on Australia - Market size and forecast 2025-2030 ($ million)
Data Table on Australia - Market size and forecast 2025-2030 ($ million)
Chart on Australia - Year-over-year growth 2025-2030 (%)
Data Table on Australia - Year-over-year growth 2025-2030 (%)

12.4.6 Indonesia - Market size and forecast 2025-2030

Chart on Indonesia - Market size and forecast 2025-2030 ($ million)
Data Table on Indonesia - Market size and forecast 2025-2030 ($ million)
Chart on Indonesia - Year-over-year growth 2025-2030 (%)
Data Table on Indonesia - Year-over-year growth 2025-2030 (%)

12.5 Europe - Market size and forecast 2025-2030

Chart on Europe - Market size and forecast 2025-2030 ($ million)
Data Table on Europe - Market size and forecast 2025-2030 ($ million)
Chart on Europe - Year-over-year growth 2025-2030 (%)
Data Table on Europe - Year-over-year growth 2025-2030 (%)
Chart on Regional Comparison - Europe
Data Table on Regional Comparison - Europe

12.5.1 Germany - Market size and forecast 2025-2030

Chart on Germany - Market size and forecast 2025-2030 ($ million)
Data Table on Germany - Market size and forecast 2025-2030 ($ million)
Chart on Germany - Year-over-year growth 2025-2030 (%)
Data Table on Germany - Year-over-year growth 2025-2030 (%)

12.5.2 UK - Market size and forecast 2025-2030

Chart on UK - Market size and forecast 2025-2030 ($ million)
Data Table on UK - Market size and forecast 2025-2030 ($ million)
Chart on UK - Year-over-year growth 2025-2030 (%)
Data Table on UK - Year-over-year growth 2025-2030 (%)

12.5.3 France - Market size and forecast 2025-2030

Chart on France - Market size and forecast 2025-2030 ($ million)
Data Table on France - Market size and forecast 2025-2030 ($ million)
Chart on France - Year-over-year growth 2025-2030 (%)
Data Table on France - Year-over-year growth 2025-2030 (%)

12.5.4 Italy - Market size and forecast 2025-2030

Chart on Italy - Market size and forecast 2025-2030 ($ million)
Data Table on Italy - Market size and forecast 2025-2030 ($ million)
Chart on Italy - Year-over-year growth 2025-2030 (%)
Data Table on Italy - Year-over-year growth 2025-2030 (%)

12.5.5 Spain - Market size and forecast 2025-2030

Chart on Spain - Market size and forecast 2025-2030 ($ million)
Data Table on Spain - Market size and forecast 2025-2030 ($ million)
Chart on Spain - Year-over-year growth 2025-2030 (%)
Data Table on Spain - Year-over-year growth 2025-2030 (%)

12.5.6 The Netherlands - Market size and forecast 2025-2030

Chart on The Netherlands - Market size and forecast 2025-2030 ($ million)
Data Table on The Netherlands - Market size and forecast 2025-2030 ($ million)
Chart on The Netherlands - Year-over-year growth 2025-2030 (%)
Data Table on The Netherlands - Year-over-year growth 2025-2030 (%)

12.6 Middle East and Africa - Market size and forecast 2025-2030

Chart on Middle East and Africa - Market size and forecast 2025-2030 ($ million)
Data Table on Middle East and Africa - Market size and forecast 2025-2030 ($ million)
Chart on Middle East and Africa - Year-over-year growth 2025-2030 (%)
Data Table on Middle East and Africa - Year-over-year growth 2025-2030 (%)
Chart on Regional Comparison - Middle East and Africa
Data Table on Regional Comparison - Middle East and Africa

12.6.1 Saudi Arabia - Market size and forecast 2025-2030

Chart on Saudi Arabia - Market size and forecast 2025-2030 ($ million)
Data Table on Saudi Arabia - Market size and forecast 2025-2030 ($ million)
Chart on Saudi Arabia - Year-over-year growth 2025-2030 (%)
Data Table on Saudi Arabia - Year-over-year growth 2025-2030 (%)

12.6.2 UAE - Market size and forecast 2025-2030

Chart on UAE - Market size and forecast 2025-2030 ($ million)
Data Table on UAE - Market size and forecast 2025-2030 ($ million)
Chart on UAE - Year-over-year growth 2025-2030 (%)
Data Table on UAE - Year-over-year growth 2025-2030 (%)

12.6.3 South Africa - Market size and forecast 2025-2030

Chart on South Africa - Market size and forecast 2025-2030 ($ million)
Data Table on South Africa - Market size and forecast 2025-2030 ($ million)
Chart on South Africa - Year-over-year growth 2025-2030 (%)
Data Table on South Africa - Year-over-year growth 2025-2030 (%)

12.6.4 Israel - Market size and forecast 2025-2030

Chart on Israel - Market size and forecast 2025-2030 ($ million)
Data Table on Israel - Market size and forecast 2025-2030 ($ million)
Chart on Israel - Year-over-year growth 2025-2030 (%)
Data Table on Israel - Year-over-year growth 2025-2030 (%)

12.6.5 Turkey - Market size and forecast 2025-2030

Chart on Turkey - Market size and forecast 2025-2030 ($ million)
Data Table on Turkey - Market size and forecast 2025-2030 ($ million)
Chart on Turkey - Year-over-year growth 2025-2030 (%)
Data Table on Turkey - Year-over-year growth 2025-2030 (%)

12.7 South America - Market size and forecast 2025-2030

Chart on South America - Market size and forecast 2025-2030 ($ million)
Data Table on South America - Market size and forecast 2025-2030 ($ million)
Chart on South America - Year-over-year growth 2025-2030 (%)
Data Table on South America - Year-over-year growth 2025-2030 (%)
Chart on Regional Comparison - South America
Data Table on Regional Comparison - South America

12.7.1 Brazil - Market size and forecast 2025-2030

Chart on Brazil - Market size and forecast 2025-2030 ($ million)
Data Table on Brazil - Market size and forecast 2025-2030 ($ million)
Chart on Brazil - Year-over-year growth 2025-2030 (%)
Data Table on Brazil - Year-over-year growth 2025-2030 (%)

12.7.2 Argentina - Market size and forecast 2025-2030

Chart on Argentina - Market size and forecast 2025-2030 ($ million)
Data Table on Argentina - Market size and forecast 2025-2030 ($ million)
Chart on Argentina - Year-over-year growth 2025-2030 (%)
Data Table on Argentina - Year-over-year growth 2025-2030 (%)

12.7.3 Chile - Market size and forecast 2025-2030

Chart on Chile - Market size and forecast 2025-2030 ($ million)
Data Table on Chile - Market size and forecast 2025-2030 ($ million)
Chart on Chile - Year-over-year growth 2025-2030 (%)
Data Table on Chile - Year-over-year growth 2025-2030 (%)

12.8 Market opportunity by geography

Market opportunity by geography ($ million)
Data Tables on Market opportunity by geography ($ million)

13. Drivers, Challenges, and Opportunity

13.1 Market drivers

Proliferation of multimodal large language models
Increasing consumer demand for hyper-personalization and productivity
Expansion of ambient intelligence and IoT ecosystems

13.2 Market challenges

Data privacy and stringent regulatory compliance
Technical reliability and risk of algorithmic hallucination
Interoperability and ecosystem fragmentation

13.3 Impact of drivers and challenges

Impact of drivers and challenges in 2025 and 2030

13.4 Market opportunities

Transition toward agentic autonomy and task orchestration
Rise of privacy-first localized intelligence
Multimodal convergence and ambient integration

14. Competitive Landscape

14.1 Overview

14.2

Overview on criticality of inputs and factors of differentiation

14.3 Landscape disruption

Overview on factors of disruption

14.4 Industry risks

Impact of key risks on business

15. Competitive Analysis

15.1 Companies profiled

Companies covered

15.2 Company ranking index

15.3 Market positioning of companies

Matrix on companies position and classification

15.4 Alibaba Group Holding Ltd.

Alibaba Group Holding Ltd. - Overview
Alibaba Group Holding Ltd. - Business segments
Alibaba Group Holding Ltd. - Key offerings
Alibaba Group Holding Ltd. - Segment focus
SWOT

15.5 Amazon.com Inc.

Amazon.com Inc. - Overview
Amazon.com Inc. - Business segments
Amazon.com Inc. - Key news
Amazon.com Inc. - Key offerings
Amazon.com Inc. - Segment focus
SWOT

15.6 Apple Inc.

Apple Inc. - Overview
Apple Inc. - Business segments
Apple Inc. - Key news
Apple Inc. - Key offerings
Apple Inc. - Segment focus
SWOT

15.7 Baidu Inc.

Baidu Inc. - Overview
Baidu Inc. - Business segments
Baidu Inc. - Key news
Baidu Inc. - Key offerings
Baidu Inc. - Segment focus
SWOT

15.8 Google LLC

Google LLC - Overview
Google LLC - Product / Service
Google LLC - Key offerings
SWOT

15.9 Huawei Technologies Co. Ltd.

Huawei Technologies Co. Ltd. - Overview
Huawei Technologies Co. Ltd. - Product / Service
Huawei Technologies Co. Ltd. - Key offerings
SWOT

15.10 IBM Corp.

IBM Corp. - Overview
IBM Corp. - Business segments
IBM Corp. - Key news
IBM Corp. - Key offerings
IBM Corp. - Segment focus
SWOT

15.11 Infosys Ltd.

Infosys Ltd. - Overview
Infosys Ltd. - Business segments
Infosys Ltd. - Key news
Infosys Ltd. - Key offerings
Infosys Ltd. - Segment focus
SWOT

15.12 LG Electronics Inc.

LG Electronics Inc. - Overview
LG Electronics Inc. - Business segments
LG Electronics Inc. - Key offerings
LG Electronics Inc. - Segment focus
SWOT

15.13 Microsoft Corp.

Microsoft Corp. - Overview
Microsoft Corp. - Business segments
Microsoft Corp. - Key news
Microsoft Corp. - Key offerings
Microsoft Corp. - Segment focus
SWOT

15.14 NAVER CORP.

NAVER CORP. - Overview
NAVER CORP. - Product / Service
NAVER CORP. - Key offerings
SWOT

15.15 Orange SA

Orange SA - Overview
Orange SA - Business segments
Orange SA - Key offerings
Orange SA - Segment focus
SWOT

15.16 Samsung Electronics Co. Ltd.

Samsung Electronics Co. Ltd. - Overview
Samsung Electronics Co. Ltd. - Business segments
Samsung Electronics Co. Ltd. - Key news
Samsung Electronics Co. Ltd. - Key offerings
Samsung Electronics Co. Ltd. - Segment focus
SWOT

15.17 SK Telecom Co. Ltd.

SK Telecom Co. Ltd. - Overview
SK Telecom Co. Ltd. - Business segments
SK Telecom Co. Ltd. - Key offerings
SK Telecom Co. Ltd. - Segment focus
SWOT

15.18 Sony Group Corp.

Sony Group Corp. - Overview
Sony Group Corp. - Business segments
Sony Group Corp. - Key news
Sony Group Corp. - Key offerings
Sony Group Corp. - Segment focus
SWOT

16. Appendix

16.1 Scope of the report

Market definition
Objectives
Notes and caveats

16.2 Inclusions and exclusions checklist

Inclusions checklist
Exclusions checklist

16.3 Currency conversion rates for US$

16.4 Research methodology

16.5 Data procurement

Information sources

16.6 Data validation

16.7 Validation techniques employed for market sizing

16.8 Data synthesis

16.9 360 degree market analysis

16.10 List of abbreviations

Research Methodology

Technavio presents a detailed picture of the market by way of study, synthesis, and summation of data from multiple sources. The analysts have presented the various facets of the market with a particular focus on identifying the key industry influencers. The data thus presented is comprehensive, reliable, and the result of extensive research, both primary and secondary.

INFORMATION SOURCES

Primary sources

  • Manufacturers and suppliers
  • Channel partners
  • Industry experts
  • Strategic decision makers

Secondary sources

  • Industry journals and periodicals
  • Government data
  • Financial reports of key industry players
  • Historical data
  • Press releases

DATA ANALYSIS

Data Synthesis

  • Collation of data
  • Estimation of key figures
  • Analysis of derived insights

Data Validation

  • Triangulation with data models
  • Reference against proprietary databases
  • Corroboration with industry experts

REPORT WRITING

Qualitative

  • Market drivers
  • Market challenges
  • Market trends
  • Five forces analysis

Quantitative

  • Market size and forecast
  • Market segmentation
  • Geographical insights
  • Competitive landscape

Interested in this report?

Get your sample now to see our research methodology and insights!

Download Now

Frequently Asked Questions

Personal AI Assistant market growth will increase by USD 12360.3 million during 2026-2030.

The Personal AI Assistant market is expected to grow at a CAGR of 34.8% during 2026-2030.

Personal AI Assistant market is segmented by Product (Chatbot, Smart speaker, Others) Technology (Natural language processing, Machine learning, Text-based) Deployment (Cloud-based, On-premises)

Alibaba Group Holding Ltd., Amazon.com Inc., Anthropic, Apple Inc., Baidu Inc., Cerence Inc., Google LLC, Huawei Technologies Co. Ltd., IBM Corp., Infosys Ltd., LG Electronics Inc., Microsoft Corp., NAVER CORP., Orange SA, Samsung Electronics Co. Ltd., SK Telecom Co. Ltd., Sony Group Corp., SoundHound AI Inc., Yandex NV, Zapier Inc. are a few of the key vendors in the Personal AI Assistant market.

North America will register the highest growth rate of 40.6% among the other regions. Therefore, the Personal AI Assistant market in North America is expected to garner significant business opportunities for the vendors during the forecast period.

US, Canada, Mexico, China, Japan, India, South Korea, Australia, Indonesia, Germany, UK, France, Italy, Spain, The Netherlands, Saudi Arabia, UAE, South Africa, Israel, Turkey, Brazil, Argentina, Chile

  • Proliferation of multimodal large language models is the driving factor this market.

The Personal AI Assistant market vendors should focus on grabbing business opportunities from the Product segment as it accounted for the largest market share in the base year.
RIA - Research AI Assistant
Ask RIA