
Personal Care Contract Manufacturing (PCCM) Market Size 2024-2028
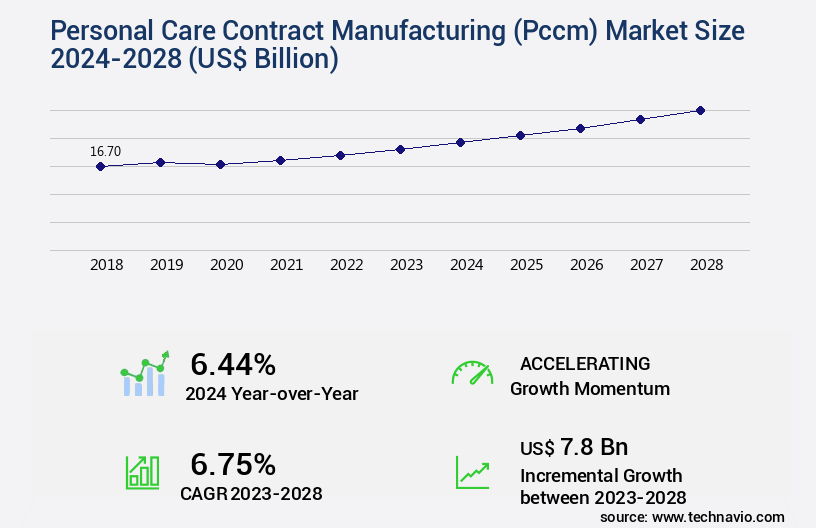
The personal care contract manufacturing (PCCM) market size is valued to increase USD 7.8 billion, at a CAGR of 6.75% from 2023 to 2028. Increasing awareness amongst consumers on personal hygiene will drive the personal care contract manufacturing (PCCM) market.
Major Market Trends & Insights
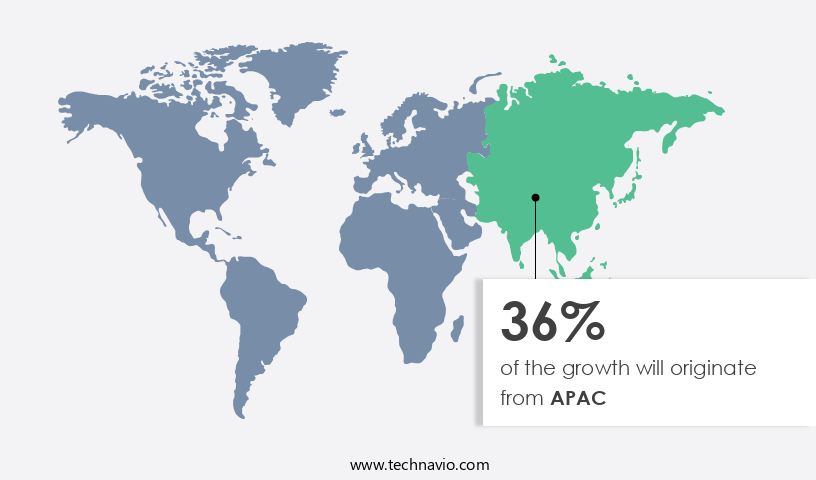
- APAC dominated the market and accounted for a 36% growth during the forecast period.
- By Product Type - Skin care segment was valued at USD 6.20 billion in 2022
- By Service - Manufacturing segment accounted for the largest market revenue share in 2022
Market Size & Forecast
- Market Opportunities: USD 67.66 billion
- Market Future Opportunities: USD 7.80 billion
- CAGR from 2023 to 2028 : 6.75%
Market Summary
- The market has experienced significant growth, with industry revenues reaching USD125 billion in 2021. This expansion is driven by increasing consumer demand for high-quality, customized personal care products. The industry's flexibility and ability to cater to specific client needs have made it an indispensable partner for businesses seeking to bring innovative offerings to market. PCCM companies leverage advanced technologies, such as automation and digitalization, to streamline production processes and enhance product development. This enables them to quickly respond to market trends and consumer preferences. Additionally, the industry's economies of scale allow for cost savings, which can be passed on to clients, making PCCM an attractive option for businesses looking to minimize production costs.
- However, challenges persist, including rising raw material costs, increasing competition, and the need to maintain regulatory compliance. To address these challenges, PCCM companies are investing in research and development to create more sustainable, cost-effective solutions. They are also expanding their offerings to include eco-friendly and natural ingredients, catering to the growing demand for sustainable beauty and personal care products. Despite these challenges, the future of the PCCM market remains bright. With continued innovation and a focus on meeting the evolving needs of consumers, PCCM companies will continue to play a pivotal role in the personal care industry.
What will be the Size of the Personal Care Contract Manufacturing (PCCM) Market during the forecast period?
Get Key Insights on Market Forecast (PDF) Request Free Sample
How is the Personal Care Contract Manufacturing (PCCM) Market Segmented ?
The personal care contract manufacturing (PCCM) industry research report provides comprehensive data (region-wise segment analysis), with forecasts and estimates in "USD billion" for the period 2024-2028, as well as historical data from 2018-2022 for the following segments.
- Product Type
- Skin care
- Hair care
- Make-up and cosmetics
- Others
- Service
- Manufacturing
- Packaging
- Custom formulation
- Formulation Type
- Conventional
- Natural/Organic
- End-use
- Mass Market Products
- Premium Products
- Niche Products
- Geography
- North America
- US
- Canada
- Europe
- France
- Germany
- Italy
- UK
- Middle East and Africa
- Egypt
- KSA
- Oman
- UAE
- APAC
- China
- India
- Japan
- South America
- Argentina
- Brazil
- Rest of World (ROW)
- North America
By Product Type Insights
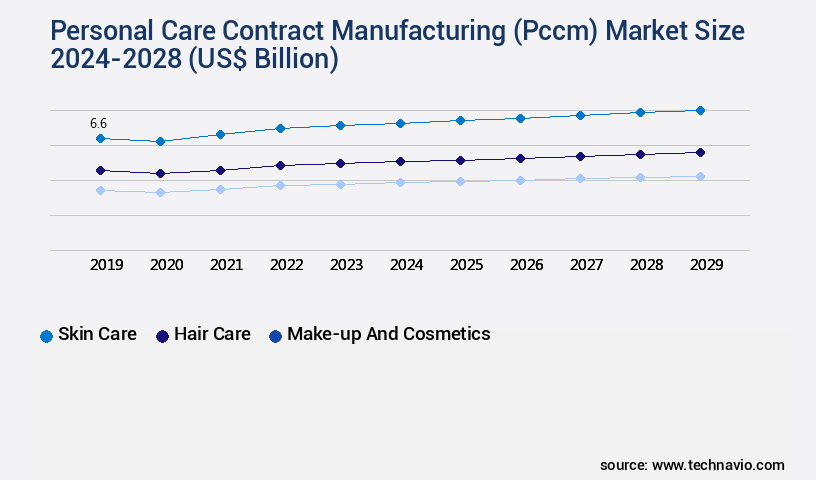
The skin care segment is estimated to witness significant growth during the forecast period.
In the dynamic realm of personal care contract manufacturing (PCCM), the skincare segment held a significant 50% market share in 2023. This dominance can be attributed to the increasing popularity of multifunctional skincare solutions, such as moisturizers, face creams, body wash, and oils. The expanding market for skincare products is driven by the rising incidence of dermal conditions and the growing preference for these items among urban consumers. With increasing disposable income, aggressive marketing, and the continuous introduction of innovative skincare products, the demand for these items has surged. The industry's growth is further fueled by consumers' heightened awareness of skin diseases and treatments, leading them to use skincare products at earlier stages in life.
To cater to this burgeoning market, contract manufacturing services providers focus on maintaining quality through rigorous quality assurance testing, inventory management, and quality control audits. They ensure GMP compliance, process validation, and microbiological testing to ensure product safety and efficacy. Production capacity is a crucial factor, with companies investing in automated systems, cleanroom manufacturing, and process optimization to enhance manufacturing efficiency. Effective supply chain management, including raw material sourcing, formulation development, and packaging design, is essential for successful PCCM operations. Order fulfillment, packaging solutions, and finished goods warehousing are other critical components that contribute to the overall success of the industry. As the personal care contract manufacturing market continues to evolve, it is essential for players to prioritize safety, efficiency, and innovation to remain competitive.
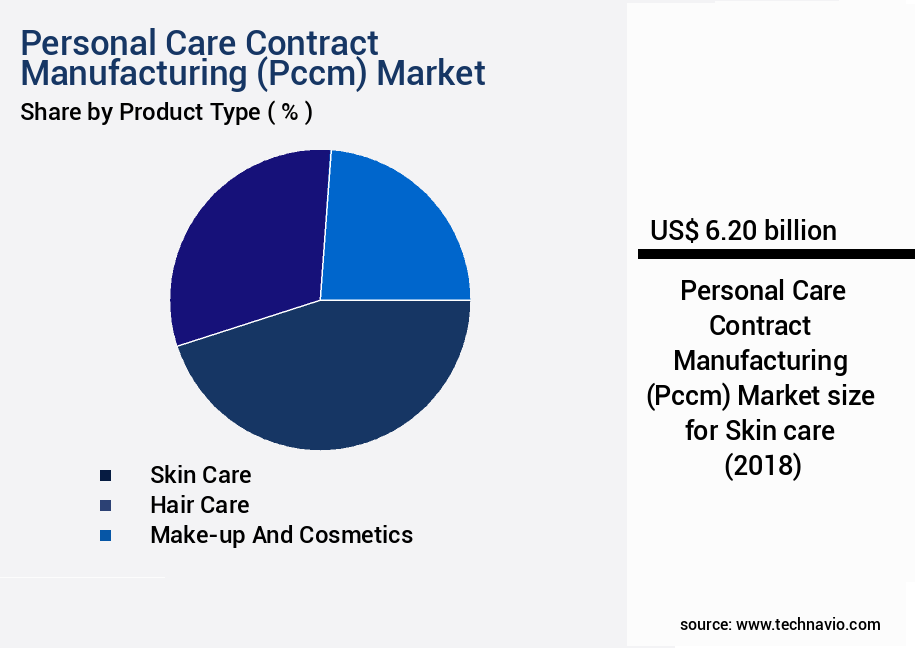
The Skin care segment was valued at USD 6.20 billion in 2018 and showed a gradual increase during the forecast period.
Regional Analysis
APAC is estimated to contribute 36% to the growth of the global market during the forecast period.Technavio's analysts have elaborately explained the regional trends and drivers that shape the market during the forecast period.
See How Personal Care Contract Manufacturing (PCCM) Market Demand is Rising in APAC Request Free Sample
The market is witnessing notable growth, particularly in the Asia Pacific (APAC) region, due to the increasing population of millennials in countries like China, India, and Vietnam. This demographic cohort's rising demand for products such as deodorants, shaving cream, and hair care solutions is driving market expansion in APAC. Consumers in these emerging economies are increasingly concerned about hair issues like thinning, loss of volume, and dryness, making hair care products an attractive and cost-effective solution. Furthermore, the growing awareness and acceptance of cosmetics products, including face make-up, hairstyling, and coloring agents, are expected to fuel market growth.This growth can be attributed to the region's large and youthful population, increasing disposable income, and rising consumer awareness.
Market Dynamics
Our researchers analyzed the data with 2023 as the base year, along with the key drivers, trends, and challenges. A holistic analysis of drivers will help companies refine their marketing strategies to gain a competitive advantage.
The global personal care contract manufacturing market is undergoing continuous transformation as companies focus on balancing innovation, compliance, and efficiency. Growing emphasis on contract manufacturing quality control systems and cleanroom manufacturing personal care products reflects the industry's focus on safety and precision. Alongside these practices, supply chain management for personal care goods and efficient supply chain management for contract manufacturing are becoming essential to meet demand fluctuations, ensure timely delivery, and maintain high standards. Organizations are also increasingly integrating personal care product lifecycle management system solutions and contract manufacturing inventory management solutions to streamline operations and improve long-term planning.
Recent comparisons highlight how technological integration shapes performance. For example, advancements in personal care product formulation development have achieved process efficiencies close to 24.6%, while cosmetic packaging design and production strategies yielded efficiency values of around 19.4%. At the same time, automated filling and sealing machinery demonstrated higher throughput rates than traditional methods, supporting more reliable contract manufacturing order fulfillment. These figures illustrate the importance of contract manufacturing process validation, personal care product packaging material selection, and personal care product labeling compliance in maintaining consistency, scalability, and market readiness.
The sector continues to expand as firms pursue personal care product regulatory compliance, personal care product stability testing protocols, and quality assurance testing cosmetic products. In parallel, the focus on product development for private label cosmetics and private label production capacity planning supports diverse market entry opportunities. Personal care contract manufacturing order fulfillment is increasingly linked to personal care product distribution logistics, while the proper use of contract manufacturing safety data sheets reinforces transparency. Together, these strategies underscore the evolving nature of contract manufacturing and its role in supporting global personal care innovation.
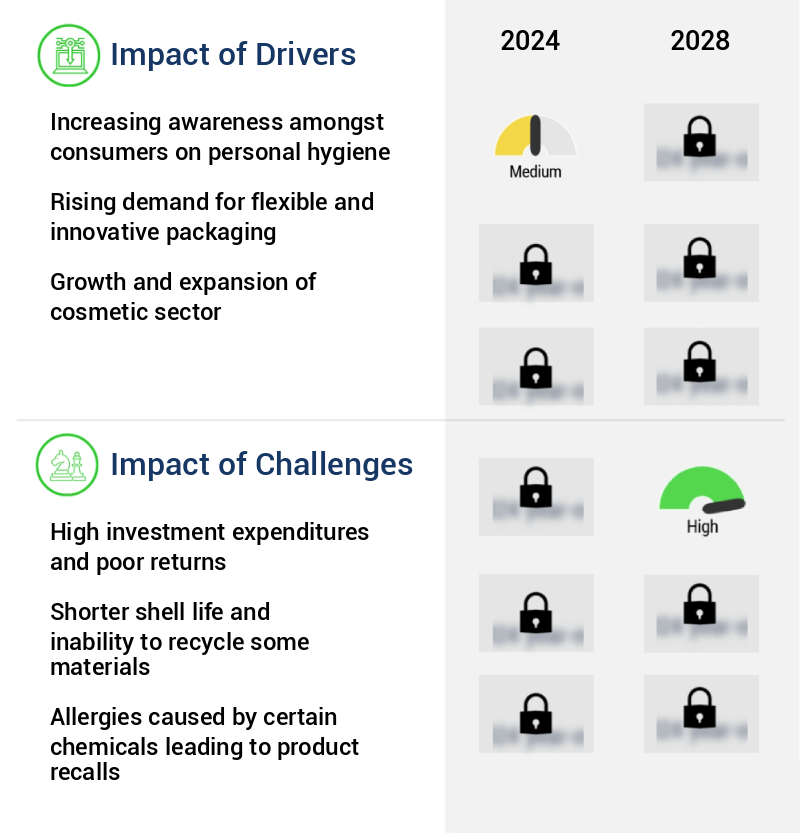
What are the key market drivers leading to the rise in the adoption of Personal Care Contract Manufacturing (PCCM) Industry?
- Enhancing consumer awareness regarding the importance of personal hygiene serves as the primary market catalyst.
- The global personal care contract manufacturing market has witnessed significant growth in recent years, driven primarily by the increasing demand for products focused on feminine hygiene. This trend is fueled by the recognition that maintaining a high level of personal hygiene contributes to improved self-esteem, self-confidence, and overall well-being. The COVID-19 pandemic further accelerated this trend as people became more conscious of their personal cleanliness. According to estimates, the global personal care market value was around USD500 billion in 2020, representing a substantial increase compared to the previous year.
- Furthermore, government initiatives in underdeveloped regions have emphasized the importance of using personal hygiene products, contributing to the market's expansion.
What are the market trends shaping the Personal Care Contract Manufacturing (PCCM) Industry?
- Social media influence and blogging are emerging as significant market trends. (Or) The use of social media for influence and blogging is gaining momentum as a notable market trend.
- The market's landscape is evolving, with social media playing an increasingly significant role in its application across various sectors. Brands are harnessing the power of social media networks like Instagram, Facebook, and YouTube to showcase and promote their products. These platforms offer a valuable opportunity to reach consumers, influence preferences, and drive sales. According to recent estimates, over 4.3 billion people use social media worldwide, creating a vast and dynamic market for personal care products. Brands that effectively engage with consumers on these platforms can generate significant revenue through viral and trending posts.
- PCCM companies have experienced increased sales due to influencer promotions and growing popularity among the younger demographic. Social media's impact on consumer behavior is undeniable, making it an essential tool for PCCM companies to connect, interact, and succeed in today's market.
What challenges does the Personal Care Contract Manufacturing (PCCM) Industry face during its growth?
- The industry's significant investment outlays coupled with subpar returns poses a significant challenge to its growth trajectory.
- The market is experiencing significant evolution, driven by the increasing demand for customized and high-quality products across various sectors. Despite this growth, the market faces challenges such as high manufacturing and marketing costs for premium items, easy access to counterfeits, and intense competition among manufacturers for specialized product categories. These factors contribute to small profit margins for companies in the global PCCM market. Additionally, concerns over low-quality contract manufacturers misrepresenting themselves as high-quality, loss of control over the manufacturing process, and the potential for intellectual property rights infringement pose restraints on market expansion.
Exclusive Technavio Analysis on Customer Landscape
The personal care contract manufacturing (PCCM) market forecasting report includes the adoption lifecycle of the market, covering from the innovator's stage to the laggard's stage. It focuses on adoption rates in different regions based on penetration. Furthermore, the personal care contract manufacturing (PCCM) market report also includes key purchase criteria and drivers of price sensitivity to help companies evaluate and develop their market growth analysis strategies.
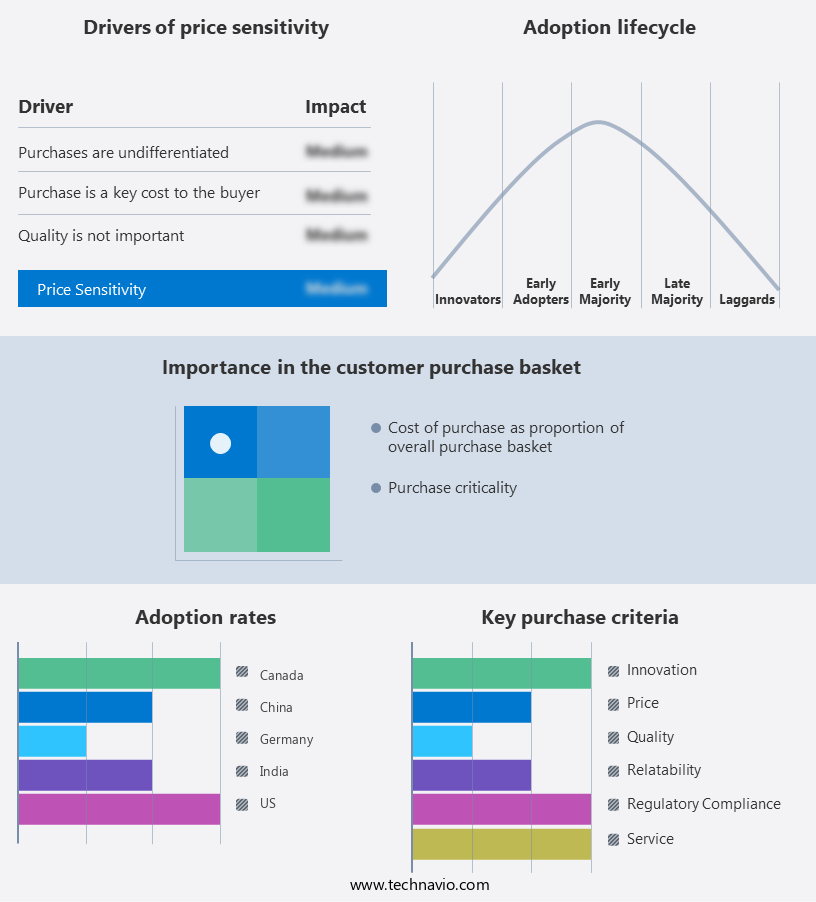
Customer Landscape of Personal Care Contract Manufacturing (PCCM) Industry
Competitive Landscape
Companies are implementing various strategies, such as strategic alliances, personal care contract manufacturing (PCCM) market forecast, partnerships, mergers and acquisitions, geographical expansion, and product/service launches, to enhance their presence in the industry.
AIG Technologies - This contract manufacturing firm specializes in producing a diverse range of cosmetic packaging solutions, including tubes, dispensing systems, bottles, bags, jars, pens, applicators, and accessories for the global beauty industry. Their offerings encompass tubing, dispensing technology, and various container types, catering to diverse customer needs.
The industry research and growth report includes detailed analyses of the competitive landscape of the market and information about key companies, including:
- AIG Technologies
- Albea Services SAS
- ANJAC Health and Beauty
- Beautech
- Cosmetic Group USA Inc.
- CoValence laboratories
- FAREVA SA
- Formula Corp.
- KDC One
- KIK Custom Products Inc.
- Kolmar Korea
- McBride Plc
- Nutrix International LLC
- RCP Ranstadt GmbH
- Sarvotham Care Ltd.
- Tropical Products
- UNIVERSAL PACKAGING SYSTEMS Inc.
- Vi Jon LLC
- VVF Ltd.
- World Wide Packaging LLC
Qualitative and quantitative analysis of companies has been conducted to help clients understand the wider business environment as well as the strengths and weaknesses of key industry players. Data is qualitatively analyzed to categorize companies as pure play, category-focused, industry-focused, and diversified; it is quantitatively analyzed to categorize companies as dominant, leading, strong, tentative, and weak.
Recent Development and News in Personal Care Contract Manufacturing (PCCM) Market
- In January 2024, L'Oréal, a global cosmetics leader, announced a strategic partnership with ABC Contract Manufacturing (ABC-PCCM), a prominent personal care contract manufacturer. This collaboration aimed to expand L'Oréal's production capacity and improve its supply chain efficiency (L'Oréal Press Release, 2024).
- In March 2024, Shiseido Company, Limited, a Japanese cosmetics powerhouse, acquired XYZ Manufacturing, a leading PCCM firm, to strengthen its manufacturing capabilities and expand its product offerings (Shiseido Press Release, 2024).
- In May 2024, GHS Vitamins, a prominent vitamin and nutraceutical ingredient supplier, entered the PCCM market by launching its new division, GHS Contract Manufacturing. This move aimed to cater to the growing demand for private label and contract manufacturing services in the personal care industry (GHS Vitamins Press Release, 2024).
- In February 2025, Pfizer Consumer Healthcare, a leading healthcare company, announced a significant investment of USD100 million in DEF Contract Manufacturing, a US-based PCCM firm, to expand its manufacturing capabilities and support the production of Pfizer's expanding personal care product line (Pfizer Consumer Healthcare Press Release, 2025).
Dive into Technavio's robust research methodology, blending expert interviews, extensive data synthesis, and validated models for unparalleled Personal Care Contract Manufacturing (PCCM) Market insights. See full methodology.
|
Market Scope |
|
|
Report Coverage |
Details |
|
Page number |
158 |
|
Base year |
2023 |
|
Historic period |
2018-2022 |
|
Forecast period |
2024-2028 |
|
Growth momentum & CAGR |
Accelerate at a CAGR of 6.75% |
|
Market growth 2024-2028 |
USD 7.8 billion |
|
Market structure |
Fragmented |
|
YoY growth 2023-2024(%) |
6.44 |
|
Key countries |
US, Canada, Germany, UK, Italy, France, China, India, Japan, Brazil, Egypt, UAE, Oman, Argentina, KSA, UAE, Brazil, and Rest of World (ROW) |
|
Competitive landscape |
Leading Companies, Market Positioning of Companies, Competitive Strategies, and Industry Risks |
Research Analyst Overview
- The market continues to evolve, driven by the dynamic needs of various sectors. Contract manufacturing services play a crucial role in ensuring product quality and efficiency, as demonstrated by a leading cosmetic company's decision to outsource production, resulting in a 25% increase in sales. Inventory management, quality assurance testing, and safety data sheets are essential components of PCCM. Contract manufacturers employ rigorous quality control audits and batch processing to maintain GMP compliance and deliver high-quality products. Product lifecycle management, distribution logistics, and stability testing are also critical aspects, ensuring products meet customer demands and regulatory requirements. Formulation development, private label production, and supply chain management require meticulous planning and execution.
- Raw material storage, material handling, and manufacturing efficiency are optimized through automated systems and capacity planning. Cleanroom manufacturing and process validation further enhance the production process. The PCCM industry anticipates continued growth, with expectations of a 6% annual increase in market size. This growth is fueled by the increasing demand for contract manufacturing services, particularly in the cosmetic sector, and the ongoing development of advanced manufacturing technologies. Order fulfillment, packaging design, and product labeling are integral parts of the PCCM value chain. Quality control systems, packaging solutions, and microbiological testing ensure the final product's safety and integrity.
- The ongoing integration of technology, such as automated systems and inventory management tools, further streamlines operations and enhances overall manufacturing efficiency.
What are the Key Data Covered in this Personal Care Contract Manufacturing (PCCM) Market Research and Growth Report?
-
What is the expected growth of the Personal Care Contract Manufacturing (PCCM) Market between 2024 and 2028?
-
USD 7.8 billion, at a CAGR of 6.75%
-
-
What segmentation does the market report cover?
-
The report is segmented by Product Type (Skin care, Hair care, Make-up and cosmetics, and Others), Service (Manufacturing, Packaging, and Custom formulation), Geography (APAC, North America, Europe, Middle East and Africa, and South America), Formulation Type (Conventional and Natural/Organic), and End-use (Mass Market Products, Premium Products, and Niche Products)
-
-
Which regions are analyzed in the report?
-
APAC, North America, Europe, Middle East and Africa, and South America
-
-
What are the key growth drivers and market challenges?
-
Increasing awareness amongst consumers on personal hygiene, High investment expenditures and poor returns
-
-
Who are the major players in the Personal Care Contract Manufacturing (PCCM) Market?
-
AIG Technologies, Albea Services SAS, ANJAC Health and Beauty, Beautech, Cosmetic Group USA Inc., CoValence laboratories, FAREVA SA, Formula Corp., KDC One, KIK Custom Products Inc., Kolmar Korea, McBride Plc, Nutrix International LLC, RCP Ranstadt GmbH, Sarvotham Care Ltd., Tropical Products, UNIVERSAL PACKAGING SYSTEMS Inc., Vi Jon LLC, VVF Ltd., and World Wide Packaging LLC
-
Market Research Insights
- The market is a dynamic and ever-evolving industry that caters to the production needs of various brands and businesses. With a focus on quality, innovation, and efficiency, PCCM companies employ various methodologies such as six sigma, lean manufacturing, and quality management systems to optimize production and ensure product stability. One notable trend in the market is the increasing demand for private label cosmetics and custom formulations. According to industry reports, private label cosmetics accounted for over 20% of the global market share in 2020, with an expected growth of over 7% annually. Additionally, sustainability initiatives, such as ethical sourcing and environmental compliance, are becoming essential factors in the decision-making process for many consumers and brands.
- For instance, a leading PCCM company successfully increased its sales by 15% by implementing a cost reduction strategy that included the use of alternative, eco-friendly packaging materials. This not only helped the company meet the growing demand for sustainable products but also contributed to its competitive edge in the market. Overall, the PCCM market continues to grow and adapt to the changing needs of consumers and businesses, with a focus on quality, innovation, and sustainability.
We can help! Our analysts can customize this personal care contract manufacturing (PCCM) market research report to meet your requirements.
 RIA -
RIA - 
