
Pharmacogenomics Market Size 2025-2029
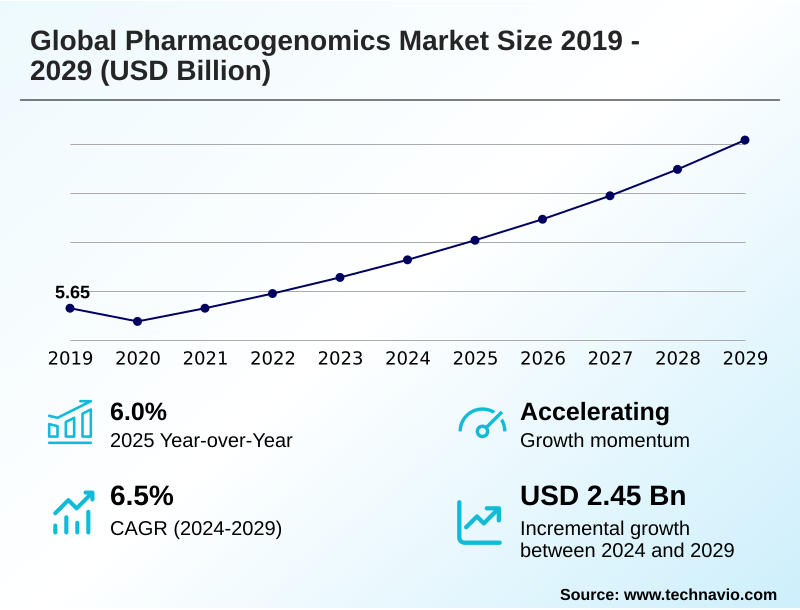
The pharmacogenomics market size is valued to increase by USD 2.45 billion, at a CAGR of 6.5% from 2024 to 2029. Imperative of personalized medicine will drive the pharmacogenomics market.
Major Market Trends & Insights
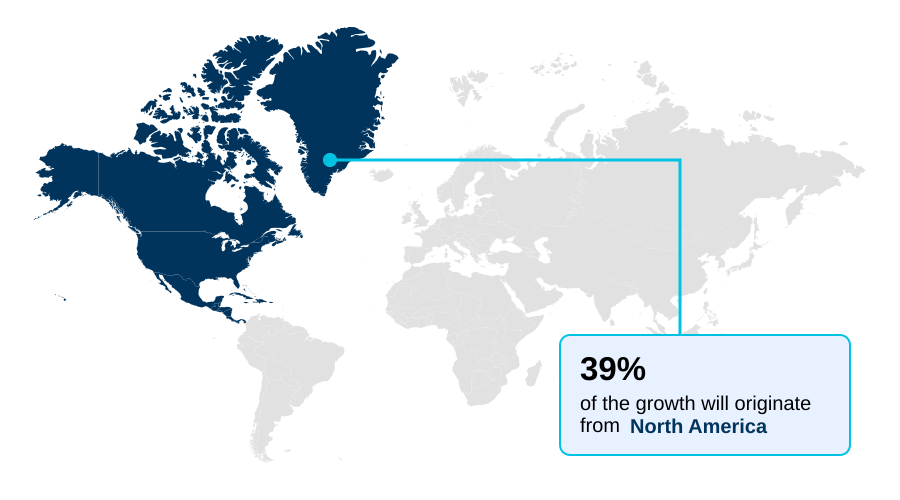
- North America dominated the market and accounted for a 39.2% growth during the forecast period.
- By End-user - Hospitals and clinics segment was valued at USD 3.52 billion in 2023
- By Application - Oncology segment accounted for the largest market revenue share in 2023
Market Size & Forecast
- Market Opportunities: USD 3.44 billion
- Market Future Opportunities: USD 2.45 billion
- CAGR from 2024 to 2029 : 6.5%
Market Summary
- The pharmacogenomics market is fundamentally reshaping therapeutic strategies by analyzing how an individual's genetic makeup influences their response to medication. This shift toward precision medicine is driven by the increasing prevalence of chronic diseases and the growing demand for treatments that offer higher efficacy and fewer adverse effects.
- A key trend is the integration of artificial intelligence to analyze complex genomic datasets, accelerating drug discovery and the identification of novel biomarkers. However, the market faces challenges related to inconsistent reimbursement policies and the need for robust evidence of cost-effectiveness to justify clinical adoption.
- For instance, a hospital system implementing a preemptive testing program must navigate these financial hurdles but can achieve significant long-term value by reducing adverse drug events and optimizing medication selection, which improves patient outcomes and lowers overall healthcare costs.
- The evolving regulatory landscape and the need for standardized testing protocols and clinician education are also critical factors influencing the market's trajectory. As genomic technologies become more accessible, their integration into routine clinical practice is set to become a standard of care.
What will be the Size of the Pharmacogenomics Market during the forecast period?
Get Key Insights on Market Forecast (PDF) Get Free Sample
How is the Pharmacogenomics Market Segmented?
The pharmacogenomics industry research report provides comprehensive data (region-wise segment analysis), with forecasts and estimates in "USD million" for the period 2025-2029, as well as historical data from 2019-2023 for the following segments.
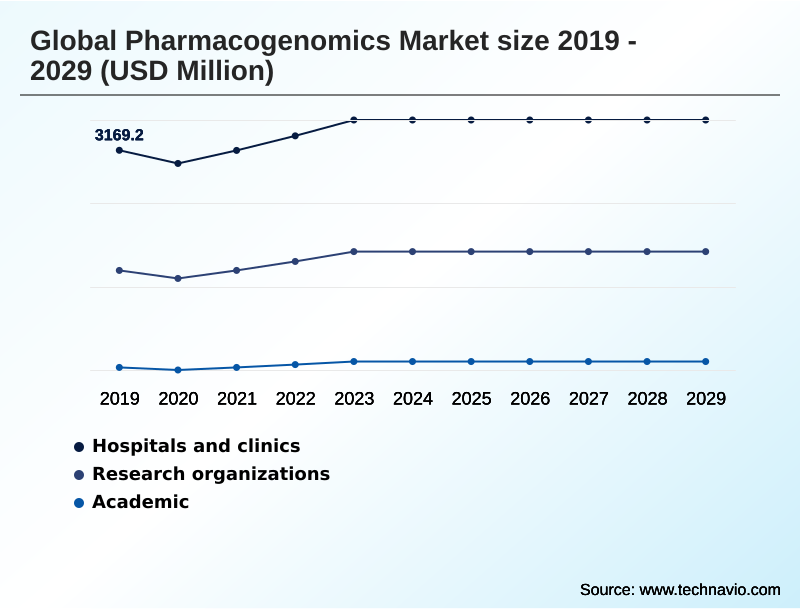
- End-user
- Hospitals and clinics
- Research organizations
- Academic
- Application
- Oncology
- Drug discovery
- Pain management
- Neurology
- Others
- Technology
- Polymerase chain reaction
- DNA sequencing
- Mass spectrometry
- Microarray
- Electrophoresis
- Geography
- North America
- US
- Canada
- Mexico
- Europe
- Germany
- UK
- France
- Asia
- Rest of World (ROW)
- North America
By End-user Insights
The hospitals and clinics segment is estimated to witness significant growth during the forecast period.
Hospitals and clinics are a primary end-user segment, driven by the adoption of preemptive pharmacogenomic testing programs. These initiatives leverage electronic health record integration and clinical decision support tools to improve personalized therapy monitoring.
Following guidelines from bodies like the clinical pharmacogenetics implementation consortium enhances the utility of pgx testing panels, including genesight psychotropic testing, and drives real-world data validation.
One major medical center saw a 35% growth in test volume over a single year after implementation. The goal is to improve cost-effectiveness analysis for targeted therapy development and optimize drug dosing.
This clinical adoption uses a range of methods including mass spectrometry, microarray technology, and electrophoresis techniques to deliver actionable insights at the point of care.
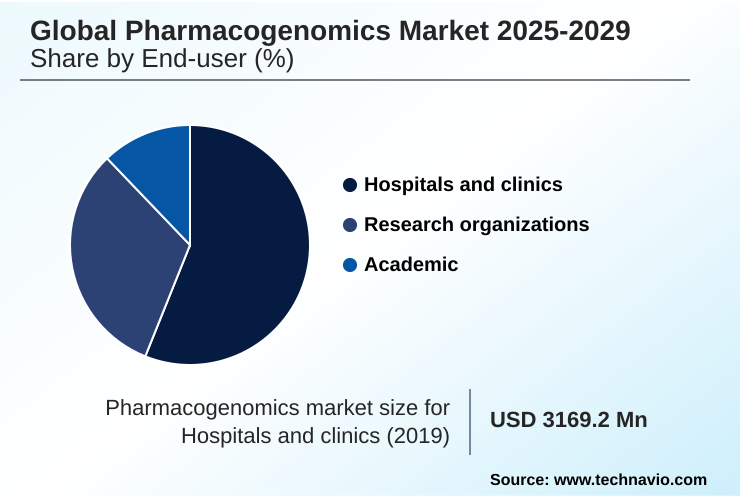
The Hospitals and clinics segment was valued at USD 3.52 billion in 2023 and showed a gradual increase during the forecast period.
Regional Analysis
North America is estimated to contribute 39.2% to the growth of the global market during the forecast period.Technavio’s analysts have elaborately explained the regional trends and drivers that shape the market during the forecast period.
See How Pharmacogenomics Market Demand is Rising in North America Get Free Sample
The geographic landscape of the global pharmacogenomics market is led by North America, which contributes approximately 39.2% of the market's incremental growth, with Europe following at about 34.3%.
This dominance is attributed to advanced healthcare infrastructure, high R&D spending, and early adoption of precision medicine. The region's leadership is supported by the widespread availability of key technologies, including nextseq sequencing platforms and miseq sequencing platforms for advanced research.
The use of applied biosystems pgx taqman assays and ion ampliseq pgx panels is common for routine clinical testing. The market's expansion relies on a steady supply of genomic sequencing reagents and sophisticated tools for genomic variant interpretation.
Key activities include copy number variation detection for oncology and widespread genotyping for cyp450 to guide drug efficacy prediction and ensure safer prescribing.
Market Dynamics
Our researchers analyzed the data with 2024 as the base year, along with the key drivers, trends, and challenges. A holistic analysis of drivers will help companies refine their marketing strategies to gain a competitive advantage.
- The strategic implementation of pharmacogenomics is becoming central to modern healthcare, focusing on optimizing drug discovery with genomic data and standardizing pgx testing protocols globally. A core objective is reducing adverse drug events with genetics, which requires robust ai integration in genomic data analysis to interpret complex information.
- The role of companion diagnostics in cancer therapy continues to expand, driven by next-generation sequencing for oncology biomarker discovery. However, significant hurdles remain, including challenges in pgx clinical implementation and the need to overcome reimbursement hurdles for pgx tests. The evolving regulatory landscape for laboratory-developed tests adds another layer of complexity.
- Demonstrating the cost-effectiveness of preemptive pgx testing is essential for broader adoption. From a technical standpoint, the impact of snps on therapeutic outcomes is a primary area of study, often involving the use of pcr for drug metabolism analysis and microarray technology for genetic screening.
- Key applications extend to pharmacogenomics in pain management strategies and the application of pgx in psychiatric treatment. Effective electronic health record integration strategies and robust clinical decision support for pgx results are crucial for translating data into action. This requires training healthcare providers in genomics and addressing ethical considerations in genetic data privacy.
- Moreover, validating pgx markers in diverse populations using techniques like mass spectrometry in metabolite profiling is critical for ensuring equitable and effective care, with some integrated systems showing the potential to reduce certain adverse events by over 20%.
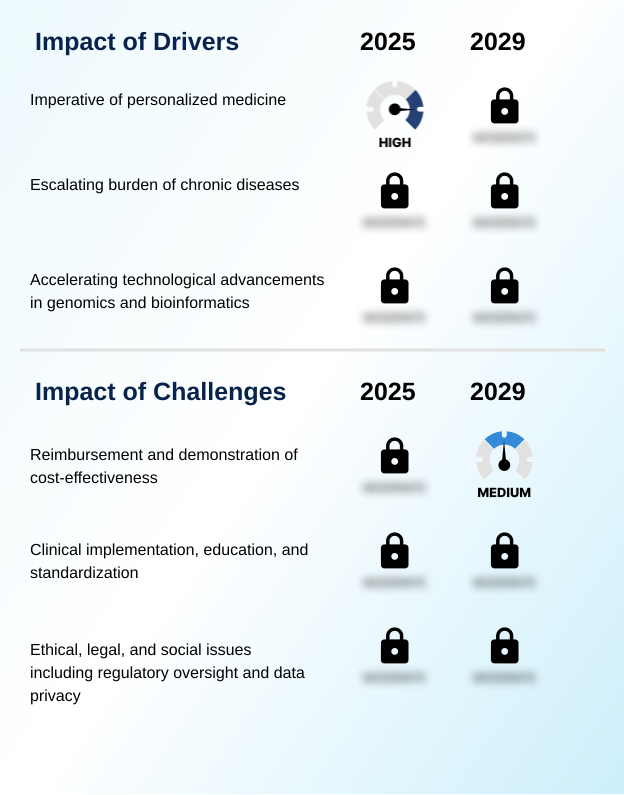
What are the key market drivers leading to the rise in the adoption of Pharmacogenomics Industry?
- The imperative for personalized medicine, which focuses on tailoring medical treatment to individual genetic characteristics, is the primary driver propelling market expansion.
- The market's primary driver is the growing imperative for personalized medicine, supported by a deeper understanding of inherited genetic variations and their effect on treatment outcome prediction.
- The ability to conduct biomarker-based genetic testing for specific single nucleotide polymorphisms and germline genetic variations allows clinicians to anticipate patient responses to therapies.
- This has fueled companion diagnostic development, with companion diagnostic assays now essential for prescribing many targeted drug therapy options. Advances in pgx gene panels enable precise variant detection in critical drug metabolism pathways.
- The push for more robust clinical utility evidence is leading to an increase in studies that demonstrate a direct link between pharmacogenomic biomarker discovery and improved patient outcomes, with personalized therapies now constituting over one-third of new drug approvals.
What are the market trends shaping the Pharmacogenomics Industry?
- The integration of artificial intelligence and machine learning represents a pivotal market trend. This convergence is poised to significantly enhance the precision and efficiency of personalized medicine.
- A key trend shaping the market is the convergence of AI with genomics, leveraging machine learning for advanced multi-omics data analysis and deeper insights into gene expression profiling. This integration enhances the interpretation of complex datasets involving epigenetic factors and metabolic pathways analysis.
- The use of polymerase chain reaction and next-generation sequencing technologies generates the vast data required for these models. This allows for more effective patient population stratification in clinical trials, improving outcomes in drug discovery and development by over 30% in some cases. AI-driven platforms that perform rare allele detection and nucleic acid quantification with high precision are becoming essential.
- These advancements are accelerating the shift from single-gene analysis with tools like the genesight psychotropic testing to comprehensive drug response profiling, with multiplex pcr assays enabling more efficient screening.
What challenges does the Pharmacogenomics Industry face during its growth?
- Navigating complex reimbursement frameworks and demonstrating the definitive cost-effectiveness of testing are key challenges that affect the pace of broad industry adoption.
- A significant market challenge involves navigating the complex laboratory-developed tests regulation and securing consistent reimbursement, which hinges on robust health technology assessment. Payers demand strong evidence for adverse drug reaction reduction and overall cost-effectiveness. This requires extensive preclinical genomic analysis and dna sequencing to validate the utility of molecular diagnostic assays.
- While technologies like droplet digital pcr assays and endopredict panels offer high precision, their upfront costs can be a barrier. The lack of standardized pharmacogenetic assay kits and precision genotyping solutions further complicates widespread adoption.
- The goal is to demonstrate that targeted genetic drug response analysis leads to better drug dosing optimization and helps avoid outcomes like treatment-resistant depression, thereby justifying the investment in tools like qia_seq pgx dna panels.
Exclusive Technavio Analysis on Customer Landscape
The pharmacogenomics market forecasting report includes the adoption lifecycle of the market, covering from the innovator’s stage to the laggard’s stage. It focuses on adoption rates in different regions based on penetration. Furthermore, the pharmacogenomics market report also includes key purchase criteria and drivers of price sensitivity to help companies evaluate and develop their market growth analysis strategies.
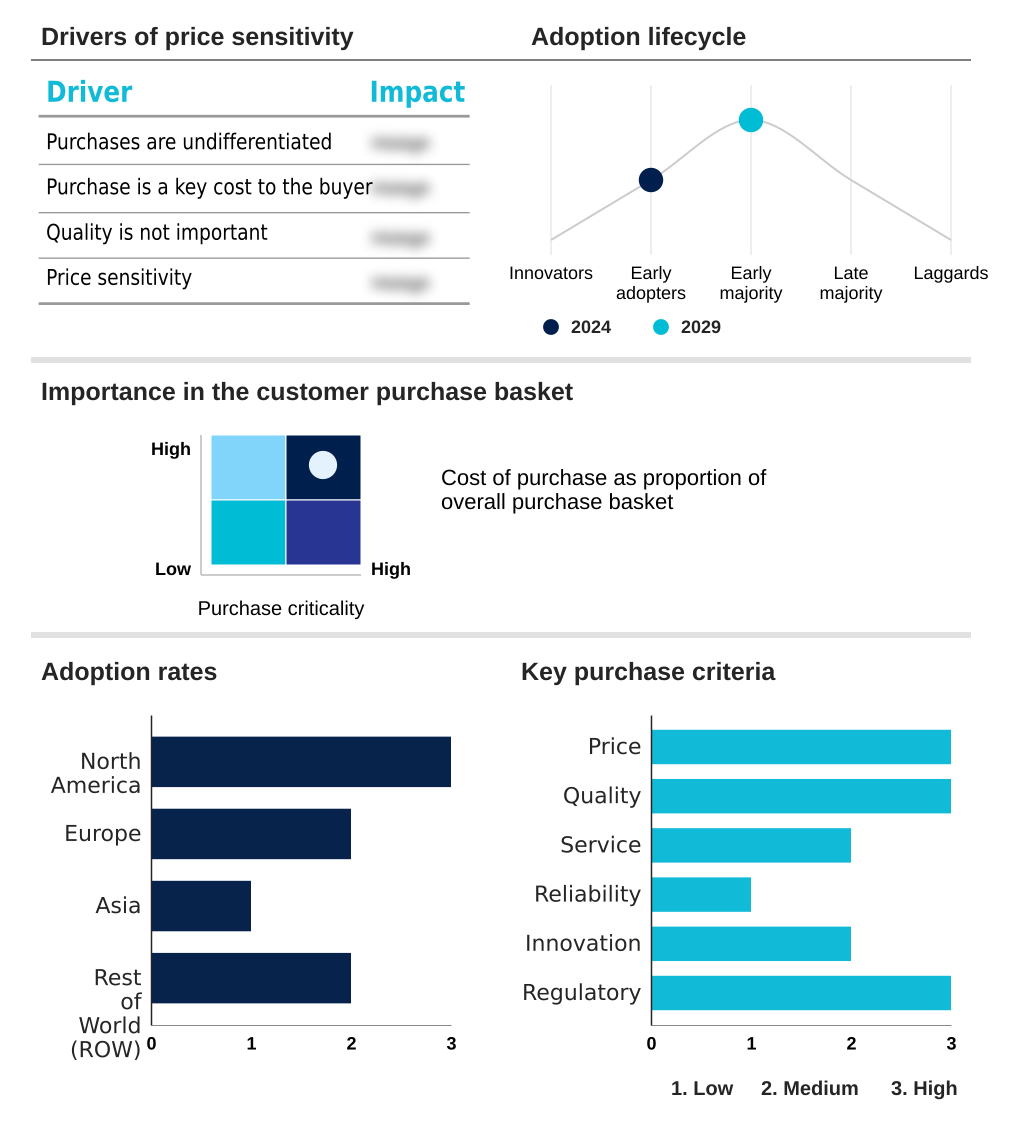
Customer Landscape of Pharmacogenomics Industry
Competitive Landscape
Companies are implementing various strategies, such as strategic alliances, pharmacogenomics market forecast, partnerships, mergers and acquisitions, geographical expansion, and product/service launches, to enhance their presence in the industry.
Abbott Laboratories - Providing molecular diagnostic assays and biomarker-based genetic testing that facilitate precise drug selection and enable personalized therapy monitoring across multiple clinical areas.
The industry research and growth report includes detailed analyses of the competitive landscape of the market and information about key companies, including:
- Abbott Laboratories
- Admera Health
- Agilent Technologies Inc.
- Bayer AG
- Bio Rad Laboratories Inc.
- Charles River Laboratories
- Danaher Corp.
- Eurofins Scientific SE
- F. Hoffmann La Roche Ltd.
- GE Healthcare Technologies
- geneOmbio Technologies Pvt. Ltd.
- Illumina Inc.
- Laboratory Corp.
- Merck and Co. Inc.
- Myriad Genetics Inc.
- OneOme LLC
- QIAGEN N.V.
- Regeneron Pharmaceuticals Inc.
- Thermo Fisher Scientific Inc.
Qualitative and quantitative analysis of companies has been conducted to help clients understand the wider business environment as well as the strengths and weaknesses of key industry players. Data is qualitatively analyzed to categorize companies as pure play, category-focused, industry-focused, and diversified; it is quantitatively analyzed to categorize companies as dominant, leading, strong, tentative, and weak.
Recent Development and News in Pharmacogenomics market
- In November 2024, The European Partnership for Personalised Medicine (EP PerMed) pre-announced its 2025 joint transnational call for proposals, focusing on identifying and validating new pharmacogenomic markers to advance personalized drug treatments.
- In February 2025, Bio-Rad Laboratories announced the acquisition of Stilla Technologies, a move intended to enhance its digital PCR offerings and strengthen its position in the genomics market.
- In April 2025, a leading diagnostics company launched a new direct-to-consumer genetic testing panel focused on cardiovascular drug response, aiming to empower patients with information about their metabolism of common heart medications.
- In May 2025, Regeneron Pharmaceuticals announced the acquisition of the core assets of 23andMe, significantly expanding its genetic data resources to guide future drug development initiatives.
Dive into Technavio’s robust research methodology, blending expert interviews, extensive data synthesis, and validated models for unparalleled Pharmacogenomics Market insights. See full methodology.
| Market Scope | |
|---|---|
| Page number | 306 |
| Base year | 2024 |
| Historic period | 2019-2023 |
| Forecast period | 2025-2029 |
| Growth momentum & CAGR | Accelerate at a CAGR of 6.5% |
| Market growth 2025-2029 | USD 2454.0 million |
| Market structure | Fragmented |
| YoY growth 2024-2025(%) | 6.0% |
| Key countries | US, Canada, Mexico, Germany, UK, France, Italy, Spain, The Netherlands, Sweden, China, Japan, India, South Korea, Singapore, Taiwan, Indonesia, Brazil, South Africa, Saudi Arabia, UAE, Argentina and Turkey |
| Competitive landscape | Leading Companies, Market Positioning of Companies, Competitive Strategies, and Industry Risks |
Research Analyst Overview
- The pharmacogenomics market is advancing through the application of sophisticated technologies and a focus on personalized therapeutic strategies. At the core of this evolution are tools like next-generation sequencing, polymerase chain reaction, and dna sequencing, complemented by microarray technology and electrophoresis techniques for comprehensive genetic analysis.
- The increasing use of molecular diagnostic assays for biomarker-based genetic testing enables precise variant detection. This is supported by platforms such as nextseq and miseq sequencing platforms and specialized tools like the amplichip cyp450 test. Innovations in droplet digital pcr assays and applied biosystems pgx taqman assays are improving accuracy.
- For clinical application, pgx gene panels and pgx testing panels, including genesight psychotropic testing and endopredict panels, are becoming standard. Products like qia_seq pgx dna panels and ion ampliseq pgx panels are critical for targeted analysis. These technologies are crucial for understanding drug metabolism pathways and germline genetic variations, including single nucleotide polymorphisms.
- This has supported a notable increase in companion diagnostic development, with personalized medicines now accounting for over a third of new drug approvals.
- Decisions around preclinical genomic analysis, multi-omics data interpretation, and health technology assessment are now key boardroom topics, influencing R&D budgets and strategic planning based on guidance from bodies like the clinical pharmacogenetics implementation consortium and findings from preemptive pharmacogenomic testing and real-world data validation.
What are the Key Data Covered in this Pharmacogenomics Market Research and Growth Report?
-
What is the expected growth of the Pharmacogenomics Market between 2025 and 2029?
-
USD 2.45 billion, at a CAGR of 6.5%
-
-
What segmentation does the market report cover?
-
The report is segmented by End-user (Hospitals and clinics, Research organizations, and Academic), Application (Oncology, Drug discovery, Pain management, Neurology, and Others), Technology (Polymerase chain reaction, DNA sequencing, Mass spectrometry, Microarray, and Electrophoresis) and Geography (North America, Europe, Asia, Rest of World (ROW))
-
-
Which regions are analyzed in the report?
-
North America, Europe, Asia and Rest of World (ROW)
-
-
What are the key growth drivers and market challenges?
-
Imperative of personalized medicine, Reimbursement and demonstration of cost-effectiveness
-
-
Who are the major players in the Pharmacogenomics Market?
-
Abbott Laboratories, Admera Health, Agilent Technologies Inc., Bayer AG, Bio Rad Laboratories Inc., Charles River Laboratories, Danaher Corp., Eurofins Scientific SE, F. Hoffmann La Roche Ltd., GE Healthcare Technologies, geneOmbio Technologies Pvt. Ltd., Illumina Inc., Laboratory Corp., Merck and Co. Inc., Myriad Genetics Inc., OneOme LLC, QIAGEN N.V., Regeneron Pharmaceuticals Inc. and Thermo Fisher Scientific Inc.
-
Market Research Insights
- The market's momentum is sustained by advancements in genomic data integration and biomarker validation services, which are refining drug discovery and development. The ability to perform precise drug response profiling enables healthcare providers to improve treatment outcome prediction.
- For example, some preemptive testing programs have demonstrated the potential to reduce significant adverse drug reaction incidents by over 25%, showcasing strong clinical utility evidence. Furthermore, the focus on personalized therapy monitoring is intensifying, with advanced companion diagnostic assays now guiding more than a third of new therapeutic approvals in key areas like oncology.
- This data-driven approach enhances the value proposition for payers and providers by linking genetic insights directly to improved patient care and operational efficiencies within healthcare systems.
We can help! Our analysts can customize this pharmacogenomics market research report to meet your requirements.
 RIA -
RIA - 
