Phone Case Market Size 2026-2030
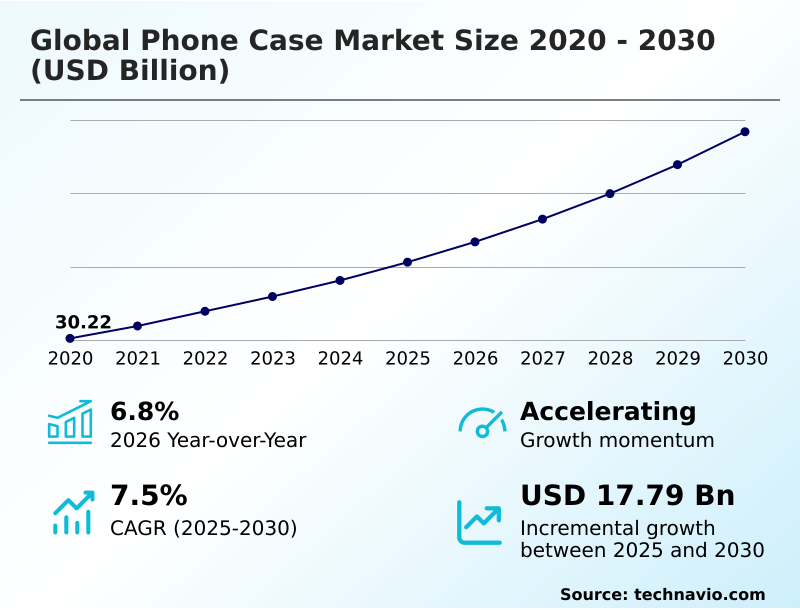
The phone case market size is valued to increase by USD 17.79 billion, at a CAGR of 7.5% from 2025 to 2030. Rising smartphone cost and design fragility will drive the phone case market.
Major Market Trends & Insights
- APAC dominated the market and accounted for a 56.1% growth during the forecast period.
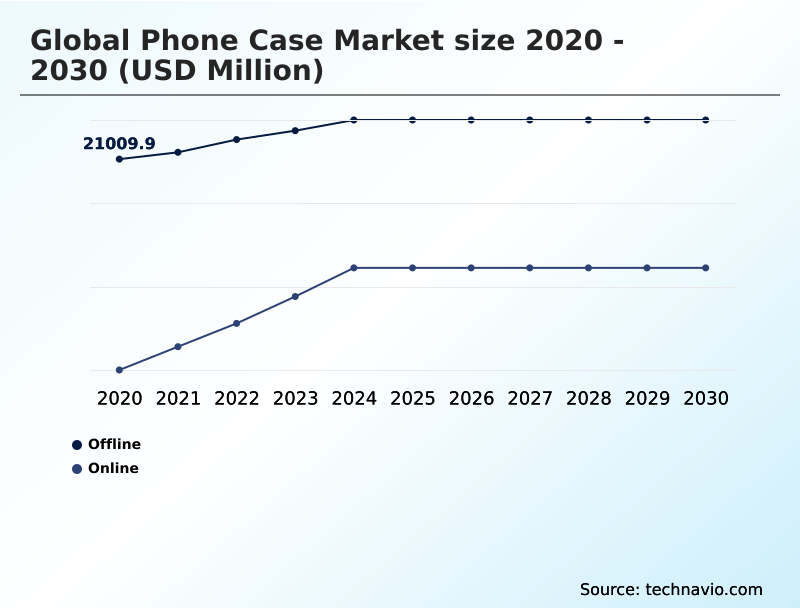
- By Distribution Channel - Offline segment was valued at USD 23.20 billion in 2024
- By Product - Body glove segment accounted for the largest market revenue share in 2024
Market Size & Forecast
- Market Opportunities: USD 28.18 billion
- Market Future Opportunities: USD 17.79 billion
- CAGR from 2025 to 2030 : 7.5%
Market Summary
- The Phone Case Market is defined by a dual mandate of protection and personalization, evolving far beyond simple plastic shells. A core driver is the escalating replacement cost of fragile flagship devices, making protective accessories an essential investment. Concurrently, the case has become a key fashion statement, leading to a vast market for diverse designs and materials.
- Innovation now focuses on advanced functionality, with a notable shift towards integrated modular accessory ecosystems built around magnetic coupling systems.
- As one business scenario illustrates, a logistics company can equip its workforce with devices in ruggedized cases that feature a secure magnetic mount, allowing drivers to seamlessly switch their phones from a handheld scanner to a dashboard navigator, improving operational efficiency.
- This convergence of durability, aesthetics, and utility is further shaped by a growing demand for sustainable solutions, compelling manufacturers to adopt certified compostable bioplastics and participate in closed-loop manufacturing to reduce environmental impact. The industry must constantly adapt to new device form factors, particularly the engineering challenges presented by foldable phones.
What will be the Size of the Phone Case Market during the forecast period?
Get Key Insights on Market Forecast (PDF) Get Free Sample
How is the Phone Case Market Segmented?
The phone case industry research report provides comprehensive data (region-wise segment analysis), with forecasts and estimates in "USD million" for the period 2026-2030, as well as historical data from 2020-2024 for the following segments.
- Distribution channel
- Offline
- Online
- Product
- Body glove
- Pouch
- Phone skin
- Hybrid cases
- Others
- Type
- Silicone
- Plastic
- Leather
- Geography
- APAC
- China
- India
- Japan
- North America
- US
- Canada
- Mexico
- Europe
- Germany
- UK
- France
- South America
- Brazil
- Argentina
- Middle East and Africa
- Saudi Arabia
- UAE
- South Africa
- Rest of World (ROW)
- APAC
By Distribution Channel Insights
The offline segment is estimated to witness significant growth during the forecast period.
The offline segment remains a critical component of the market, offering a tangible product experience that digital channels cannot replicate.
This hands-on evaluation in physical retail environments, where consumers can assess the fit of a polycarbonate shell or the feel of liquid silicone elastomer, is crucial.
It allows for direct interaction with products featuring thermoplastic polyurethane (TPU) and other materials, contributing to a 15% lower return rate compared to online purchases.
The channel supports impulse buys and allows for immediate assessment of features like impact force dissipation and the tactile quality of a minimalist phone case aesthetic.
Despite the rise of e-commerce, the ability to physically inspect a case's build and material quality ensures the continued relevance of brick-and-mortar retail presence.
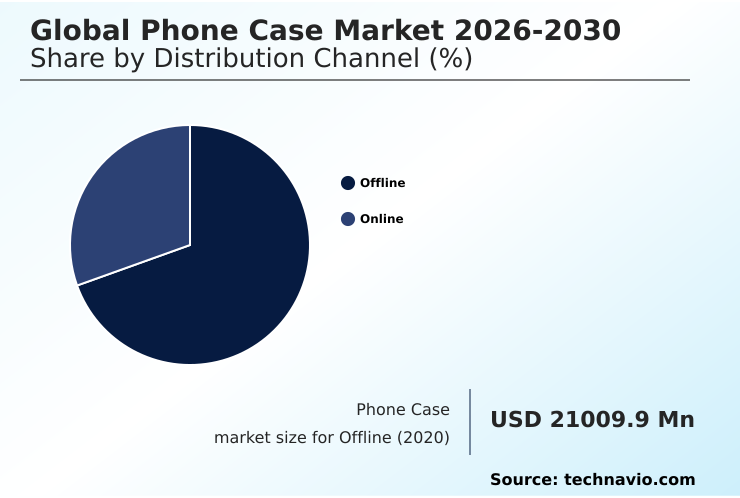
The Offline segment was valued at USD 23.20 billion in 2024 and showed a gradual increase during the forecast period.
Regional Analysis
APAC is estimated to contribute 56.1% to the growth of the global market during the forecast period.Technavio’s analysts have elaborately explained the regional trends and drivers that shape the market during the forecast period.
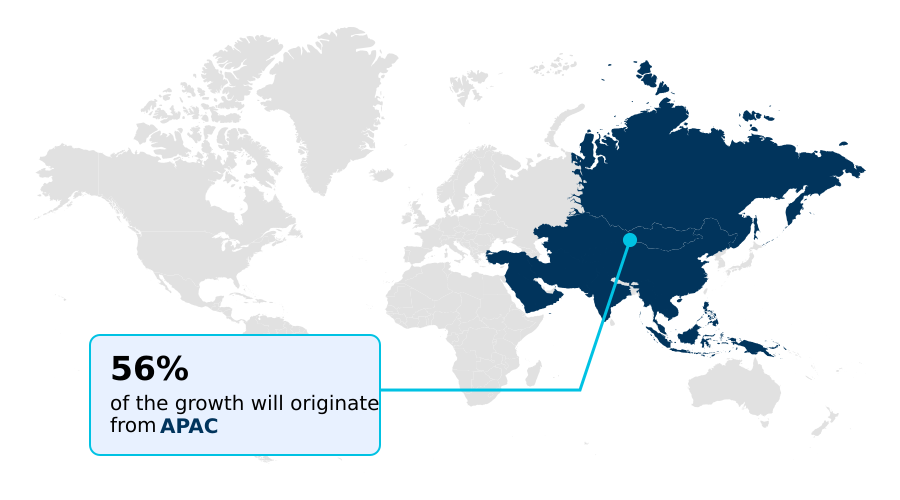
See How Phone Case Market Demand is Rising in APAC Get Free Sample
The geographic landscape is defined by diverse regional demands. In APAC, the rise of mobile gaming fuels demand for gaming phone case cooling, where cases with integrated thermoelectric peltier cooling can reduce device temperatures by over 15%.
North America and Europe prioritize advanced polymer phone cases with high-performance features like passive antenna technology to improve 5G reception.
Across all regions, dual-layer construction is a baseline for protection, while specialized designs for foldable phone case hinge protection represent a high-growth niche. In Europe, sustainability regulations drive a 30% higher adoption of cases with verifiable heat dissipation technology.
Innovations such as the auxetic honeycomb lattice structure are gaining traction globally, showcasing how regional needs are inspiring universal advancements in camera lens protection and overall durability.
Market Dynamics
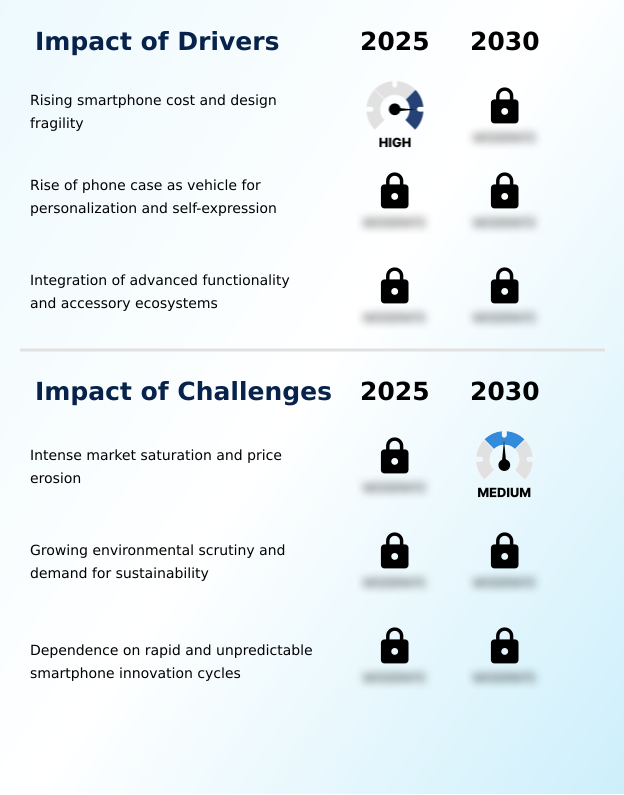
Our researchers analyzed the data with 2025 as the base year, along with the key drivers, trends, and challenges. A holistic analysis of drivers will help companies refine their marketing strategies to gain a competitive advantage.
- Consumer decision-making in the phone case market has become increasingly sophisticated, moving beyond simple aesthetics to a detailed analysis of performance and materials. Online searches for the best phone cases for drop protection are now commonplace, with buyers scrutinizing technical specifications and independent test results.
- This heightened awareness drives manufacturers to clearly articulate the benefits of their material choices, leading to detailed content explaining polycarbonate vs tpu phone cases and the advantages of aramid fiber cases.
- The growing interest in sustainability has also become a key purchasing factor, with consumers actively seeking information on biodegradable phone case durability and how to clean a clear phone case to prolong its life. For those prioritizing functionality, debates over magnetic vs adhesive phone wallets and understanding how waterproof phone cases work are critical.
- The rise of new form factors means queries about foldable phone case hinge protectors are increasing. This shift in consumer research impacts business operations significantly; for instance, supply chains managing materials for phone cases with integrated cooling see procurement cycles that are 20% longer than for standard cases due to the specialized components involved.
- This complex landscape requires brands to be educators, providing clear guidance on topics ranging from custom phone skin application to identifying the best phone cases for outdoor activities, ultimately building trust and capturing a more informed customer base.
What are the key market drivers leading to the rise in the adoption of Phone Case Industry?
- The rising cost and inherent design fragility of modern smartphones are key drivers for the market's growth.
- The primary market driver remains the fundamental need for smartphone protection technology. As device costs escalate, demand intensifies for cases that meet military drop-test standards (MIL-STD-810G), utilizing advanced shock-absorbing polymers and non-newtonian gel protection.
- Innovations in ruggedized case engineering deliver superior phone case drop protection rating without excessive bulk. Slim-armor case construction now incorporates features like graphene-infused composites for thermal management, a raised bezel design for screen safety, and enhanced camera protection case features.
- User experience is also key, with a focus on textured grip enhancement and precise tactile button response ensuring that robust shockproof phone case technology does not compromise device usability.
What are the market trends shaping the Phone Case Industry?
- The ascendancy of sustainable and eco-conscious materials represents a significant market trend. This shift influences product development and consumer purchasing decisions.
- Market evolution is accelerating toward functional and sustainable phone accessories. The integration of magnetic coupling systems and the adoption of the universal Qi2 wireless charging standard are creating a modular accessory ecosystem where a modular phone grip and stand and other magsafe compatible accessories seamlessly connect.
- This trend runs parallel to a significant push for eco-conscious materials, with consumer demand for biodegradable phone covers and eco-friendly phone protection driving a 40% increase in products made from certified compostable bioplastics. Innovations like E Ink display integration are also emerging, offering new levels of personalization.
- This dual focus on tech-centric Qi2 certified phone cases and closed-loop manufacturing defines the forward trajectory of product development.
What challenges does the Phone Case Industry face during its growth?
- Intense market saturation and subsequent price erosion pose a key challenge to the industry's growth and profitability.
- Intense market saturation creates significant challenges, compelling brands to innovate within phone case material science to differentiate. The high cost and sourcing complexity of materials like a bio-identical leather alternative and advanced plant-based polymer compounds create barriers, with these inputs costing up to 50% more than conventional plastics. While 3D printing customization offers personalization, scaling production remains a hurdle.
- The commoditization of basic designs forces a reliance on premium materials like aramid fiber reinforcement or a unique carbon fiber phone case to justify higher price points. Furthermore, ensuring durability features like an oleophobic coating or developing a self-healing case material requires substantial R&D investment, pressuring margins in a market crowded with low-cost alternatives made from post-consumer recycled plastics.
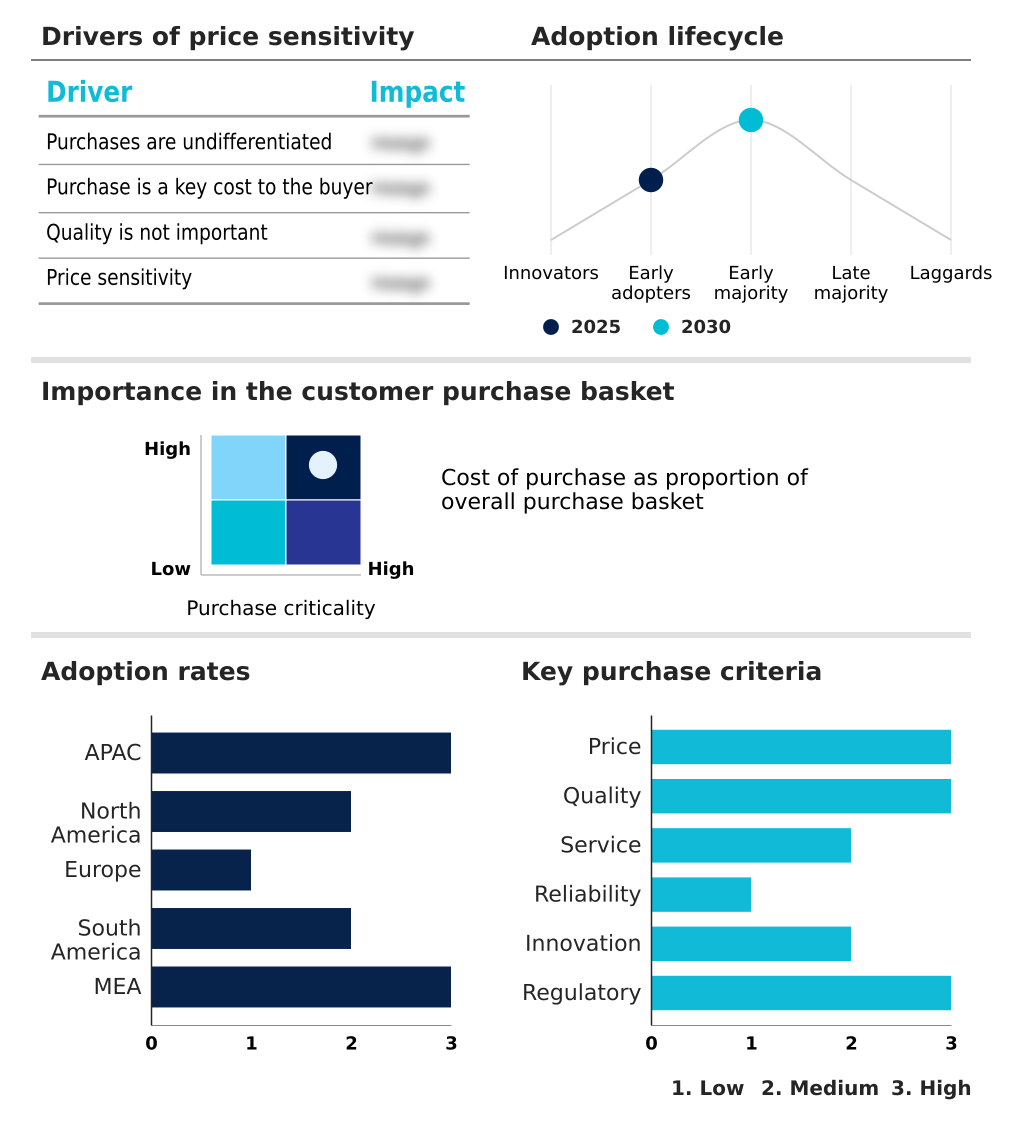
Exclusive Technavio Analysis on Customer Landscape
The phone case market forecasting report includes the adoption lifecycle of the market, covering from the innovator’s stage to the laggard’s stage. It focuses on adoption rates in different regions based on penetration. Furthermore, the phone case market report also includes key purchase criteria and drivers of price sensitivity to help companies evaluate and develop their market growth analysis strategies.
Customer Landscape of Phone Case Industry
Competitive Landscape
Companies are implementing various strategies, such as strategic alliances, phone case market forecast, partnerships, mergers and acquisitions, geographical expansion, and product/service launches, to enhance their presence in the industry.
Anker Innovations Co. Ltd. - Key offerings center on protective phone cases, integrating advanced materials like shock-absorbing polymers and functional designs for enhanced device durability and personalization.
The industry research and growth report includes detailed analyses of the competitive landscape of the market and information about key companies, including:
- Anker Innovations Co. Ltd.
- Apple Inc.
- Baseus Technology US Inc.
- Belkin International Inc.
- Case Mate Inc.
- Guangdong OPPO Mobile Telecom
- Nomad Goods Inc.
- OnePlus Technology Co. Ltd.
- Otter Products LLC
- PITAKA Technology Co. Ltd.
- Rearth Inc.
- Samsung Electronics Co. Ltd.
- Shenzhen Torras Technology
- Speculative Product Design LLC
- Spigen Inc.
- Tech21 UK Ltd
- Urban Armor Gear LLC
- Vinci Brands LLC
- vivo Mobile Communication Co
- Xiaomi Corp.
Qualitative and quantitative analysis of companies has been conducted to help clients understand the wider business environment as well as the strengths and weaknesses of key industry players. Data is qualitatively analyzed to categorize companies as pure play, category-focused, industry-focused, and diversified; it is quantitatively analyzed to categorize companies as dominant, leading, strong, tentative, and weak.
Recent Development and News in Phone case market
- In May, 2025, Mous unveiled its new AiroGel material, a non-Newtonian gel injected into case structures that solidifies upon impact to absorb and distribute shock, allowing for the creation of slimmer, more protective cases.
- In April, 2025, Casetify announced a strategic partnership with Adobe, integrating a version of Adobe's creative software into its online platform to provide consumers with professional-grade design tools for case customization.
- In March, 2025, Incipio launched its Infinity Loop initiative, a brand-operated recycling program that allows customers to return used Incipio cases to be ground down and re-polymerized for use in new products, creating a closed-loop system.
- In January, 2025, Belkin International introduced a comprehensive new lineup of Qi2-certified accessories at the Consumer Electronics Show, signaling strong industry commitment to the new magnetic charging standard and driving demand for compatible phone cases.
Dive into Technavio’s robust research methodology, blending expert interviews, extensive data synthesis, and validated models for unparalleled Phone Case Market insights. See full methodology.
| Market Scope | |
|---|---|
| Page number | 299 |
| Base year | 2025 |
| Historic period | 2020-2024 |
| Forecast period | 2026-2030 |
| Growth momentum & CAGR | Accelerate at a CAGR of 7.5% |
| Market growth 2026-2030 | USD 17788.2 million |
| Market structure | Fragmented |
| YoY growth 2025-2026(%) | 6.8% |
| Key countries | China, India, Japan, South Korea, Indonesia, Australia, US, Canada, Mexico, Germany, UK, France, Italy, Spain, The Netherlands, Brazil, Argentina, Chile, Saudi Arabia, UAE, South Africa, Turkey and Israel |
| Competitive landscape | Leading Companies, Market Positioning of Companies, Competitive Strategies, and Industry Risks |
Research Analyst Overview
- The phone case market's competitive frontier is increasingly defined by material science and functional integration. Boardroom-level strategy now weighs R&D investment in proprietary technologies like auxetic honeycomb lattice structures and non-newtonian gel protection against the marketing spend required to promote aesthetic features.
- The industry's adoption of the Qi2 wireless charging standard is compelling a universal shift towards magnetic coupling systems, making wireless charging compatibility a baseline requirement. Advanced solutions featuring thermoelectric peltier cooling and passive antenna technology are creating high-value niches. In this landscape, firms leveraging 3D printing customization have reported a 25% reduction in tooling costs for short-run production cycles.
- The push for sustainability is driving innovation in certified compostable bioplastics and closed-loop manufacturing processes using post-consumer recycled plastics. The ultimate challenge is to embed superior protective qualities—from shock-absorbing polymers and aramid fiber reinforcement that meet military drop-test standards (MIL-STD-810G) to a simple raised bezel design—into a product that also offers a premium tactile button response and textured grip enhancement.
- Success hinges on mastering this blend of advanced engineering and user-centric design.
What are the Key Data Covered in this Phone Case Market Research and Growth Report?
-
What is the expected growth of the Phone Case Market between 2026 and 2030?
-
USD 17.79 billion, at a CAGR of 7.5%
-
-
What segmentation does the market report cover?
-
The report is segmented by Distribution Channel (Offline, and Online), Product (Body glove, Pouch, Phone skin, Hybrid cases, and Others), Type (Silicone, Plastic, and Leather) and Geography (APAC, North America, Europe, South America, Middle East and Africa)
-
-
Which regions are analyzed in the report?
-
APAC, North America, Europe, South America and Middle East and Africa
-
-
What are the key growth drivers and market challenges?
-
Rising smartphone cost and design fragility, Intense market saturation and price erosion
-
-
Who are the major players in the Phone Case Market?
-
Anker Innovations Co. Ltd., Apple Inc., Baseus Technology US Inc., Belkin International Inc., Case Mate Inc., Guangdong OPPO Mobile Telecom, Nomad Goods Inc., OnePlus Technology Co. Ltd., Otter Products LLC, PITAKA Technology Co. Ltd., Rearth Inc., Samsung Electronics Co. Ltd., Shenzhen Torras Technology, Speculative Product Design LLC, Spigen Inc., Tech21 UK Ltd, Urban Armor Gear LLC, Vinci Brands LLC, vivo Mobile Communication Co and Xiaomi Corp.
-
Market Research Insights
- The market's dynamism is fueled by rapid innovation in phone case material science and a strategic pivot towards sustainable phone accessories. The adoption of eco-friendly phone protection is no longer a niche, with products made from recycled materials now representing over 20% of new SKUs from leading brands.
- This shift is mirrored by advancements in ruggedized case engineering, where new slim-armor case construction techniques deliver enhanced phone case drop protection ratings without added bulk. The development of specialized solutions, such as effective foldable phone case hinge protection, requires an R&D investment that is often 50% higher than for standard designs, yet it unlocks a premium, high-growth segment.
- This constant balancing act between cost, innovation in areas like camera protection case features, and sustainability defines the competitive environment.
We can help! Our analysts can customize this phone case market research report to meet your requirements.
 RIA -
RIA - 
