Pizza Market Size 2026-2030
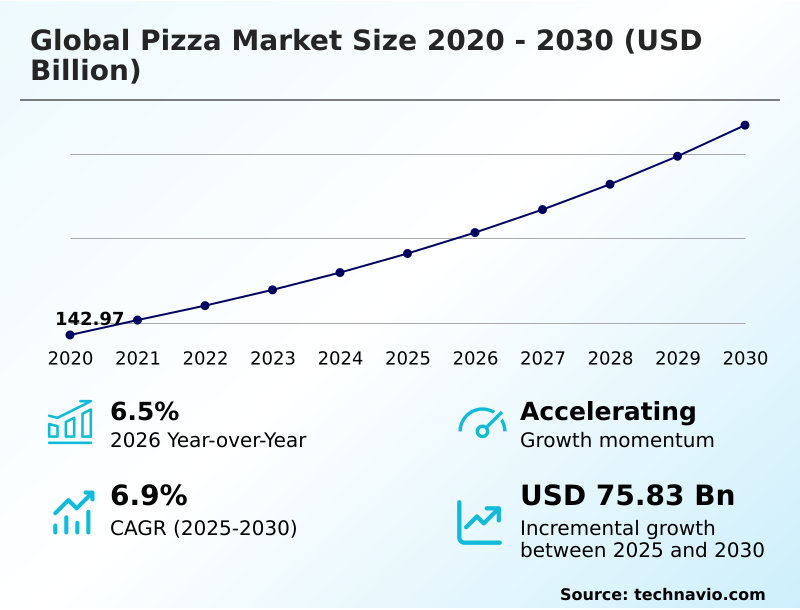
The pizza market size is valued to increase by USD 75.83 billion, at a CAGR of 6.9% from 2025 to 2030. Technological integration and digital ordering ecosystem will drive the pizza market.
Major Market Trends & Insights
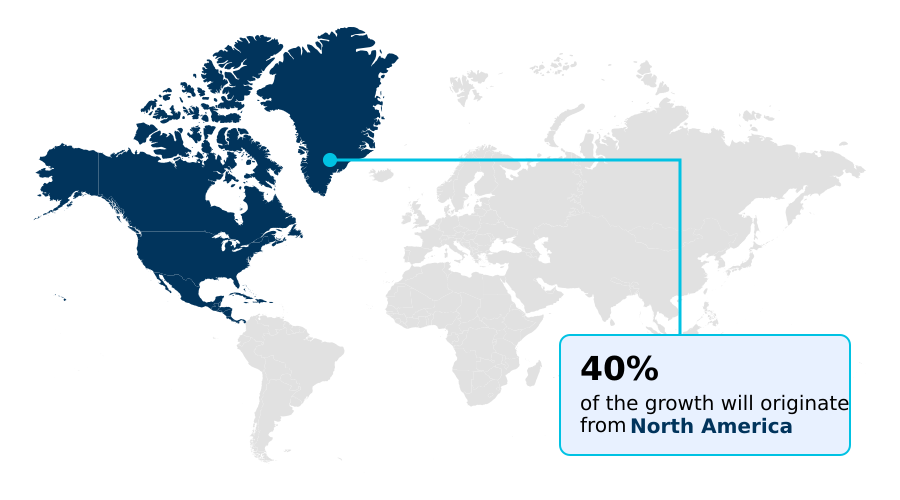
- North America dominated the market and accounted for a 39.9% growth during the forecast period.
- By Distribution Channel - Quick service restaurants (QSR) segment was valued at USD 104.30 billion in 2024
- By Type - Non-vegetarian pizza segment accounted for the largest market revenue share in 2024
Market Size & Forecast
- Market Opportunities: USD 123.98 billion
- Market Future Opportunities: USD 75.83 billion
- CAGR from 2025 to 2030 : 6.9%
Market Summary
- The pizza market is defined by a dynamic interplay of culinary innovation and technological advancement. A key driver is the consumer shift towards convenience, which has accelerated the adoption of digital platforms for ordering and delivery.
- Simultaneously, there is a growing demand for premium and health-conscious options, leading to the proliferation of artisanal ingredients, plant-based proteins, and specialized dough formulations like gluten-free alternatives. This creates a competitive landscape where differentiation is crucial.
- For instance, a business scenario involves leveraging data analytics to optimize supply chains for perishable artisanal ingredients, ensuring freshness while managing costs across a distributed franchise network. This requires a sophisticated approach to inventory management and logistics to maintain quality and profitability.
- Challenges such as rising operational costs and intense competition compel operators to innovate continuously, balancing traditional appeal with modern consumer expectations for quality, health, and sustainability.
What will be the Size of the Pizza Market during the forecast period?
Get Key Insights on Market Forecast (PDF) Get Free Sample
How is the Pizza Market Segmented?
The pizza industry research report provides comprehensive data (region-wise segment analysis), with forecasts and estimates in "USD million" for the period 2026-2030, as well as historical data from 2020-2024 for the following segments.
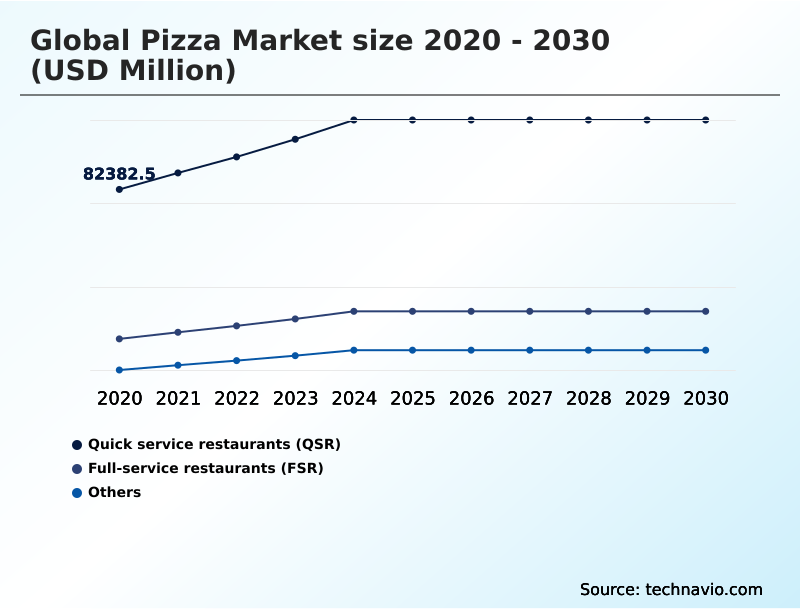
- Distribution channel
- Quick service restaurants (QSR)
- Full-service restaurants (FSR)
- Others
- Type
- Non-vegetarian pizza
- Vegetarian pizza
- Product type
- Fresh
- Frozen
- Chilled
- Geography
- North America
- US
- Canada
- Mexico
- Europe
- UK
- Germany
- France
- APAC
- India
- China
- Japan
- Middle East and Africa
- Saudi Arabia
- UAE
- South Africa
- South America
- Brazil
- Argentina
- Rest of World (ROW)
- North America
By Distribution Channel Insights
The quick service restaurants (qsr) segment is estimated to witness significant growth during the forecast period.
The quick service restaurants segment is characterized by a high degree of operational efficiency, prioritizing convenience and value through a digital-first strategy.
This model leverages a robust digital ordering ecosystem to facilitate a seamless customer journey, from mobile app ordering to last-mile delivery.
The integration of smart-ordering kiosks and real-time order tracking has become standard, with some operators exploring automated vending technology for high-traffic locations.
This focus on speed and volume, supported by kitchen automation, has allowed leading operators to reduce average order processing time by over 20%.
The segment's physical footprint is optimized for high-volume throughput, with an emphasis on takeaway and delivery capabilities over large dining areas, which is key for customer retention and maintaining brand loyalty.
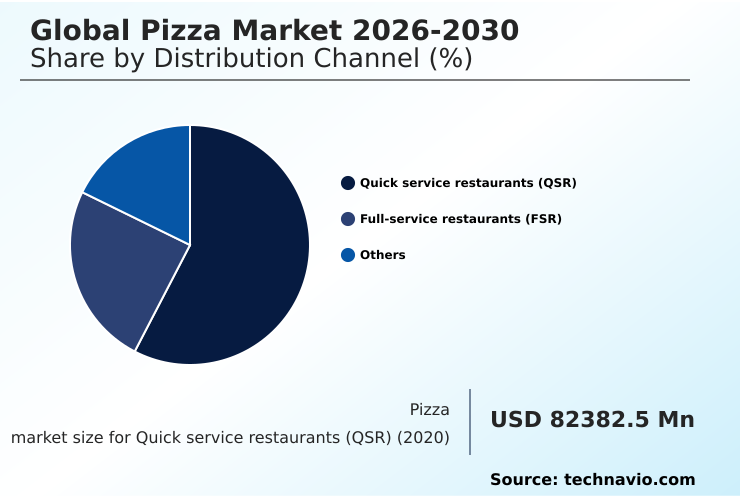
The Quick service restaurants (QSR) segment was valued at USD 104.30 billion in 2024 and showed a gradual increase during the forecast period.
Regional Analysis
North America is estimated to contribute 39.9% to the growth of the global market during the forecast period.Technavio’s analysts have elaborately explained the regional trends and drivers that shape the market during the forecast period.
See How Pizza Market Demand is Rising in North America Get Free Sample
The global geographic landscape is marked by stark regional contrasts. The APAC region is the fastest-growing market, with its expansion rate of 10.1% nearly doubling that of Europe.
This growth is driven by rapid urbanization and the rising disposable income of a young demographic. In these emerging markets, culinary innovation and regional flavor adaptation are critical for success.
Conversely, the mature North America market, which accounts for nearly 40% of the market's incremental growth, is characterized by intense competition and a focus on premiumization and fast-casual offerings.
Here, the emphasis is on wood-fired preparation, artisanal ingredients, and gluten-free alternatives to cater to sophisticated consumer palates.
In Europe, a strong focus on geographically protected ingredients and sustainable-design locations reflects high consumer awareness and regulatory pressures, influencing both product development and operational strategies.
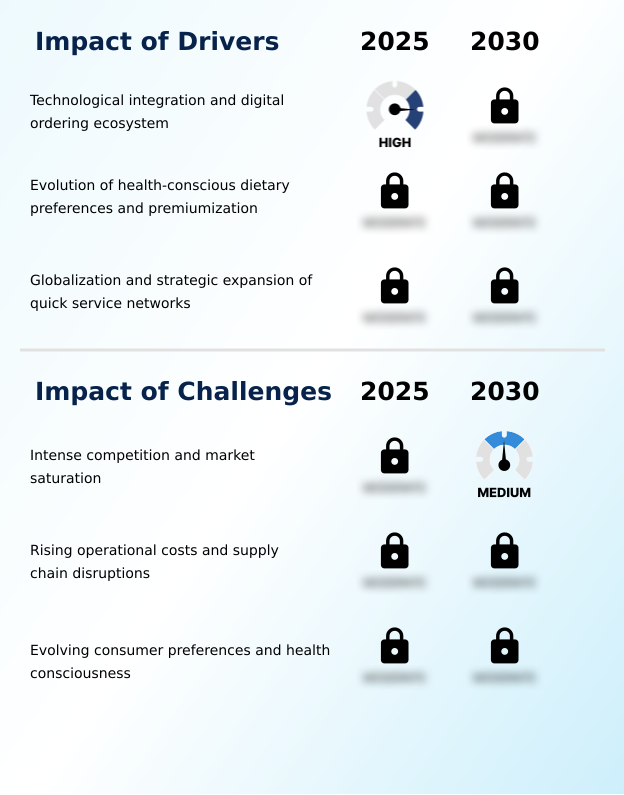
Market Dynamics
Our researchers analyzed the data with 2025 as the base year, along with the key drivers, trends, and challenges. A holistic analysis of drivers will help companies refine their marketing strategies to gain a competitive advantage.
- The strategic direction of the global pizza market 2026-2030 is increasingly shaped by a confluence of technological and consumer-driven imperatives. The impact of digital ordering on the global pizza market 2026-2030 has been transformative, creating a foundation for hyper-personalization using AI in the global pizza market 2026-2030, where customer data analytics for pizza menu engineering allows for dynamic menu adjustments.
- This digital shift extends to operational efficiencies, with AI-driven logistics optimization for pizza delivery becoming a key competitive differentiator. Concurrently, health-conscious preferences in the global pizza market 2026-2030 are driving the development of plant-based alternatives in the global pizza market 2026-2030 and compelling companies to focus on a premiumization strategies for fast-casual pizza chains.
- Sustainable practices in the global pizza market 2026-2030 are also moving from a niche concern to a core business strategy, with an emphasis on integrating circular economy in pizza business models and developing carbon-neutral crusts for retail pizza.
- As franchise network expansion in the global pizza market 2026-2030 continues, operators face rising operational costs in the global pizza market 2026-2030 and market saturation challenges in the global pizza market 2026-2030. To mitigate these issues, companies are exploring robotic automation in commercial pizza kitchens and advanced vending machine technology for hot pizza.
- Furthermore, ensuring supply chain integrity through innovations like blockchain for pizza ingredient traceability is critical for managing supply chain disruptions in the pizza industry. The growth of gourmet fusion offerings in the global pizza market 2026-2030 and the need for an effective omnichannel retail strategy for frozen pizza highlight the market's complexity.
- Success now depends on balancing these diverse factors, where third-party aggregator integration for pizzerias must coexist with direct-to-consumer channels.
What are the key market drivers leading to the rise in the adoption of Pizza Industry?
- The integration of technology and the development of a sophisticated digital ordering ecosystem serve as primary drivers propelling market expansion.
- Market growth is significantly propelled by technological integration and strategic expansion. The digital ordering ecosystem, powered by advanced data analytics, enables a higher degree of customer retention and is fundamental to modern operations.
- This is complemented by the franchise model scalability, which allows for rapid entry into emerging markets. On the product front, the evolution of proprietary dough, including carbon-neutral crusts and high-fiber crusts, caters to health-conscious consumers.
- The implementation of kitchen automation has been shown to increase order accuracy by over 98% in high-volume settings.
- Furthermore, a focus on the premiumization of toppings, such as artisanal cured meats, and regional flavor adaptation helps brands differentiate in a crowded market, supported by robust customer loyalty programs and a commitment to digital payment systems.
What are the market trends shaping the Pizza Industry?
- The market is undergoing a transformative shift toward hyper-personalization, which is driven by the integration of artificial intelligence and advanced data analytics to create unique customer journeys.
- Key market trends are centered on hyper-personalization and sustainability. The use of generative artificial intelligence and machine learning algorithms allows for dynamic menu interfaces that cater to individual preferences, with platforms using these tools showing a 15% uplift in average order value. This digital transformation is reshaping brand loyalty.
- Concurrently, a zero-waste initiative is gaining traction, with a push toward a circular packaging system and biodegradable packaging. This focus on carbon neutrality is also driving the adoption of electric vehicle delivery fleets. Culinary innovation is another major trend, seen in the rise of culinary fusion and specialty sauces.
- This trend is accompanied by the growing popularity of plant-based proteins and plant-based meat substitutes, reflecting a broader shift in consumer dietary habits and ethical supply chains.
What challenges does the Pizza Industry face during its growth?
- Intense competition and market saturation, particularly within developed regions, present a significant challenge to sustained industry growth.
- The market faces significant hurdles from intense competition and rising operational costs. The proliferation of food delivery applications and third-party delivery aggregators has heightened rivalry, making it difficult for brands to maintain margins. Operators are contending with a 10% year-over-year increase in key ingredient costs, such as for cheese and specialty meats.
- This pressure is compounded by supply chain logistics issues and disruptions in cold-chain logistics, which can impact product quality. Another challenge is the need for constant culinary innovation to meet evolving consumer tastes, such as the demand for dairy-free cheese alternatives and low-sodium toppings.
- Managing these pressures while investing in new technologies like a predictive logistics suite and maintaining brand integrity poses a considerable challenge for market participants.
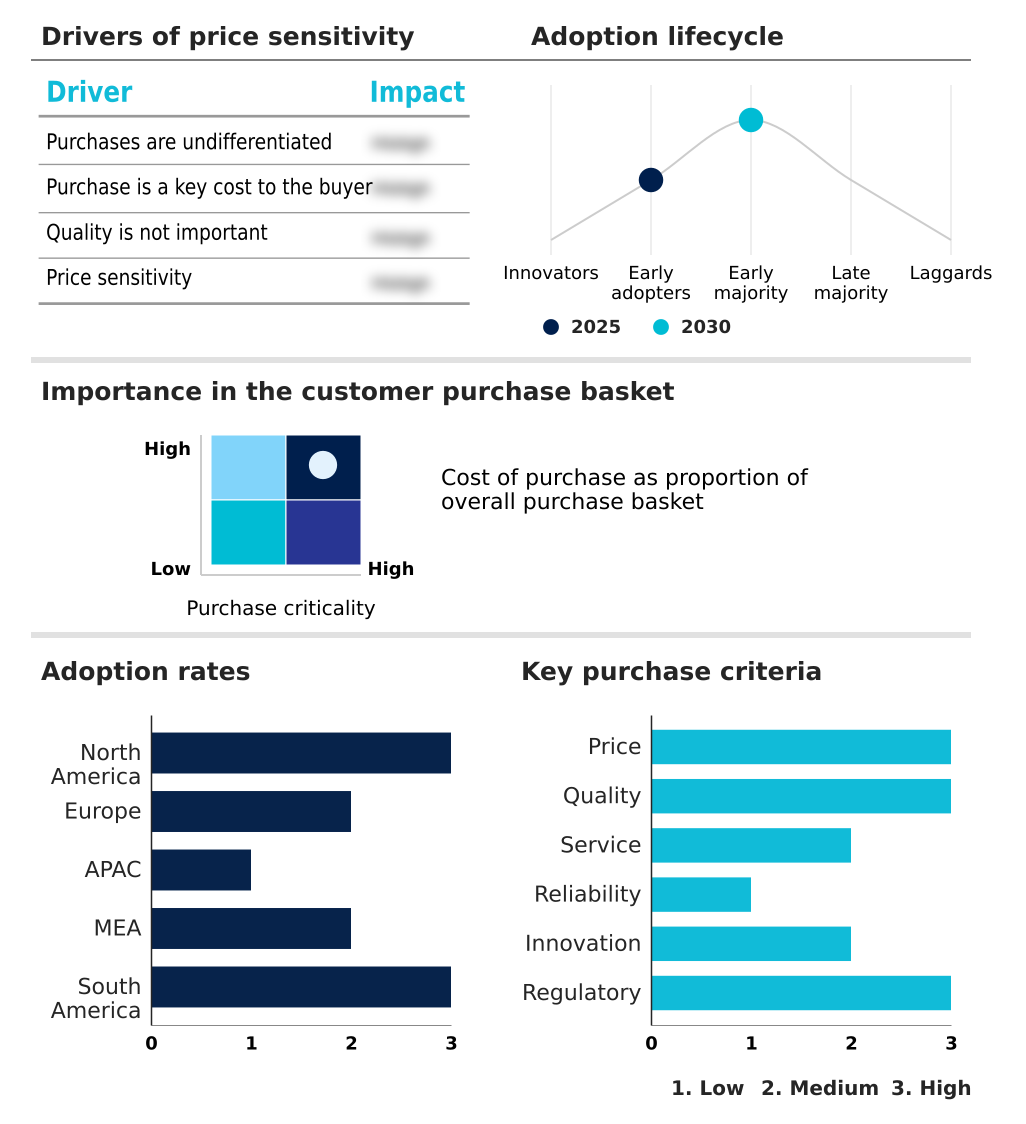
Exclusive Technavio Analysis on Customer Landscape
The pizza market forecasting report includes the adoption lifecycle of the market, covering from the innovator’s stage to the laggard’s stage. It focuses on adoption rates in different regions based on penetration. Furthermore, the pizza market report also includes key purchase criteria and drivers of price sensitivity to help companies evaluate and develop their market growth analysis strategies.
Customer Landscape of Pizza Industry
Competitive Landscape
Companies are implementing various strategies, such as strategic alliances, pizza market forecast, partnerships, mergers and acquisitions, geographical expansion, and product/service launches, to enhance their presence in the industry.
Blaze Pizza LLC - A technology-centric model emphasizing digital ordering platforms and highly efficient supply chain logistics underpins its dominant position in the pizza delivery market.
The industry research and growth report includes detailed analyses of the competitive landscape of the market and information about key companies, including:
- Blaze Pizza LLC
- California Pizza Kitchen Inc.
- CEC Entertainment Concepts L.P.
- Dominos Pizza Inc.
- Dr. August Oetker KG
- FAT Brands Inc.
- Food Delivery Brands Group
- General Mills Inc.
- Hungry Howie Pizza and Subs
- Jets America Inc.
- Little Caesar Enterprises Inc.
- Marcos Franchising LLC
- MOD Super Fast Pizza LLC
- Nestle SA
- Orkla ASA
- Papa Johns International Inc.
- Papa Murphys International
- Sbarro LLC
- Schwans Co.
- YUM Brands Inc.
Qualitative and quantitative analysis of companies has been conducted to help clients understand the wider business environment as well as the strengths and weaknesses of key industry players. Data is qualitatively analyzed to categorize companies as pure play, category-focused, industry-focused, and diversified; it is quantitatively analyzed to categorize companies as dominant, leading, strong, tentative, and weak.
Recent Development and News in Pizza market
- In May, 2025, Alsea S.A.B. de C.V. expanded its cloud kitchen network for Domino's Pizza across Brazil, integrating a new artificial intelligence system to predict regional demand fluctuations based on local sporting events.
- In April, 2025, Papa Johns International Inc. entered into a historic agreement to establish five hundred new sustainable-design locations across India and Southeast Asia over the next three years to meet rising urban demand.
- In March, 2025, Pizza Hut International introduced a permanent global menu category, the Green Harvest Series, featuring certified organic vegetables and carbon-neutral crusts from regenerative farms.
- In February, 2025, Domino Pizza Enterprises Limited implemented a global initiative involving a proprietary generative AI system to provide real-time, personalized dietary recommendations and bespoke crust options to users.
Dive into Technavio’s robust research methodology, blending expert interviews, extensive data synthesis, and validated models for unparalleled Pizza Market insights. See full methodology.
| Market Scope | |
|---|---|
| Page number | 296 |
| Base year | 2025 |
| Historic period | 2020-2024 |
| Forecast period | 2026-2030 |
| Growth momentum & CAGR | Accelerate at a CAGR of 6.9% |
| Market growth 2026-2030 | USD 75826.6 million |
| Market structure | Fragmented |
| YoY growth 2025-2026(%) | 6.5% |
| Key countries | US, Canada, Mexico, UK, Germany, France, Italy, Spain, The Netherlands, India, China, Japan, South Korea, Australia, Indonesia, Saudi Arabia, UAE, South Africa, Israel, Turkey, Brazil, Argentina and Chile |
| Competitive landscape | Leading Companies, Market Positioning of Companies, Competitive Strategies, and Industry Risks |
Research Analyst Overview
- The pizza market is defined by a strategic convergence of culinary fusion and operational technology. The fast-casual segment is expanding through the use of artisanal ingredients, sourdough bases, and other premium toppings, moving beyond traditional offerings. This shift is supported by an open-kitchen format that emphasizes transparency.
- Innovations in food science are enabling the creation of high-fiber crusts, plant-based proteins, and dairy-free cheese alternatives, catering to specialized dietary needs. At the same time, the industry is investing in solutions like thermal-sensing delivery and automated vending technology to enhance convenience.
- For boardroom consideration, the adoption of a zero-waste initiative, including a circular packaging system with biodegradable packaging, is becoming a critical compliance and brand-differentiation factor, as some operators have demonstrated a reduction in packaging waste by over 40%.
- From proprietary dough development using ancient grain crusts to robotic pizza preparation and hydrogen-powered ovens, the market's future hinges on integrating these advanced systems to deliver both quality and efficiency. Success requires mastering cold-chain logistics for fresh inputs and leveraging smart-ordering kiosks for streamlined service.
What are the Key Data Covered in this Pizza Market Research and Growth Report?
-
What is the expected growth of the Pizza Market between 2026 and 2030?
-
USD 75.83 billion, at a CAGR of 6.9%
-
-
What segmentation does the market report cover?
-
The report is segmented by Distribution Channel (Quick service restaurants (QSR), Full-service restaurants (FSR), and Others), Type (Non-vegetarian pizza, and Vegetarian pizza), Product Type (Fresh, Frozen, and Chilled) and Geography (North America, Europe, APAC, Middle East and Africa, South America)
-
-
Which regions are analyzed in the report?
-
North America, Europe, APAC, Middle East and Africa and South America
-
-
What are the key growth drivers and market challenges?
-
Technological integration and digital ordering ecosystem, Intense competition and market saturation
-
-
Who are the major players in the Pizza Market?
-
Blaze Pizza LLC, California Pizza Kitchen Inc., CEC Entertainment Concepts L.P., Dominos Pizza Inc., Dr. August Oetker KG, FAT Brands Inc., Food Delivery Brands Group, General Mills Inc., Hungry Howie Pizza and Subs, Jets America Inc., Little Caesar Enterprises Inc., Marcos Franchising LLC, MOD Super Fast Pizza LLC, Nestle SA, Orkla ASA, Papa Johns International Inc., Papa Murphys International, Sbarro LLC, Schwans Co. and YUM Brands Inc.
-
Market Research Insights
- The market's momentum is increasingly tied to the digital transformation of operations. The adoption of advanced data analytics for hyper-personalization has improved customer retention rates by up to 18%, while predictive logistics suites have cut last-mile delivery times by over 20% in dense urban areas.
- This technological pivot allows for greater franchise model scalability and supports omnichannel strategies that blend digital and physical touchpoints. As operators leverage data-driven insights from mobile app ordering and customer loyalty programs, the ability to execute effective regional flavor adaptation becomes a key competitive advantage.
- The integration of digital payment systems is nearly universal, streamlining transactions and enhancing the overall customer experience.
We can help! Our analysts can customize this pizza market research report to meet your requirements.
 RIA -
RIA - 
