India Plastic Crates Market Size 2026-2030
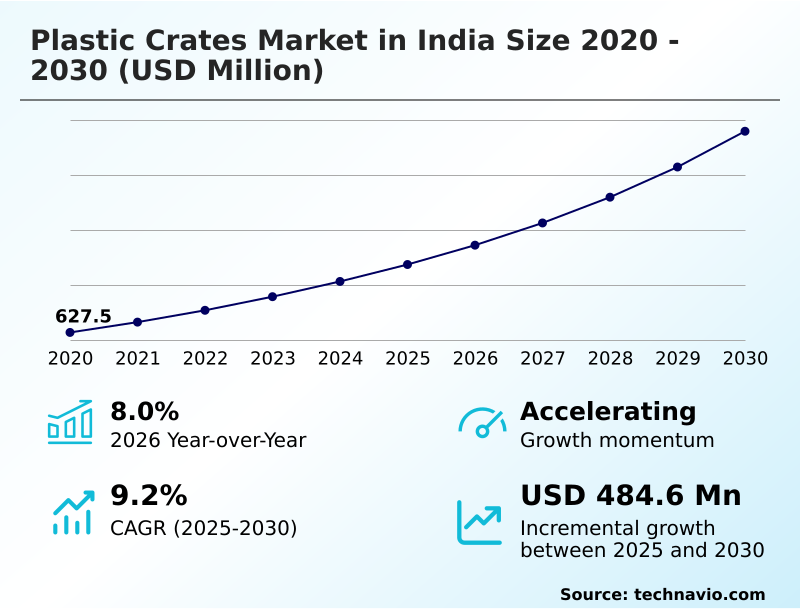
The india plastic crates market size is valued to increase by USD 484.6 million, at a CAGR of 9.2% from 2025 to 2030. Rising globalization and increasing rate of international trade will drive the india plastic crates market.
Major Market Trends & Insights
- By End-user - Food and beverages segment was valued at USD 254.9 million in 2024
- By Material - PE segment accounted for the largest market revenue share in 2024
Market Size & Forecast
- Market Opportunities: USD 731.6 million
- Market Future Opportunities: USD 484.6 million
- CAGR from 2025 to 2030 : 9.2%
Market Summary
- The plastic crates market in India is undergoing significant expansion, driven by the modernization of the nation's logistics, agricultural, and industrial sectors. There is a fundamental shift away from traditional wooden or bamboo containers toward durable and hygienic high-density polyethylene crates and polypropylene crates.
- This transition supports the growing needs of organized retail, e-commerce, and food processing industries, where supply chain efficiency and product safety are paramount. Key drivers include the need for better post-harvest solutions in agriculture and streamlined industrial material handling in manufacturing.
- For example, an e-commerce firm can optimize its reverse logistics by using collapsible crates, reducing return trip vehicle space by up to 80% and lowering operational costs. Trends are moving toward sustainability, with a focus on reusable logistics solutions and circular economy principles.
- However, the market faces challenges related to plastic waste management and the need for robust recycling infrastructure to handle end-of-life returnable transit packaging. Innovation in material science, including biopolymers, and smart features like RFID tags are shaping the competitive landscape, pushing manufacturers to offer more than just a container but an integrated logistics tool.
What will be the Size of the India Plastic Crates Market during the forecast period?
Get Key Insights on Market Forecast (PDF) Get Free Sample
How is the India Plastic Crates Market Segmented?
The india plastic crates industry research report provides comprehensive data (region-wise segment analysis), with forecasts and estimates in "USD million" for the period 2026-2030, as well as historical data from 2020-2024 for the following segments.
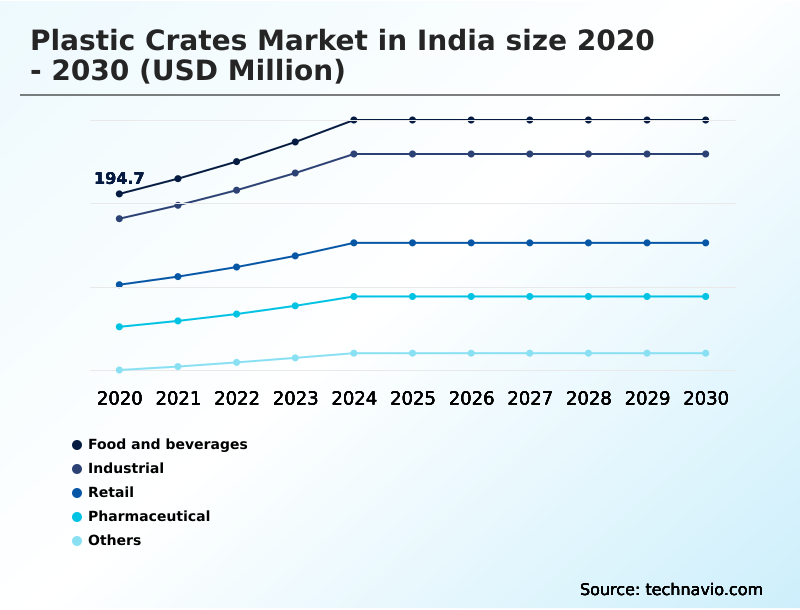
- End-user
- Food and beverages
- Industrial
- Retail
- Pharmaceutical
- Others
- Material
- PE
- PP
- PVC
- Others
- Type
- Stackable
- Collapsible
- Inline
- Geography
- APAC
- India
- APAC
By End-user Insights
The food and beverages segment is estimated to witness significant growth during the forecast period.
The food and beverages segment represents a dominant application area, driven by the need to reduce post-harvest losses and ensure hygiene across the supply chain.
This sector heavily relies on high-quality containers like stackable dairy crates and ventilated agriculture crates for transporting perishables from collection centers to urban retail hubs.
A preference for food-grade plastic crates with smooth interior surfaces is evident, aligning with stringent food safety standards. The integration of antimicrobial additives is an emerging trend.
The use of cold chain logistics containers has been shown to improve product integrity during food and beverage distribution, with some operators reporting a 15% reduction in spoilage for temperature-sensitive items, significantly impacting dairy product handling and fruit and vegetable transport efficiency.
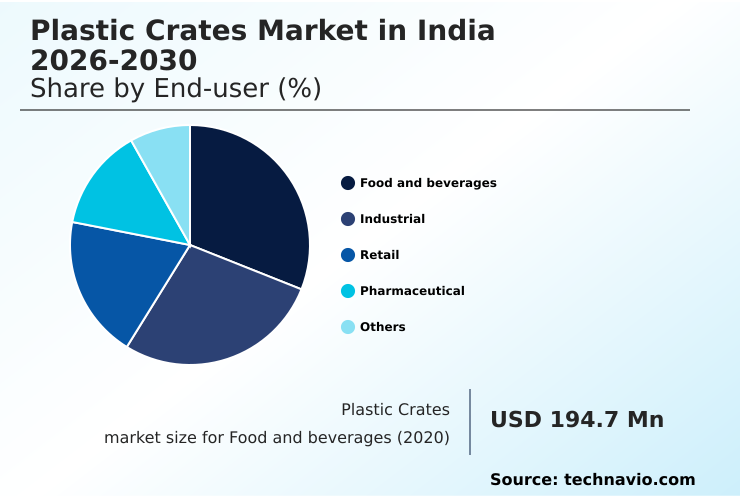
The Food and beverages segment was valued at USD 254.9 million in 2024 and showed a gradual increase during the forecast period.
Market Dynamics
Our researchers analyzed the data with 2025 as the base year, along with the key drivers, trends, and challenges. A holistic analysis of drivers will help companies refine their marketing strategies to gain a competitive advantage.
- An in-depth cost-benefit analysis of plastic vs wood crates consistently demonstrates the long-term economic advantages of plastic, particularly in high-frequency supply chains. The impact of crate design on produce quality is a critical consideration, with studies showing that ventilated designs can reduce spoilage by more than 20% compared to solid-wall containers.
- This directly addresses the role of plastic crates in reducing food waste, a key performance metric for the agricultural and retail sectors. To maintain these benefits, adhering to best practices for cleaning and sanitizing plastic crates is essential for preventing cross-contamination and ensuring food safety.
- Furthermore, the integration of RFID technology in plastic crates is transforming inventory management by offering real-time asset tracking and improving accuracy, which provides a significant value proposition over traditional, untraceable methods. These advancements collectively enhance logistical operations and contribute to a more efficient and sustainable supply chain ecosystem, justifying the initial investment in higher-quality plastic containers.
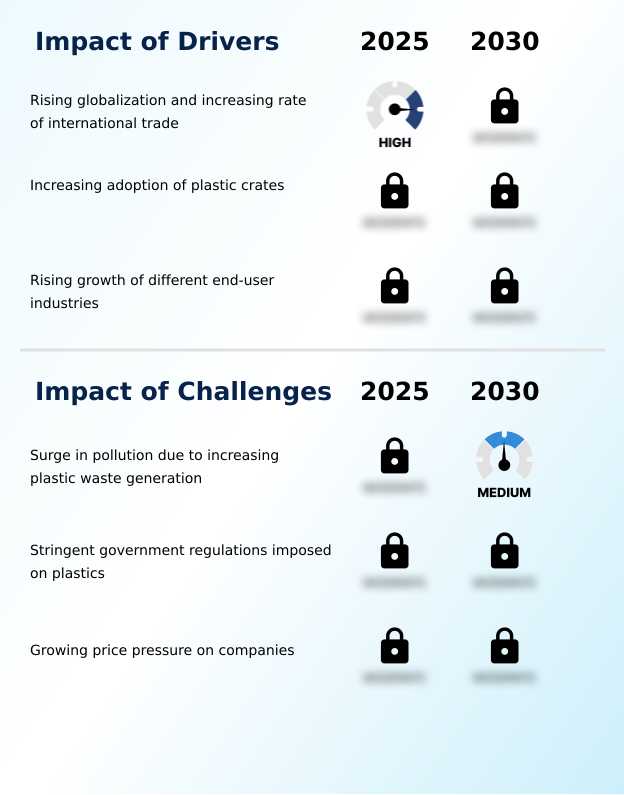
What are the key market drivers leading to the rise in the adoption of India Plastic Crates Industry?
- Rising globalization and an increasing rate of international trade serve as a major catalyst for growth in the market.
- A key driver is the modernization of supply chains, with a focus on material handling automation. This has increased demand for crates with automated handling compatibility, which can boost warehouse throughput by over 18%.
- The need for warehouse space optimization further propels the adoption of stackable and collapsible designs. In specialized sectors, the use of chemical-resistant polymers and food-safe HDPE material with a reinforced corner design is non-negotiable.
- Concurrently, sustainability mandates drive growth, with extended producer responsibility compliance encouraging biopolymer crate applications. The use of certified compostable biopolymers can reduce landfill waste by 90% compared to conventional plastics, aligning with corporate environmental goals.
What are the market trends shaping the India Plastic Crates Industry?
- The emergence of plasticulture, where plastic products are integrated into agricultural practices, is a revolutionary trend poised to shape market growth.
- The emergence of plasticulture implementation is a key trend, where specialized crates are used to improve crop yields and resource efficiency. Innovations in material science are leading to the adoption of high-impact resistant plastic and UV-stabilized polymers, enhancing container longevity, with some heavy-duty industrial bins now offering a 40% longer service life than previous models.
- Design advancements like ergonomic handle design and nestable plastic containers improve handling efficiency and reduce worker fatigue. Furthermore, reusable packaging systems are being enhanced with features like tamper-evident lids to meet stringent export-grade packaging standards, improving security for high-value goods and reducing in-transit theft by up to 10%, which is critical for international trade.
What challenges does the India Plastic Crates Industry face during its growth?
- A surge in pollution resulting from increasing plastic waste generation presents a significant environmental challenge to the industry's growth.
- A primary challenge is aligning with stringent plastic waste management rules, which puts pressure on manufacturers to enhance the recyclability of high-density polyethylene crates and polypropylene crates. While reusable logistics solutions inherently support sustainability, managing end-of-life multi-trip packaging remains a complex issue. Inadequate waste collection infrastructure can lead to these assets being improperly discarded, undermining their environmental benefits.
- This issue is particularly acute for agricultural post-harvest solutions, where adoption of plastic crates has driven supply chain efficiency improvements by reducing spoilage by 25%, but rural disposal systems lag. This creates a dichotomy where operational gains are offset by environmental management hurdles.
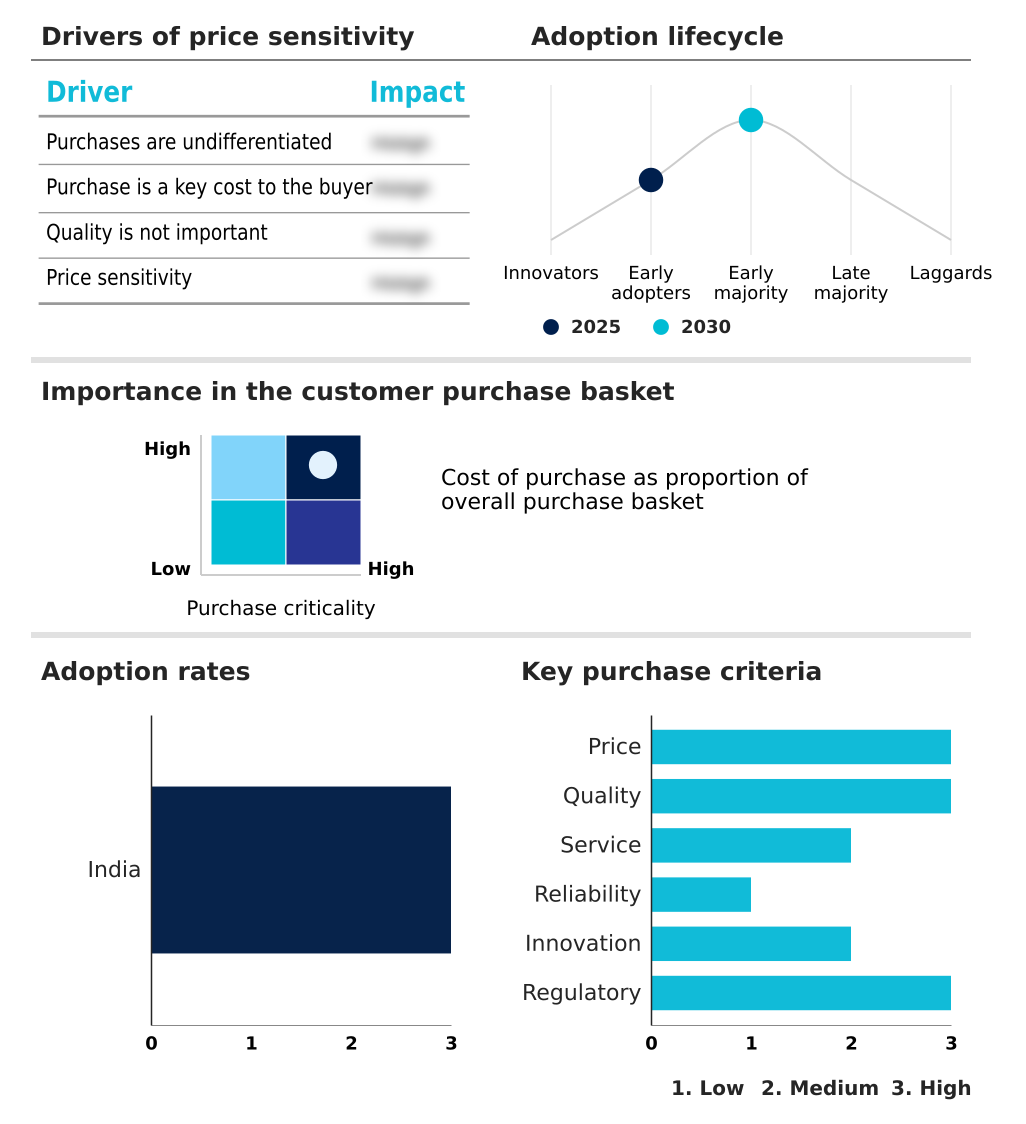
Exclusive Technavio Analysis on Customer Landscape
The india plastic crates market forecasting report includes the adoption lifecycle of the market, covering from the innovator’s stage to the laggard’s stage. It focuses on adoption rates in different regions based on penetration. Furthermore, the india plastic crates market report also includes key purchase criteria and drivers of price sensitivity to help companies evaluate and develop their market growth analysis strategies.
Customer Landscape of India Plastic Crates Industry
Competitive Landscape
Companies are implementing various strategies, such as strategic alliances, india plastic crates market forecast, partnerships, mergers and acquisitions, geographical expansion, and product/service launches, to enhance their presence in the industry.
Aahaan Polycare Pvt Ltd - Provides industrial material handling solutions, including storage bins and dairy crates, alongside customized injection-molded products designed for diverse logistical needs.
The industry research and growth report includes detailed analyses of the competitive landscape of the market and information about key companies, including:
- Aahaan Polycare Pvt Ltd
- Apolo Plast Industries
- Aristoplast Products Pvt. Ltd.
- Balaji Technologies
- Brix Industries
- Croma Plast Pvt. Ltd.
- Hi Plast Industries
- Misa Supply Chain Solutions
- National Plastics
- Nilkamal Material Handling.
- Patton International Ltd
- Plastwell Products
- Rita Plastic Industries
- Singhal Industries Pvt Ltd
- Spectron Roto Plast
- Stackwell Industries Pvt Ltd
- The Supreme Industries Ltd.
- Time Technoplast Ltd.
- UMA Plastics Ltd
- VIP Plastics
Qualitative and quantitative analysis of companies has been conducted to help clients understand the wider business environment as well as the strengths and weaknesses of key industry players. Data is qualitatively analyzed to categorize companies as pure play, category-focused, industry-focused, and diversified; it is quantitatively analyzed to categorize companies as dominant, leading, strong, tentative, and weak.
Recent Development and News in India plastic crates market
- In August 2025, a specialized biotech startup in Bengaluru successfully launched a new range of heavy-duty crates made from certified compostable biopolymers for use in the organic food and hospitality sectors.
- In March 2025, the prominent dairy conglomerate Amul initiated a massive fleet expansion for its urban milk distribution network, involving the large-scale deployment of thousands of new high-density polyethylene crates to improve hygiene.
- In April 2025, the Ministry of Environment, Forest and Climate Change issued a new notification that introduced even higher targets for the use of recycled content in industrial plastic products.
- In May 2025, the leading quick commerce platform Blinkit announced the opening of fifty new dark stores in major metropolitan areas, triggering a substantial requirement for lightweight and stackable plastic crates.
Dive into Technavio’s robust research methodology, blending expert interviews, extensive data synthesis, and validated models for unparalleled India Plastic Crates Market insights. See full methodology.
| Market Scope | |
|---|---|
| Page number | 191 |
| Base year | 2025 |
| Historic period | 2020-2024 |
| Forecast period | 2026-2030 |
| Growth momentum & CAGR | Accelerate at a CAGR of 9.2% |
| Market growth 2026-2030 | USD 484.6 million |
| Market structure | Fragmented |
| YoY growth 2025-2026(%) | 8.0% |
| Key countries | India |
| Competitive landscape | Leading Companies, Market Positioning of Companies, Competitive Strategies, and Industry Risks |
Research Analyst Overview
- The market is evolving from basic containers to sophisticated systems featuring automated handling compatibility and ergonomic handle design. The use of high-density polyethylene crates and polypropylene crates remains foundational, but innovation is evident in custom-engineered plastic crates with reinforced corner design and tamper-evident lids.
- Boardroom decisions are increasingly influenced by the need for reusable logistics solutions that are also sustainable, such as those made from certified compostable biopolymers or featuring antimicrobial additives. Companies adopting specialized injection-molded solutions for high-value goods have reported a 15% reduction in product damage during transit.
- The emphasis is on multi-trip packaging that offers durability, from heavy-duty storage containers to lightweight stackable crates. Demand is growing for food-grade plastic crates made from food-safe hdpe material with smooth interior surfaces.
- Ventilated agriculture crates, stackable dairy crates, nestable plastic containers, and collapsible crates all address specific logistical needs, while advancements in chemical-resistant polymers and high-impact resistant plastic with UV-stabilized polymers enhance product longevity.
What are the Key Data Covered in this India Plastic Crates Market Research and Growth Report?
-
What is the expected growth of the India Plastic Crates Market between 2026 and 2030?
-
USD 484.6 million, at a CAGR of 9.2%
-
-
What segmentation does the market report cover?
-
The report is segmented by End-user (Food and beverages, Industrial, Retail, Pharmaceutical, and Others), Material (PE, PP, PVC, and Others), Type (Stackable, Collapsible, and Inline) and Geography (APAC)
-
-
Which regions are analyzed in the report?
-
APAC
-
-
What are the key growth drivers and market challenges?
-
Rising globalization and increasing rate of international trade, Surge in pollution due to increasing plastic waste generation
-
-
Who are the major players in the India Plastic Crates Market?
-
Aahaan Polycare Pvt Ltd, Apolo Plast Industries, Aristoplast Products Pvt. Ltd., Balaji Technologies, Brix Industries, Croma Plast Pvt. Ltd., Hi Plast Industries, Misa Supply Chain Solutions, National Plastics, Nilkamal Material Handling., Patton International Ltd, Plastwell Products, Rita Plastic Industries, Singhal Industries Pvt Ltd, Spectron Roto Plast, Stackwell Industries Pvt Ltd, The Supreme Industries Ltd., Time Technoplast Ltd., UMA Plastics Ltd and VIP Plastics
-
Market Research Insights
- The market's dynamics are driven by a push for greater operational efficiency across sectors. The adoption of standardized reusable packaging systems has demonstrated up to a 30% improvement in supply chain efficiency improvements for retail inventory management.
- In parallel, e-commerce fulfillment solutions leveraging collapsible crates have reduced reverse logistics costs by over 40% by enabling superior warehouse space optimization on return trips. The expansion of cold chain logistics containers is critical for the food and beverage distribution and pharmaceutical transport packaging sectors, ensuring product integrity.
- Furthermore, extended producer responsibility compliance is spurring innovation in sustainable packaging alternatives and biopolymer crate applications, aligning with a broader industry shift toward circular economy practices.
We can help! Our analysts can customize this india plastic crates market research report to meet your requirements.
 RIA -
RIA - 
