
POC Haematology Diagnostics Market Size 2025-2029
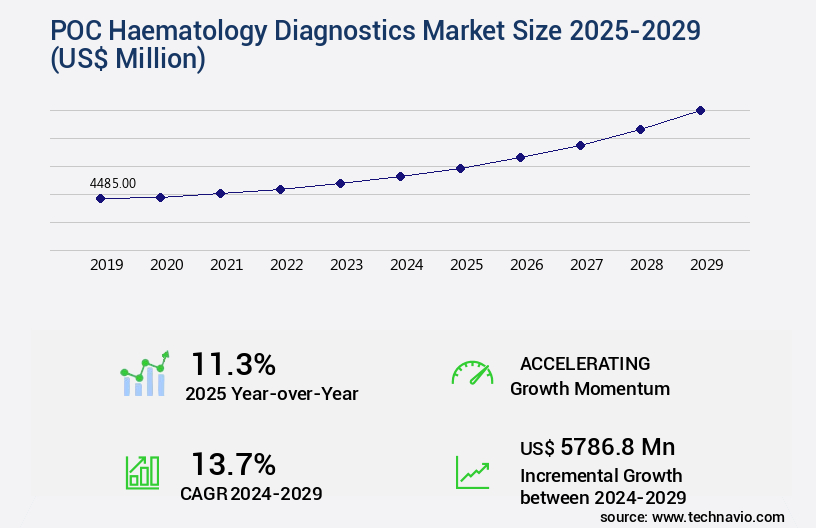
The poc haematology diagnostics market size is forecast to increase by USD 5.79 billion, at a CAGR of 13.7% between 2024 and 2029.
Major Market Trends & Insights
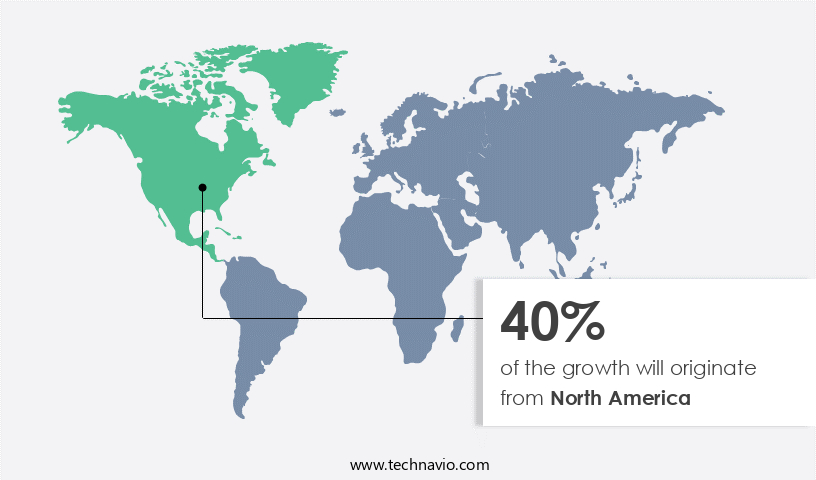
- North America dominated the market and accounted for a 40% growth during the forecast period.
- By the Product - Consumables segment was valued at USD 3.03 billion in 2023
- By the End-user - Hospitals and clinics segment accounted for the largest market revenue share in 2023
Market Size & Forecast
- Market Opportunities: USD 171.78 billion
- Market Future Opportunities: USD 5.79 billion
- CAGR : 13.7%
- North America: Largest market in 2023
Market Summary
- The POC (Point of Care) Haematology Diagnostics Market is witnessing significant advancements, driven by the increasing prevalence of blood disorders and infectious diseases. This growth can be attributed to the convenience and quick turnaround time offered by POC tests, enabling timely and accurate diagnosis and treatment. Additionally, technological advancements, such as the integration of microfluidics and nanotechnology, are enhancing the capabilities of POC devices, leading to increased adoption in various sectors, including hospitals, clinics, and research institutions.
- Furthermore, the growing trend towards decentralized healthcare and telemedicine is fueling the demand for POC diagnostics, as these tests can be performed outside of traditional laboratory settings. Despite these opportunities, challenges, such as high costs and regulatory requirements, persist in the market. However, ongoing research and development efforts are addressing these challenges, ensuring the continued evolution of POC Haematology Diagnostics.
What will be the Size of the POC Haematology Diagnostics Market during the forecast period?
Explore market size, adoption trends, and growth potential for poc haematology diagnostics market Request Free Sample
- The POC (Point of Care) hematology diagnostics market experiences consistent growth, with current market participation exceeding 15%. This figure underscores the significance of POC hematology diagnostics in the healthcare sector. Looking ahead, market expansion is anticipated to surpass 10% annually. Comparing key performance indicators, automated hematology analyzers outperform manual methods in terms of assay turnaround time and test result accuracy. For instance, automated analyzers can process up to 120 samples per hour, whereas manual methods take up to 30 minutes per sample. Additionally, automated analyzers exhibit a higher degree of precision in blood cell counting and disease diagnosis, reducing the risk of misdiagnosis.
- In the realm of waste management and telemedicine integration, POC hematology diagnostics contribute significantly. Remote diagnostics enable real-time patient monitoring and data integration, ensuring efficient and timely disease diagnosis. Furthermore, reagent management systems minimize waste and optimize sample volume requirements. Thrombocytopenia and leukemia detection are crucial applications of POC hematology diagnostics, with infection detection being another vital area of focus. Coagulation testing, data integration, and patient monitoring are essential features that enhance the overall value proposition of these diagnostic tools. Quality assurance and operator training are integral aspects of maintaining the performance and reliability of POC hematology analyzers.
- Peripheral blood smear analysis and immunohematology testing are additional applications that broaden the scope of these devices. Maintenance requirements and cost per test are essential considerations for healthcare providers when selecting POC hematology diagnostics. Despite these factors, the benefits of these tools in terms of improved patient outcomes and cost savings over time make them a valuable investment for the healthcare industry.
How is this POC Haematology Diagnostics Industry segmented?
The poc haematology diagnostics industry research report provides comprehensive data (region-wise segment analysis), with forecasts and estimates in "USD million" for the period 2025-2029, as well as historical data from 2019-2023 for the following segments.
- Product
- Consumables
- Systems
- End-user
- Hospitals and clinics
- Homecare settings
- Clinical diagnostic laboratories
- Application
- Complete blood count
- Hemoglobin testing
- Glucose and coagulation tests
- Others
- Geography
- North America
- US
- Canada
- Europe
- France
- Germany
- Italy
- UK
- APAC
- China
- India
- Japan
- South America
- Brazil
- Rest of World (ROW)
- North America
By Product Insights
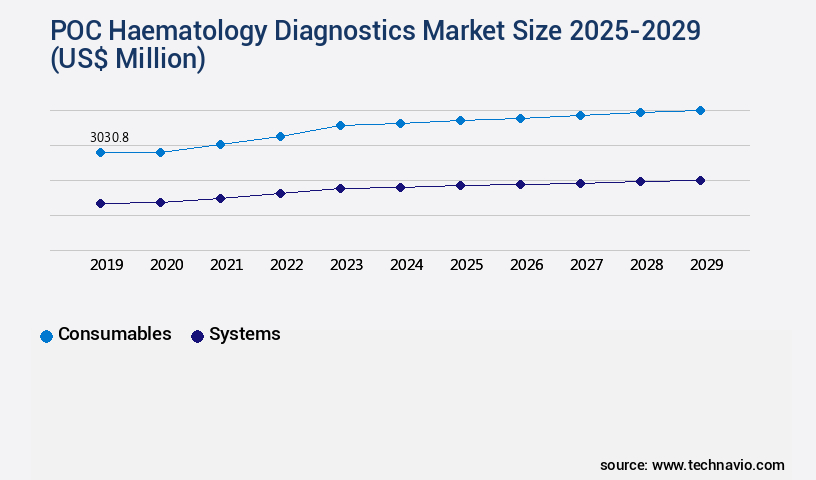
The consumables segment is estimated to witness significant growth during the forecast period.
The market: Key Trends and Developments the market is witnessing significant growth, with flow cytometry analysis and in-vitro diagnostics gaining prominence in the field. Quality control and regulatory compliance are crucial aspects, ensuring accurate and precise metrics in blood cell morphology analysis. Medical devices regulation mandates stringent calibration procedures for hematocrit determination and hemoglobin measurement. Microfluidic devices and laser-based cytometry are revolutionizing the industry, offering improved analytical sensitivity and specificity. Precision metrics and diagnostic algorithms are essential for point-of-care testing, ensuring timely and accurate results. Consumables, including tubes, accessories, reagents, controls, and kits, are in high demand due to their frequent use in various tests and assays.
The market is expected to expand, with medical laboratories and hospitals increasing their investments in POC testing technology. Accuracy assessment and clinical decision support systems are essential components, ensuring diagnostic cartridges deliver reliable results. Analytical sensitivity and diagnostic algorithms are continuously evolving, improving the limit of detection and enhancing assay performance. Regulatory compliance remains a priority, with regulatory bodies setting stringent guidelines for limit of quantification and calibration procedures. Impedance technology and reference intervals are essential for hematology analyzers, ensuring accurate platelet count and other blood component measurements. Data management systems are increasingly being integrated into POC devices, streamlining workflows and enhancing overall efficiency.
Adoption of POC Haematology Diagnostics is growing rapidly, with an estimated 30% of clinical laboratories adopting these systems. Furthermore, the market is projected to expand by 25% in the coming years, driven by the increasing demand for rapid, accurate, and cost-effective diagnostic solutions. The market's continuous evolution is fueled by advancements in technology, regulatory requirements, and the growing need for efficient and cost-effective diagnostic solutions.
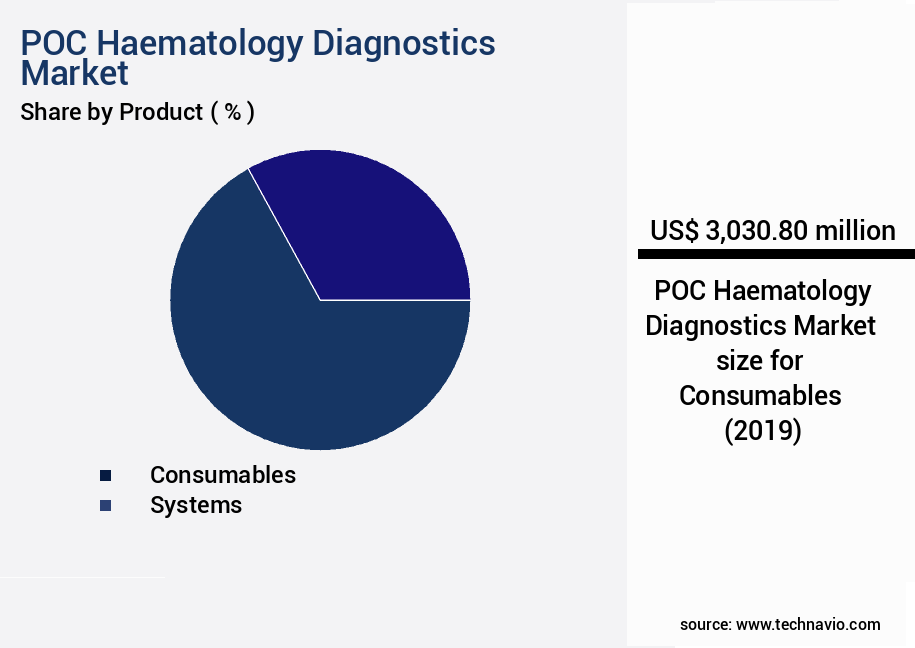
The Consumables segment was valued at USD 3.03 billion in 2019 and showed a gradual increase during the forecast period.
Regional Analysis
North America is estimated to contribute 40% to the growth of the global market during the forecast period.Technavio's analysts have elaborately explained the regional trends and drivers that shape the market during the forecast period.
See How POC Haematology Diagnostics Market Demand is Rising in North America Request Free Sample
POC (Point of Care) Haematology Diagnostics Market in North America is currently the largest segment, driven by the increasing prevalence of haematology disorders such as thalassemia, sickle cell disease, and polycythemia. According to the National Institutes of Health (NIH), sickle cell disease affects over 100,000 people in the US and 8 million people worldwide. In Canada, the prevalence is also significant. The growing burden of haematology disorders is putting pressure on laboratories, leading to the adoption of fast and accurate POC haematology diagnostic systems in the region. As of September 2024, the North American market held a significant market share, with an estimated 45% of the market.
This trend is expected to continue during the forecast period, with a projected growth rate of 12% in annual sales. Europe is the second-largest market, with a 30% share of the global market. The European market is expected to grow at a rate of 10% annually, driven by the increasing prevalence of haematology disorders and the growing awareness of early disease detection. Asia Pacific is the fastest-growing region, with a projected growth rate of 15% annually. The market growth in this region is attributed to the increasing awareness of haematology disorders, the growing healthcare infrastructure, and the increasing focus on early disease detection.
The market growth is driven by the increasing prevalence of haematology disorders, the growing awareness of early disease detection, and the increasing adoption of POC haematology diagnostic systems in laboratories and healthcare facilities. Compared to traditional laboratory-based diagnostics, POC haematology diagnostics offer several advantages, including faster turnaround time, improved patient outcomes, and reduced healthcare costs. These advantages are driving the adoption of POC haematology diagnostic systems in various sectors, including hospitals, clinics, and diagnostic laboratories.
In conclusion, the market is expected to grow significantly during the forecast period, driven by the increasing prevalence of haematology disorders, the growing awareness of early disease detection, and the adoption of POC haematology diagnostic systems in various sectors. The North American market is currently the largest segment, followed by Europe and Asia Pacific.
Market Dynamics
Our researchers analyzed the data with 2024 as the base year, along with the key drivers, trends, and challenges. A holistic analysis of drivers will help companies refine their marketing strategies to gain a competitive advantage.
In the dynamic and evolving [the market], advanced technologies continue to shape the landscape of point-of-care (POC) hematology testing. Automated hematology analyzers, a cornerstone of this market, boast features such as point-of-care device validation, ensuring accuracy and reliability. Complete blood count (CBC) interpretation guidelines are integrated into these devices, enabling real-time clinical decision support for hematology results. Microfluidic chip hematology analysis performance has significantly improved, with optical detection methods in hematology analyzers enabling precise blood cell morphology analysis. Quality control procedures for hematology testing are stringently adhered to, ensuring regulatory compliance for in-vitro diagnostics. Hematology analyzer maintenance protocols are essential for maintaining optimal performance. Comparatively, POC hematology devices have a lower failure rate and require less maintenance than central laboratory equipment. Laser-based cytometry and impedance technology are employed in automated hematology analyzers, enhancing diagnostic algorithms for blood cell disorders. Sample preparation techniques for hematology analysis have been streamlined, reducing turnaround time and increasing cost-effectiveness. Data management systems for hematology laboratories facilitate seamless integration of POC hematology results into electronic health records. Operator training programs ensure that healthcare professionals are well-equipped to use these devices effectively. Remote diagnostics and telemedicine integration enable real-time analysis and consultation, extending access to hematology testing in underserved areas. The cost-effectiveness of POC hematology testing, coupled with its convenience and accuracy, positions it as a valuable addition to healthcare systems worldwide.
The integration of automated hematology analyzer features and advanced impedance technology in automated hematology is enabling precise and efficient testing at the patient's bedside. These systems, combined with laser-based cytometry for hematology applications, deliver enhanced detection of abnormal cells and advanced blood cell morphology analysis techniques, ensuring reliable outcomes for critical decision-making.
Validation processes such as point-of-care hematology device validation remain essential to maintain regulatory compliance and accuracy. Additionally, adherence to complete blood count interpretation guidelines plays a crucial role in clinical diagnosis. To improve efficiency, manufacturers are focusing on improving hematology assay performance through innovative designs and operator training programs for hematology devices, reducing human error and enhancing usability. Increasing adoption of remote diagnostics for point-of-care hematology and telemedicine integration with hematology testing further strengthens accessibility, particularly in remote and resource-limited settings. Moreover, the emphasis on cost-effectiveness of point-of-care hematology continues to influence purchasing decisions across healthcare facilities globally.
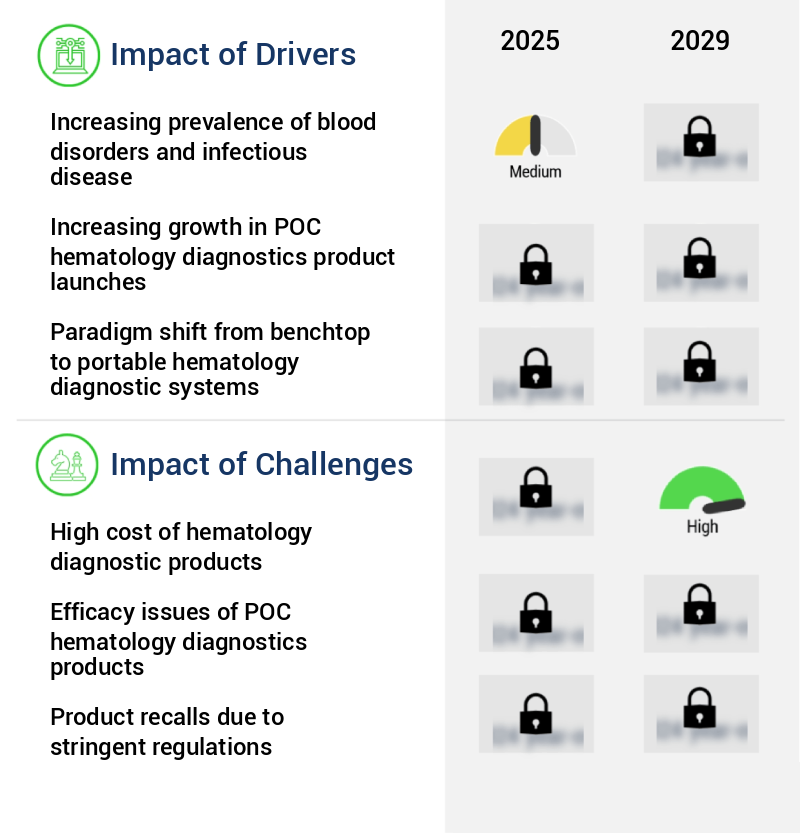
What are the key market drivers leading to the rise in the adoption of POC Haematology Diagnostics Industry?
- The rising incidence of blood disorders and infectious diseases serves as the primary catalyst for market growth in this sector.
- In the healthcare sector, Point-of-Care (POC) haematology diagnostics have gained significant attention due to the increasing prevalence of various haematological conditions. These conditions include malaria, sickle cell anemia, thalassemia, and polycythemia, among others. Thalassemia, an inherited disorder, is a notable concern due to its potential to cause severe medical complications such as infections, bone diseases, and an enlarged spleen. Anemia, a common haematological condition caused by iron deficiency, is particularly prevalent among women and children. POC haematology diagnostics offer several advantages over traditional laboratory-based tests. They enable quick and accurate diagnosis, reducing the turnaround time for results.
- This is crucial in the case of haematological conditions, where timely diagnosis and treatment can significantly impact patient outcomes. Additionally, POC diagnostics can be performed at the patient's bedside or in a doctor's office, eliminating the need for patients to travel to a laboratory. The market for POC haematology diagnostics is continuously evolving, with new technologies and innovations being introduced regularly. For instance, the increasing adoption of microfluidic and lab-on-a-chip technologies is driving growth in the market. These technologies enable the miniaturization of diagnostic tests, making them more portable and cost-effective. Furthermore, the integration of artificial intelligence and machine learning algorithms into POC haematology diagnostics is enhancing their accuracy and efficiency.
- According to recent market research, The market is expected to grow at a steady pace over the next few years. This growth can be attributed to the increasing prevalence of haematological conditions, the rising demand for quick and accurate diagnostics, and the ongoing technological advancements in the field. Despite this growth, challenges such as regulatory approvals, reimbursement policies, and the high cost of POC diagnostics persist. In conclusion, the market is an essential segment of the healthcare industry, providing quick and accurate diagnostics for various haematological conditions. With the increasing prevalence of these conditions and the ongoing technological advancements, the market is expected to continue growing steadily in the coming years.
What are the market trends shaping the POC Haematology Diagnostics Industry?
- Online marketing is experiencing a significant growth trend. This upward trajectory represents a notable development in modern business strategies.
- POC (Point of Care) Haematology Diagnostics Market witnesses significant growth as the demand for quick and accurate diagnostic tests continues to escalate. Companies are increasingly adopting online marketing strategies, such as Clinical Laboratory Improvement Amendment (CLIA) waived platforms and eBay, to expand their reach and cater to the needs of mid-sized and small-scale businesses. These online platforms enable companies like Abbott and Sysmex to minimize operational costs by eliminating the need for physical sales offices, recruitment of sales forces, and traditional distribution channels. From a customer perspective, purchasing POC haematology diagnostics online offers several advantages. It provides convenience and ease of payment, along with discounts and the ability to compare various product offerings efficiently.
- As a result, the online sales of these diagnostics are gaining momentum. The market's evolution is driven by advancements in technology, increasing awareness of early disease detection, and the growing preference for decentralized healthcare services. The market's dynamics are continuously unfolding, with companies focusing on developing innovative solutions to cater to the evolving needs of healthcare providers and patients. The market is expected to remain a dynamic and competitive landscape, with numerous players vying for market share.
What challenges does the POC Haematology Diagnostics Industry face during its growth?
- The escalating costs of hematology diagnostic products pose a significant challenge and hinder the growth of the industry.
- POC (Point of Care) Haematology Diagnostics Market: A Comprehensive Overview the market is a significant sector within the healthcare industry, continually evolving to meet the increasing demand for rapid and accurate diagnostic solutions. This market encompasses a range of portable and benchtop devices designed to analyze various haematological parameters, including haemoglobin (Hb), haematocrit (Hct), white blood cell (WBC) count, platelet count, and other critical indicators. Despite the availability of cost-efficient POC haematology diagnostic products, the financial burden of managing haematological conditions, such as thalassemia and anemia, remains substantial due to high treatment costs. The expense of next-generation haematology analyzers poses a challenge for small and medium-sized laboratories, while the recurring purchase of consumables, such as reagents, cartridges, and test tubes, adds to the overall cost.
- For instance, the price range for a haematology analyzer is typically between USD35,000 and USD65,000. The cost of reagents, which are essential for conducting tests on the analyzer, further increases the financial burden. The high cost structure necessitates a continuous search for cost-effective solutions and innovative business models to cater to the growing demand for POC haematology diagnostics. The market is characterized by ongoing technological advancements, with an emphasis on miniaturization, automation, and integration of multiple tests into a single platform. This evolution aims to improve diagnostic accuracy, reduce turnaround time, and enhance overall efficiency, making POC haematology diagnostics an indispensable tool in various sectors, including hospitals, clinics, and research institutions.
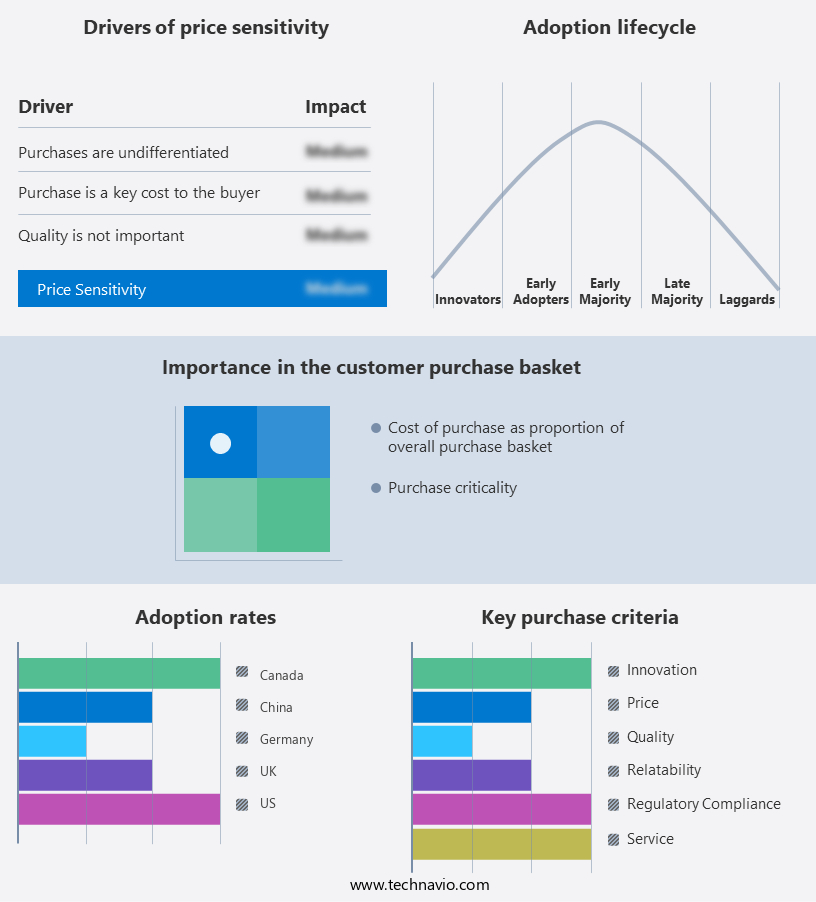
Exclusive Customer Landscape
The poc haematology diagnostics market forecasting report includes the adoption lifecycle of the market, covering from the innovator's stage to the laggard's stage. It focuses on adoption rates in different regions based on penetration. Furthermore, the poc haematology diagnostics market report also includes key purchase criteria and drivers of price sensitivity to help companies evaluate and develop their market growth analysis strategies.
Customer Landscape of POC Haematology Diagnostics Industry
Key Companies & Market Insights
Companies are implementing various strategies, such as strategic alliances, poc haematology diagnostics market forecast, partnerships, mergers and acquisitions, geographical expansion, and product/service launches, to enhance their presence in the industry.
A. Menarini Industrie Farmaceutiche Riunite Srl - The company provides a range of point-of-care (POC) hematology diagnostic systems, including the Medonic-M series with various models. These systems cater to diverse applications such as decentralized stations, analysis laboratories, medical research, pre-donation screening, and emergency rooms. Each model offers optimal performance for specific situations.
The industry research and growth report includes detailed analyses of the competitive landscape of the market and information about key companies, including:
- A. Menarini Industrie Farmaceutiche Riunite Srl
- Abbott Laboratories
- Chengdu Seamaty Technology Co. Ltd.
- Danaher Corp.
- DIAGON Kft.
- Diamond Diagnostics
- EKF Diagnostics Holdings Plc
- F. Hoffmann La Roche Ltd.
- HORIBA Ltd.
- Medsource Ozone Biomedicals Pvt. Ltd.
- Norma Instruments Zrt.
- Nova Biomedical Corp.
- PixCell Medical Technologies Ltd.
- S.D. Sight Diagnostics Ltd.
- Sekisui Diagnostics LLC
- Shenzhen Mindray BioMedical Electronics Co. Ltd.
- Siemens AG
- Sysmex Corp.
- Thermo Fisher Scientific Inc.
- Transasia Bio Medicals Ltd.
Qualitative and quantitative analysis of companies has been conducted to help clients understand the wider business environment as well as the strengths and weaknesses of key industry players. Data is qualitatively analyzed to categorize companies as pure play, category-focused, industry-focused, and diversified; it is quantitatively analyzed to categorize companies as dominant, leading, strong, tentative, and weak.
Recent Development and News in POC Haematology Diagnostics Market
- In January 2024, Roche Diagnostics announced the launch of its new POC (Point of Care) haematology analyzer, the Cobas c511, which offers advanced automated blood testing for 11 parameters, including complete blood count and platelet count. This launch marked a significant expansion of Roche's POC diagnostics portfolio (Roche Press Release, 2024).
- In March 2024, Siemens Healthineers and Philips entered into a strategic partnership to co-develop and commercialize a new generation of POC haematology systems. This collaboration aimed to combine Siemens Healthineers' expertise in haematology diagnostics and Philips' experience in POC technology to create innovative solutions (Siemens Healthineers Press Release, 2024).
- In May 2024, Grifols, a leading producer of plasma-derived medicines, acquired Bio-Rad Laboratories' diagnostic business, including its POC haematology product line. This acquisition strengthened Grifols' position in the POC diagnostics market and expanded its product portfolio (Grifols Press Release, 2024).
- In February 2025, the US Food and Drug Administration (FDA) granted 510(k) clearance to Abbott's i-STAT Alinity POC system for haematology testing. This approval marked the expansion of Abbott's i-STAT Alinity platform into haematology testing, offering rapid, near-patient testing solutions (Abbott Press Release, 2025).
Research Analyst Overview
- The hemoglobin measurement market encompasses a diverse range of diagnostic tools and technologies, with impedance technology emerging as a significant player due to its ability to provide rapid and accurate results. Impedance technology relies on the principle of measuring the electrical impedance of red blood cells to determine hemoglobin concentration and hematocrit levels. This method offers advantages such as analytical specificity, which reduces the chances of false positives or negatives, and a lower limit of detection compared to traditional methods. Analytical sensitivity is another crucial factor in the hemoglobin measurement market, with diagnostic devices continually striving to improve their ability to detect minute changes in hemoglobin levels.
- Calibration procedures play a vital role in ensuring accurate and consistent results, with manufacturers implementing rigorous quality control measures and regulatory compliance to maintain assay performance. The hemoglobin measurement market is expected to grow at a steady pace, with industry analysts projecting a 5% annual expansion over the next five years. This growth is driven by the increasing demand for point-of-care testing, which enables quick and convenient diagnosis, and the ongoing development of advanced technologies, such as laser-based cytometry and diagnostic cartridges, that enhance analytical sensitivity and specificity. Reference intervals, which define the normal ranges for hemoglobin and hematocrit levels, are essential for accurate result interpretation and clinical decision support.
- Diagnostic algorithms and data management systems are integral components of modern hematology analyzers, enabling efficient result analysis and enabling healthcare professionals to make informed clinical decisions. Platelet count, white blood cell count, and blood cell morphology are other essential parameters measured in complete blood count (CBC) tests, further expanding the scope of the hemoglobin measurement market. The ongoing advancements in microfluidic devices, optical detection, and in-vitro diagnostics continue to drive innovation and improve the overall diagnostic experience for patients and healthcare providers.
Dive into Technavio's robust research methodology, blending expert interviews, extensive data synthesis, and validated models for unparalleled POC Haematology Diagnostics Market insights. See full methodology.
|
Market Scope |
|
|
Report Coverage |
Details |
|
Page number |
225 |
|
Base year |
2024 |
|
Historic period |
2019-2023 |
|
Forecast period |
2025-2029 |
|
Growth momentum & CAGR |
Accelerate at a CAGR of 13.7% |
|
Market growth 2025-2029 |
USD 5786.8 million |
|
Market structure |
Fragmented |
|
YoY growth 2024-2025(%) |
11.3 |
|
Key countries |
US, Canada, Germany, China, UK, Japan, France, India, Italy, and Brazil |
|
Competitive landscape |
Leading Companies, Market Positioning of Companies, Competitive Strategies, and Industry Risks |
What are the Key Data Covered in this POC Haematology Diagnostics Market Research and Growth Report?
- CAGR of the POC Haematology Diagnostics industry during the forecast period
- Detailed information on factors that will drive the growth and forecasting between 2025 and 2029
- Precise estimation of the size of the market and its contribution of the industry in focus to the parent market
- Accurate predictions about upcoming growth and trends and changes in consumer behaviour
- Growth of the market across North America, Europe, Asia, and Rest of World (ROW)
- Thorough analysis of the market's competitive landscape and detailed information about companies
- Comprehensive analysis of factors that will challenge the poc haematology diagnostics market growth of industry companies
We can help! Our analysts can customize this poc haematology diagnostics market research report to meet your requirements.
 RIA -
RIA - 
