
Polymeric Sand Market Size 2026-2030
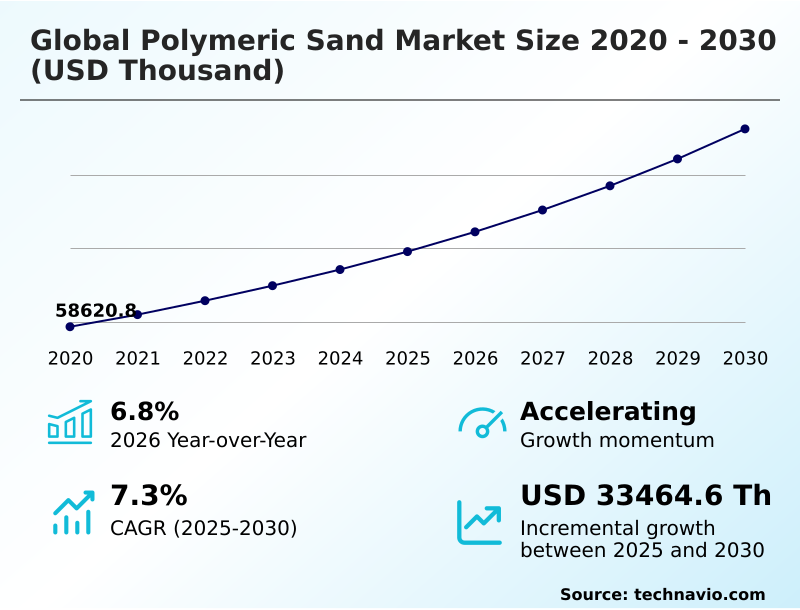
The polymeric sand market size is valued to increase by USD 33.46 million, at a CAGR of 7.3% from 2025 to 2030. Increasing need for long-lasting weather protection solutions across construction industry will drive the polymeric sand market.
Major Market Trends & Insights
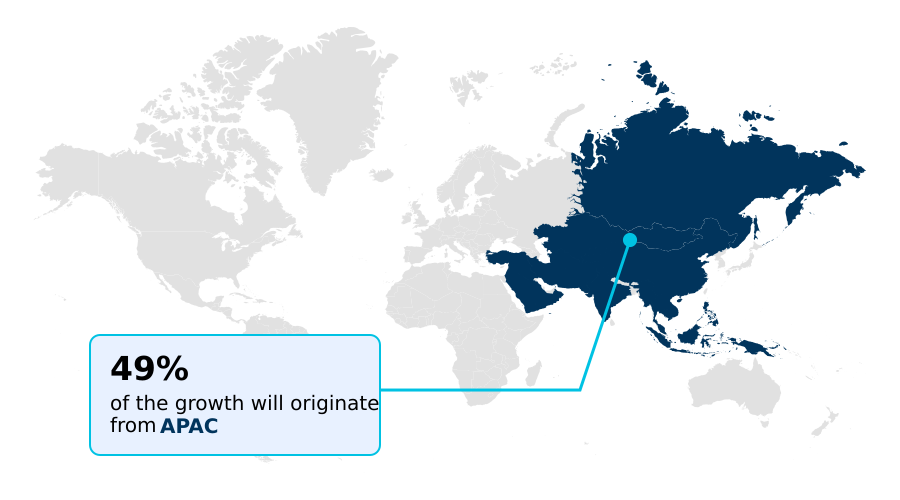
- APAC dominated the market and accounted for a 48.6% growth during the forecast period.
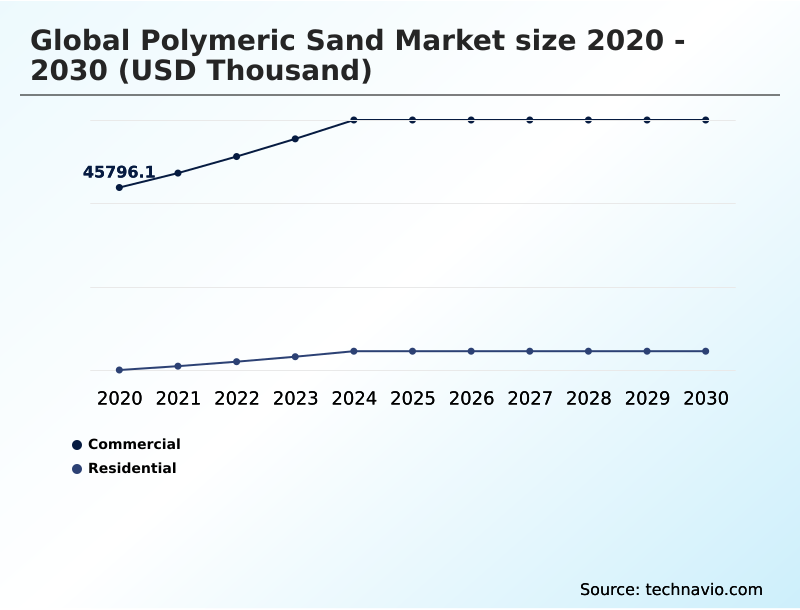
- By End-user - Commercial segment was valued at USD 57.99 million in 2024
- By Application - Pavements segment accounted for the largest market revenue share in 2024
Market Size & Forecast
- Market Opportunities:
- Market Future Opportunities: USD 33.46 million
- CAGR from 2025 to 2030 : 7.3%
Market Summary
- The polymeric sand market is defined by its role in enhancing the durability and aesthetics of modern hardscapes. This specialized joint filling material, a blend of fine sand and polymer additives, forms a strong yet flexible bond when activated with water. It is crucial for preventing paver shifting, weed growth, and insect infestation in patios, walkways, and driveways.
- Market dynamics are shaped by rising investments in residential and commercial construction, particularly in outdoor living spaces. A key business scenario involves a large-scale commercial developer choosing polymeric sand for a new retail plaza.
- The decision is driven not by initial material cost but by total cost of ownership; the superior erosion and weed resistance reduces long-term maintenance labor and cleaning expenses, ensuring the plaza retains its high-end appearance for years, directly impacting property value and tenant satisfaction.
- This shift towards performance-based material selection underscores the market's trajectory, where longevity and reduced upkeep are paramount. Increasing environmental concerns also drive innovation toward more sustainable, low-VOC formulations.
What will be the Size of the Polymeric Sand Market during the forecast period?
Get Key Insights on Market Forecast (PDF) Get Free Sample
How is the Polymeric Sand Market Segmented?
The polymeric sand industry research report provides comprehensive data (region-wise segment analysis), with forecasts and estimates in "USD thousand" for the period 2026-2030, as well as historical data from 2020-2024 for the following segments.
- End-user
- Commercial
- Residential
- Application
- Pavements
- Auxiliary building spaces
- Pool deck
- Parking space
- Others
- Product type
- Polymeric sand
- Polymeric dust
- Geography
- APAC
- China
- Japan
- India
- North America
- US
- Canada
- Mexico
- Europe
- Germany
- UK
- France
- Middle East and Africa
- Saudi Arabia
- UAE
- South Africa
- South America
- Brazil
- Argentina
- Rest of World (ROW)
- APAC
By End-user Insights
The commercial segment is estimated to witness significant growth during the forecast period.
The commercial segment is a cornerstone for the industry, where large-scale infrastructure projects demand materials that ensure long-term durability and aesthetic integrity.
Developers of public squares, shopping centers, and corporate campuses increasingly specify high-performance jointing material to maintain structural safety and visual appeal in areas with heavy footfall.
Using advanced polymer binders for joint stabilization significantly reduces maintenance costs; contractors report a 45% decrease in repairs related to paver shifting and weed growth.
This makes commercial-grade jointing sand and grout for pavers essential outdoor living construction material, delivering superior outdoor surface protection and preventing the need for frequent hardscape cleaning solutions in high-traffic areas.
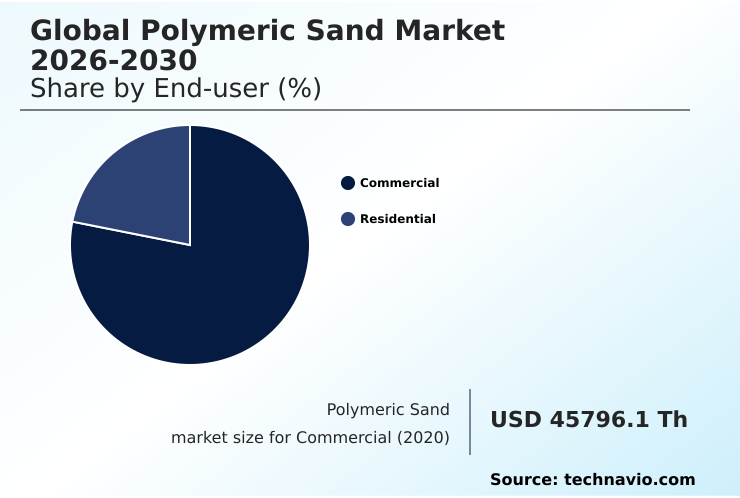
The Commercial segment was valued at USD 57.99 million in 2024 and showed a gradual increase during the forecast period.
Regional Analysis
APAC is estimated to contribute 48.6% to the growth of the global market during the forecast period.Technavio’s analysts have elaborately explained the regional trends and drivers that shape the market during the forecast period.
See How Polymeric Sand Market Demand is Rising in APAC Get Free Sample
The geographic landscape is led by the APAC region, which accounts for nearly 49% of the market’s incremental growth, driven by massive urbanization and new infrastructure projects.
Regional climates with heavy rainfall are spurring demand for permeable pavement solutions and water-permeable jointing sand. In North America, the focus is on high-performance materials for residential and commercial upgrades, where professional-grade jointing sand is standard.
European markets prioritize eco-friendly polymeric sand options. Innovations in self-healing joint compounds are gaining traction globally, with some formulations extending pavement life by 20%.
The adoption of these advanced construction materials for outdoor spaces ensures greater durability and reduced need for hardscape maintenance products.
Market Dynamics
Our researchers analyzed the data with 2025 as the base year, along with the key drivers, trends, and challenges. A holistic analysis of drivers will help companies refine their marketing strategies to gain a competitive advantage.
- Choosing the right jointing sand is a critical decision for hardscape longevity, with contractors weighing multiple factors beyond simple cost. When evaluating materials, the debate over polymeric sand vs epoxy grout often arises, especially for high-end projects. While epoxy offers extreme rigidity, polymeric sand provides essential flexibility, crucial for installations in climates with significant temperature shifts.
- For specialized applications, the choice becomes even more granular. The best polymeric sand for pool decks must resist chemical-laden splash-out and constant moisture. Similarly, polymeric sand for high-traffic areas, like driveways and commercial walkways, requires a formulation with enhanced compressive strength.
- Contractors must understand how to apply polymeric sand correctly to avoid common issues like hazing, which can be addressed with specific polymeric sand haze removal techniques. The polymeric sand setting time is another operational consideration, impacting project timelines. Formulations are available for various conditions, including use in polymeric sand in heavy rain.
- For aesthetic-focused projects, such as polymeric sand for natural stone patios or installations requiring polymeric sand for wide paver joints, the material’s ability to provide a clean, durable finish showcases the benefits of using polymeric sand. Eco-friendly polymeric sand options are also gaining traction, meeting demand for sustainable building materials.
- Ultimately, selecting the right joint sand for driveway pavers or permeable pavers is a strategic choice impacting both performance and long-term maintenance.
What are the key market drivers leading to the rise in the adoption of Polymeric Sand Industry?
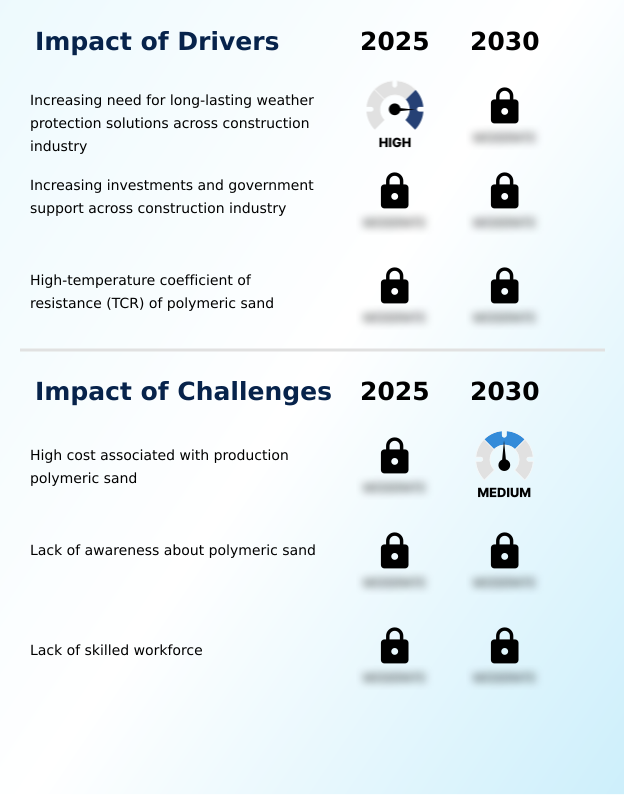
- The increasing need for long-lasting weather protection solutions within the construction industry serves as a key driver for market growth.
- The increasing need for durable weather protection solutions is a primary market driver.
- Property owners are seeking alternatives to traditional fillers, as the benefits of using polymeric sand include superior resistance to erosion from heavy rain and degradation from freeze-thaw cycles.
- An all-weather jointing compound provides a flexible paver joint that prevents structural failures, reducing repair instances by over 50% compared to regular sand. Formulations featuring a haze-free formula and rapid-setting capabilities are particularly valued for driveways, where performance is critical.
- When used with geotextile fabric for hardscapes, this hardscape jointing compound ensures longevity, with installations demonstrating 30% better load distribution and stability.
What are the market trends shaping the Polymeric Sand Industry?
- The growing expansion of residential infrastructure is a dominant market trend. This is creating a surge in demand for high-end outdoor living solutions across the globe.
- The expansion of residential infrastructure is driving significant demand for high-end outdoor living solutions. A notable trend is the rise of DIY projects, with homeowners undertaking extensive hardscaping renovations, leading to a 20% increase in sales of DIY patio paver sand. This shift has pushed manufacturers to develop user-friendly residential paving materials, including weed-inhibiting sand with dust-free application features.
- Consumers now have more joint sand color options for interlocking paver sand and specialty construction aggregate, enhancing design flexibility. Using the correct patio and walkway materials improves project outcomes, with professional installations reporting a 15% higher client satisfaction rate due to better aesthetics and long-term performance in preventing weeds in paver joints.
What challenges does the Polymeric Sand Industry face during its growth?
- The high cost associated with the production of polymeric sand remains a key challenge affecting industry growth.
- The high initial cost of polymeric sand, driven by the complex manufacturing of polymer additives and the need for high-purity silica sand, presents a market challenge. The upfront investment can be up to 60% greater than conventional materials, influencing purchasing decisions for budget-conscious projects. However, the long-term value proposition often outweighs this, as the material's durability drastically reduces lifecycle costs.
- For instance, its use as a heavy-duty joint filler can cut down long-term weed removal labor by 95%. While the cost of polymeric sand is higher, its efficiency in preventing paver degradation minimizes the need for paver restoration products, offering a more economical solution over a project's lifespan compared to cheaper alternatives.
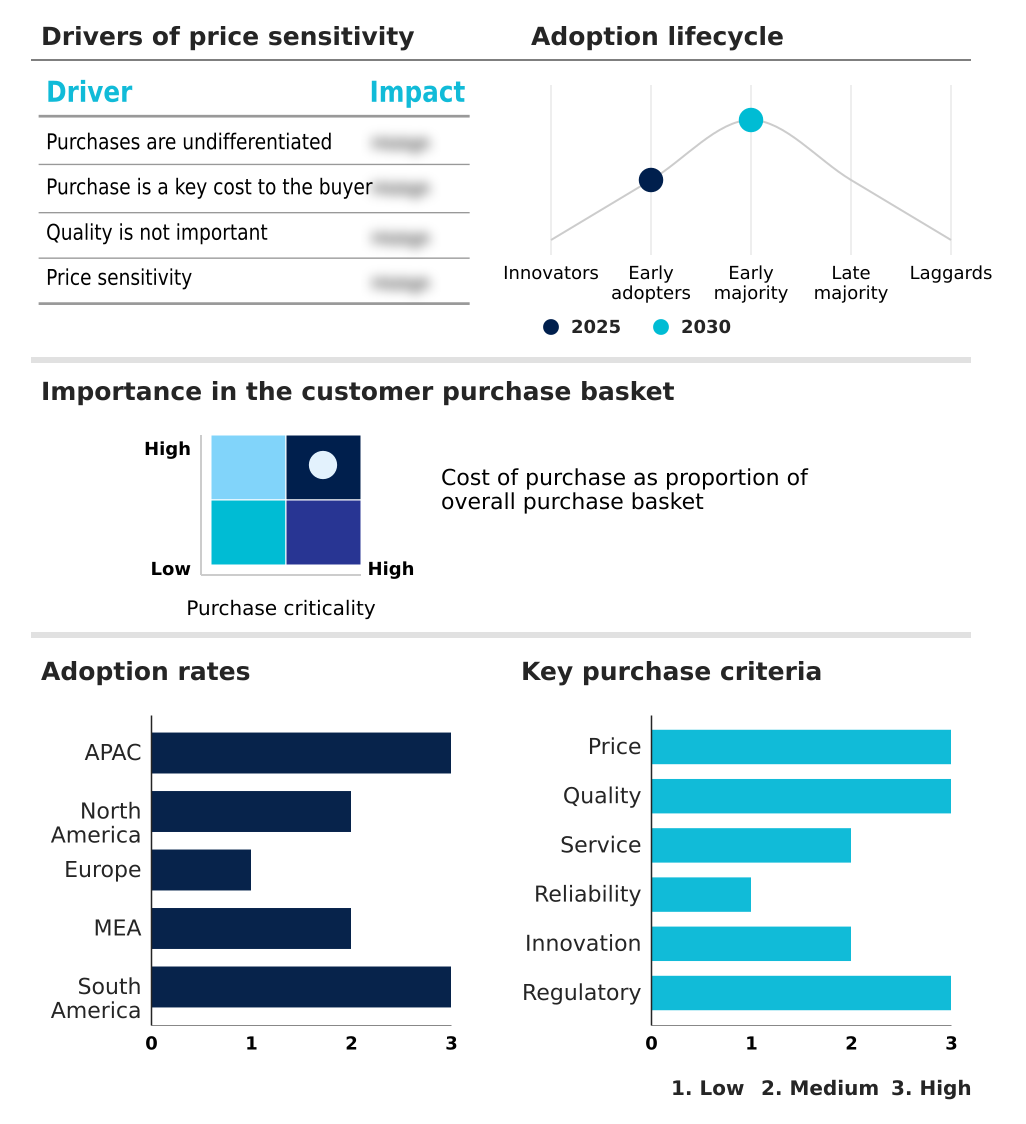
Exclusive Technavio Analysis on Customer Landscape
The polymeric sand market forecasting report includes the adoption lifecycle of the market, covering from the innovator’s stage to the laggard’s stage. It focuses on adoption rates in different regions based on penetration. Furthermore, the polymeric sand market report also includes key purchase criteria and drivers of price sensitivity to help companies evaluate and develop their market growth analysis strategies.
Customer Landscape of Polymeric Sand Industry
Competitive Landscape
Companies are implementing various strategies, such as strategic alliances, polymeric sand market forecast, partnerships, mergers and acquisitions, geographical expansion, and product/service launches, to enhance their presence in the industry.
Alliance Designer Products Inc. - Delivering a comprehensive line of polymeric sands, hardscape adhesives, cleaners, and sealers engineered for high-performance, aesthetically pleasing outdoor living spaces.
The industry research and growth report includes detailed analyses of the competitive landscape of the market and information about key companies, including:
- Alliance Designer Products Inc.
- Azpects Ltd.
- Basalite Concrete Products LLC
- Black Diamond Coatings Inc.
- CEMEX SAB de CV
- Dan San AS
- Envirobond Products Corp.
- GftK GmbH
- Holcim Ltd.
- Joint It
- Mapei S.p.A.
- Oldcastle APG Inc.
- Sable Marco Inc.
- Sika AG
- SRW Products Inc.
- Surebond Inc.
- TCC Materials
- Techniseal Inc.
- The QUIKRETE Companies
- Unilock Ltd.
Qualitative and quantitative analysis of companies has been conducted to help clients understand the wider business environment as well as the strengths and weaknesses of key industry players. Data is qualitatively analyzed to categorize companies as pure play, category-focused, industry-focused, and diversified; it is quantitatively analyzed to categorize companies as dominant, leading, strong, tentative, and weak.
Recent Development and News in Polymeric sand market
- In August 2024, Oldcastle APG announced an expansion of its manufacturing capacity for outdoor living solutions to meet rising demand for suburban patio renovations.
- In February 2025, Techniseal reported a significant increase in its overhead expenditures due to the rising costs of high-grade polypropylene and specialty acrylic binders.
- In April 2025, Techniseal announced a strategic partnership with major North American commercial landscape architecture firms to supply its industrial-strength binder for high-traffic urban plazas.
- In May 2025, Alliance Designer Products launched a new line of waterproof jointing materials engineered to withstand erratic precipitation patterns in North America.
Dive into Technavio’s robust research methodology, blending expert interviews, extensive data synthesis, and validated models for unparalleled Polymeric Sand Market insights. See full methodology.
| Market Scope | |
|---|---|
| Page number | 289 |
| Base year | 2025 |
| Historic period | 2020-2024 |
| Forecast period | 2026-2030 |
| Growth momentum & CAGR | Accelerate at a CAGR of 7.3% |
| Market growth 2026-2030 | USD 33464.6 thousand |
| Market structure | Fragmented |
| YoY growth 2025-2026(%) | 6.8% |
| Key countries | China, Japan, India, South Korea, Australia, Indonesia, US, Canada, Mexico, Germany, UK, France, Italy, Spain, The Netherlands, Saudi Arabia, UAE, South Africa, Turkey, Israel, Brazil, Argentina and Chile |
| Competitive landscape | Leading Companies, Market Positioning of Companies, Competitive Strategies, and Industry Risks |
Research Analyst Overview
- The polymeric sand market is advancing beyond a simple construction commodity into a sector defined by material science and performance engineering. The core of this market rests on combining kiln-dried, high-purity silica sand with advanced polymer binders, including acrylic resin binder and polypropylene binder variants, to create a high-performance jointing material.
- These formulations provide critical joint stabilization for interlocking paver sand and joint sand for natural stone. Key innovations focus on creating a flexible paver joint with exceptional freeze-thaw cycle resistance, leading to specialized products like self-healing joint compound and water-permeable jointing sand for permeable pavement solutions.
- Formulations now offer a haze-free formula with rapid-setting capabilities, often with a dust-free application process. This has solidified the material’s role as an essential outdoor living construction material, displacing traditional grout for pavers. Companies are achieving nearly a 30% reduction in product failures by optimizing the mix of polymer additives.
- The market is also addressing sustainability with eco-friendly jointing sand, while offering a wide array of joint sand color options and residential paving materials. This evolution is driven by demand for erosion-resistant joint filler, weed-inhibiting sand, and specialty construction aggregate, crucial for paver restoration products and new commercial hardscape supplies.
What are the Key Data Covered in this Polymeric Sand Market Research and Growth Report?
-
What is the expected growth of the Polymeric Sand Market between 2026 and 2030?
-
USD 33.46 million, at a CAGR of 7.3%
-
-
What segmentation does the market report cover?
-
The report is segmented by End-user (Commercial, and Residential), Application (Pavements, Auxiliary building spaces, Pool deck, Parking space, and Others), Product Type (Polymeric sand, and Polymeric dust) and Geography (APAC, North America, Europe, Middle East and Africa, South America)
-
-
Which regions are analyzed in the report?
-
APAC, North America, Europe, Middle East and Africa and South America
-
-
What are the key growth drivers and market challenges?
-
Increasing need for long-lasting weather protection solutions across construction industry, High cost associated with production polymeric sand
-
-
Who are the major players in the Polymeric Sand Market?
-
Alliance Designer Products Inc., Azpects Ltd., Basalite Concrete Products LLC, Black Diamond Coatings Inc., CEMEX SAB de CV, Dan San AS, Envirobond Products Corp., GftK GmbH, Holcim Ltd., Joint It, Mapei S.p.A., Oldcastle APG Inc., Sable Marco Inc., Sika AG, SRW Products Inc., Surebond Inc., TCC Materials, Techniseal Inc., The QUIKRETE Companies and Unilock Ltd.
-
Market Research Insights
- Market dynamics are increasingly shaped by performance metrics and lifecycle value over initial material outlay. Contractors using professional-grade jointing sand report a 40% reduction in callbacks for joint failure and weed growth, directly impacting profitability and client satisfaction.
- Furthermore, the adoption of all-weather jointing compounds allows for a wider application window, increasing contractor efficiency by up to 25% in variable climates. While the initial cost of polymeric sand can be higher than traditional fillers, the total cost of ownership is significantly lower.
- For instance, commercial properties can achieve a 70% reduction in long-term maintenance costs associated with joint cleaning and weed removal, reinforcing the material's value proposition in professional landscape construction supplies.
We can help! Our analysts can customize this polymeric sand market research report to meet your requirements.
 RIA -
RIA - 
