Portable Blenders Market Analysis, Size, and Forecast 2026-2030: North America (US, Canada, and Mexico), APAC (China, India, and Japan), Europe (Germany, UK, and France), South America (Brazil, Argentina, and Colombia), Middle East and Africa (UAE, Saudi Arabia, and South Africa), and Rest of World (ROW)

Portable Blenders Market Analysis, Size, and Forecast 2026-2030:
North America (US, Canada, and Mexico), APAC (China, India, and Japan), Europe (Germany, UK, and France), South America (Brazil, Argentina, and Colombia), Middle East and Africa (UAE, Saudi Arabia, and South Africa), and Rest of World (ROW)

Published: Apr 2026 276 Pages SKU: IRTNTR76548

Market Overview at a Glance

$97.3 Mn
Market Opportunity
9.3%
CAGR 2025 - 2030
32.9%
North America Growth
$103.6 Mn
Offline segment 2024

Portable Blenders Market Size 2026-2030

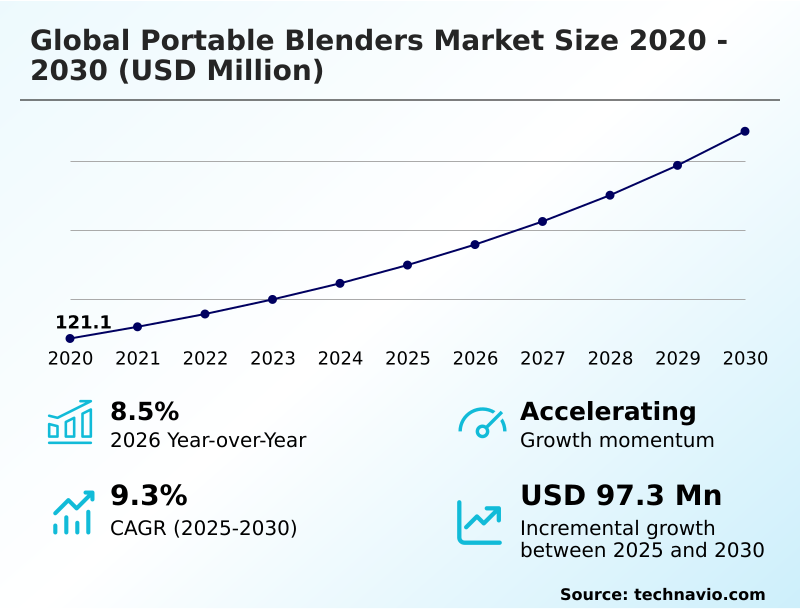
The portable blenders market size is valued to increase by USD 97.3 million, at a CAGR of 9.3% from 2025 to 2030. Proliferation of health and wellness lifestyles among urban consumers will drive the portable blenders market.

Major Market Trends & Insights

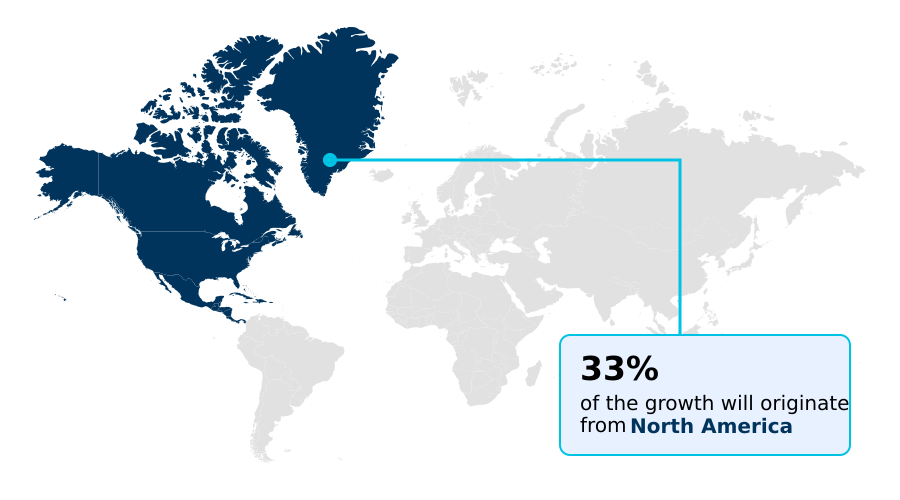
  • North America dominated the market and accounted for a 32.9% growth during the forecast period.
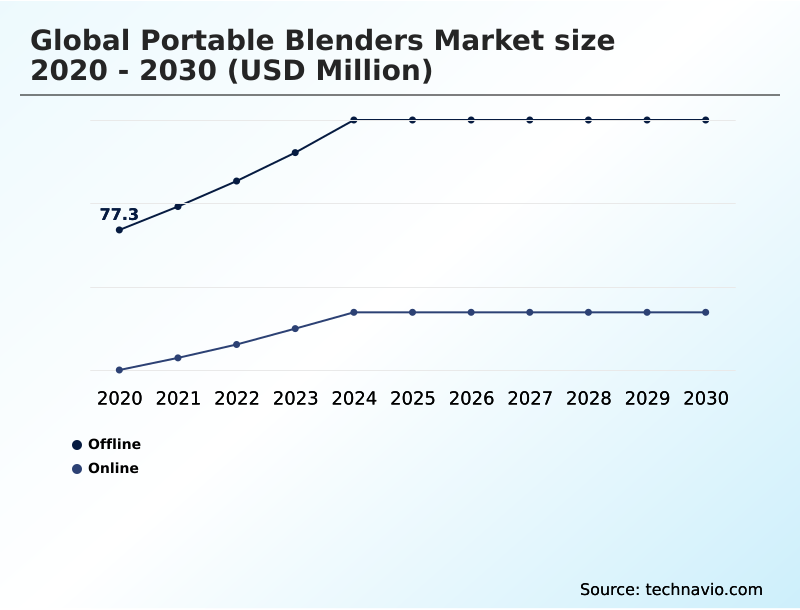
  • By Distribution Channel - Offline segment was valued at USD 103.6 million in 2024
  • By Material - Plastic segment accounted for the largest market revenue share in 2024

Market Size & Forecast

  • Market Opportunities: USD 150.7 million
  • Market Future Opportunities: USD 97.3 million
  • CAGR from 2025 to 2030 : 9.3%

Market Summary

  • The portable blenders market is transitioning from a niche category to a mainstream lifestyle necessity, driven by consumer demand for nutritional autonomy and convenience. This shift is enabled by advancements in cordless blending technology and high-density battery cells, which allow for the preparation of fresh beverages in any setting.
  • Key market trends include the integration of smart features, such as AI-powered motor control for automated power adjustment, and the adoption of sustainable material sourcing. These innovations cater to health-conscious users who prioritize both performance and environmental responsibility.
  • However, the industry faces significant hurdles related to circular economy compliance and the complex regulations governing the transport of products containing a rechargeable lithium-ion battery.
  • For instance, a manufacturer planning a global product launch must engineer a water-resistant chassis design while also ensuring its supply chain adheres to international shipping rules for batteries, which can increase logistical costs by over 15% and impact final retail pricing. Success in this competitive space requires balancing powerful blending capabilities with stringent safety standards and a compelling user experience.

What will be the Size of the Portable Blenders Market during the forecast period?

Get Key Insights on Market Forecast (PDF) Request Free Sample

How is the Portable Blenders Market Segmented?

The portable blenders industry research report provides comprehensive data (region-wise segment analysis), with forecasts and estimates in "USD million" for the period 2026-2030, as well as historical data from 2020-2024 for the following segments.

  • Distribution channel
    • Offline
    • Online
  • Material
    • Plastic
    • Glass
    • Steel
  • End-user
    • Residential
    • Commercial
  • Geography
    • North America
      • US
      • Canada
      • Mexico
    • APAC
      • China
      • India
      • Japan
    • Europe
      • Germany
      • UK
      • France
    • South America
      • Brazil
      • Argentina
      • Colombia
    • Middle East and Africa
      • UAE
      • Saudi Arabia
      • South Africa
    • Rest of World (ROW)

By Distribution Channel Insights

The offline segment is estimated to witness significant growth during the forecast period.

The offline segment is crucial for the portable blenders market, as it facilitates direct consumer interaction with products.

Physical retail environments, including specialty stores and hypermarkets, allow potential buyers to assess the ergonomic one-hand grip and material quality of a compact kitchen appliance. This hands-on experience is a key part of the user-centric design philosophy that drives purchases.

In-store product demonstrations are particularly effective, showcasing the utility of a detachable blending vessel and a leak-proof travel lid.

While the direct-to-consumer e-commerce model is expanding, offline channels excel at communicating premium aesthetic design and material integrity, such as that of BPA-free tritan polymer.

This synergy between physical and digital contributes to a 15% uplift in online conversions for brands with a strong retail presence.

Request Free Sample

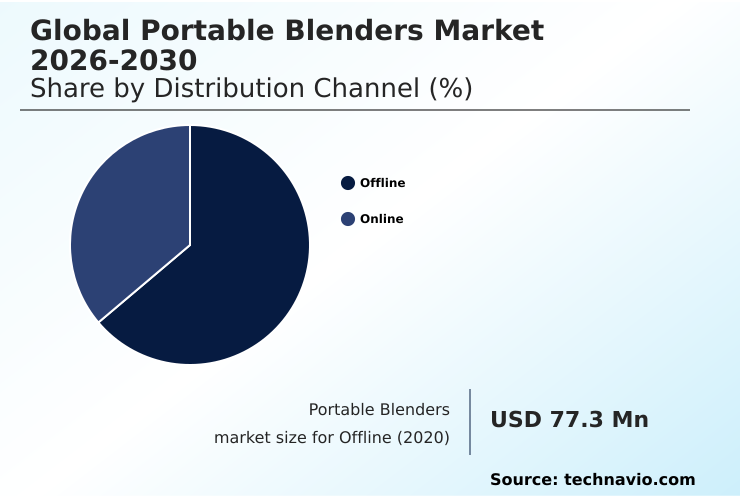
The Offline segment was valued at USD 103.6 million in 2024 and showed a gradual increase during the forecast period.

Request Free Sample

Regional Analysis

North America is estimated to contribute 32.9% to the growth of the global market during the forecast period.Technavio’s analysts have elaborately explained the regional trends and drivers that shape the market during the forecast period.

See How Portable Blenders Market Demand is Rising in North America Request Free Sample

The geographic landscape of the portable blenders market is diverse, with North America representing a mature market focused on premiumization, while the APAC region is a key growth engine.

In developed regions, demand for a high-performance personal blender is driven by an emphasis on nutrient extraction efficiency.

For instance, advanced blade geometry combined with a powerful stainless steel six-point blade can improve fibrous vegetable pulverization by up to 30%, a critical metric for wellness-focused consumers.

In contrast, emerging markets prioritize convenience features like single-serve portion control and quiet blending operation. Across all regions, innovations such as self-cleaning cycle activation are becoming differentiators.

The United States market alone, which accounts for over 46% of the North American market value, sees intense competition around features enabling superior frozen ingredient emulsification.

Market Dynamics

Our researchers analyzed the data with 2025 as the base year, along with the key drivers, trends, and challenges. A holistic analysis of drivers will help companies refine their marketing strategies to gain a competitive advantage.

  • Consumer search for the ideal portable blender is increasingly specific, moving beyond general queries to detailed performance requirements. Questions around the best portable blender for green smoothies directly relate to the effectiveness of blade geometry for fibrous vegetables, while interest in a portable blender for crushing ice and nuts highlights the importance of motor wattage on blend quality.
  • The demand for a quiet portable blender for office use has pushed manufacturers to improve noise reduction. Similarly, those seeking a lightweight portable blender for hiking are focused on the power-to-weight ratio. The choice between a portable blender with glass and steel options often comes down to a blending vessel material durability comparison.
  • Technical features such as a fast-charging USB-C portable blender and a self-cleaning portable blender feature are becoming key differentiators. Consumers also compare portable blender versus countertop blender power, battery life, and capacity, seeking options like a high-capacity 20oz portable blender.
  • Use cases like portable blender for baby food preparation or a waterproof portable blender for outdoor use expand the market's reach. Innovations like a portable blender with a detachable motor base and multiple speed settings are direct responses to these nuanced demands, with a critical focus on achieving a smooth texture in shakes.
  • Operationally, ensuring lithium-ion battery safety standards compliance is paramount, as it can reduce supply chain delays by over 20% compared to non-compliant logistical frameworks.

What are the key market drivers leading to the rise in the adoption of Portable Blenders Industry?

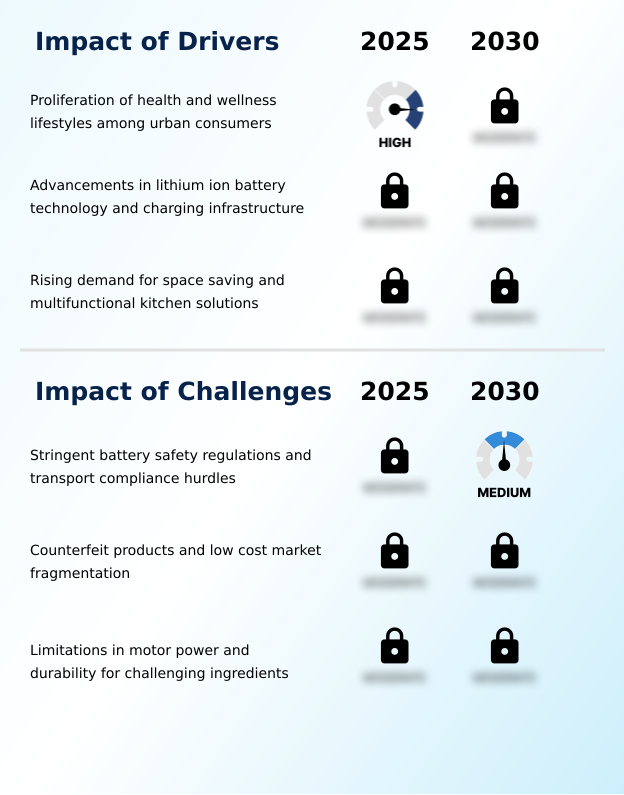
  • The proliferation of health and wellness lifestyles, particularly among urban consumers, is a key driver for market growth.

  • The market's primary driver is the advancement in core technologies that enhance mobility and performance.
  • The widespread adoption of the USB-C charging protocol has become a critical factor, reducing charging times by an average of 40% and offering brand-agnostic charging convenience.
  • This improvement in cordless kitchen convenience is complemented by the development of high-density battery cells, which have extended battery runtime by over 50% in the latest models.
  • The high-torque DC motor, central to cordless blending technology, enables the effective on-the-go smoothie preparation that consumers demand.
  • These innovations collectively define the mobile wellness hardware category, providing the power needed for battery-powered beverage blending without being tethered to a power outlet, thus directly fueling market expansion.

What are the market trends shaping the Portable Blenders Industry?

  • The integration of smart technology and digital health ecosystems is an emerging trend in the market. This development is reshaping products into connected devices for personalized wellness.

  • A significant trend shaping the market is the evolution of portable blenders into connected wellness devices. The integration of smart device connectivity allows for nutritional intake tracking, turning a simple appliance into a key component of an integrated health ecosystem. This shift is enabled by AI-powered motor control, which facilitates automated power adjustment and offers users a personalized blending cycle.
  • For instance, devices with this connectivity demonstrate a 20% higher user engagement rate. This trend caters to consumers focused on specific goals like post-workout nutrition or meal replacement preparation, with features such as a one-touch control interface making the experience seamless.
  • As a result, the office-friendly appliance is now a data-driven tool for health management, with adoption in corporate wellness programs increasing by 15% annually.

What challenges does the Portable Blenders Industry face during its growth?

  • Stringent battery safety regulations and complex transport compliance hurdles present a key challenge affecting the industry's growth.

  • A key challenge confronting the market involves navigating stringent regulations and material science complexities. Ensuring every rechargeable lithium-ion battery meets international safety standards while maintaining performance presents a significant engineering hurdle. The industry's move toward sustainable material sourcing and circular economy compliance adds another layer of complexity, particularly in reverse logistics, which can increase operational costs by up to 15%.
  • Achieving food-grade material certification for every component, from the impact-resistant blending jar to the water-resistant chassis design, requires rigorous testing and adds approximately 8% to production costs.
  • Furthermore, consumer expectations for features like dishwasher-safe components and a lightweight travel blender must be met without compromising the durability of a modular appliance design, creating a persistent tension between cost, compliance, and functionality.

Exclusive Technavio Analysis on Customer Landscape

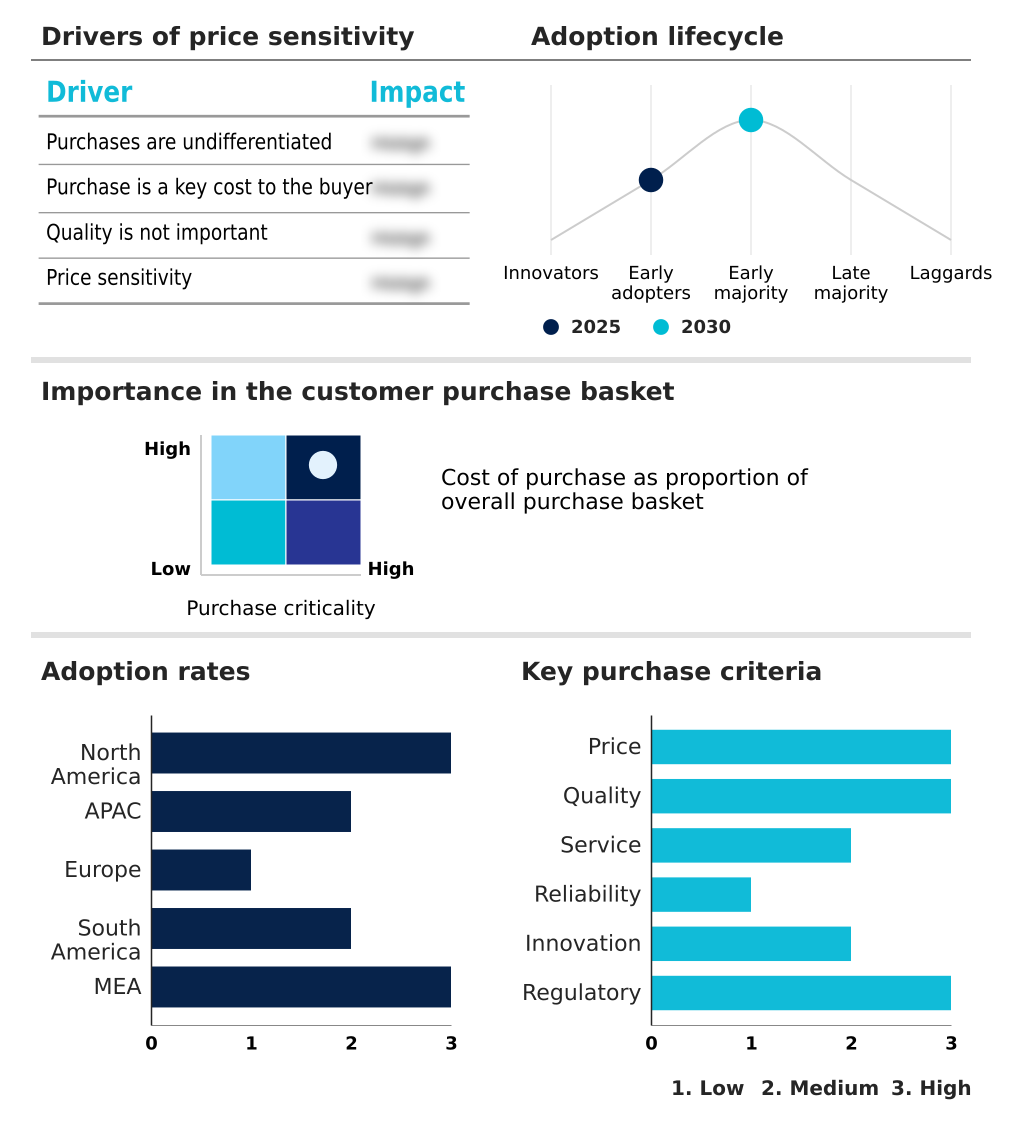
The portable blenders market forecasting report includes the adoption lifecycle of the market, covering from the innovator’s stage to the laggard’s stage. It focuses on adoption rates in different regions based on penetration. Furthermore, the portable blenders market report also includes key purchase criteria and drivers of price sensitivity to help companies evaluate and develop their market growth analysis strategies.

Customer Landscape of Portable Blenders Industry

Competitive Landscape

Companies are implementing various strategies, such as strategic alliances, portable blenders market forecast, partnerships, mergers and acquisitions, geographical expansion, and product/service launches, to enhance their presence in the industry.

Beast Health LLC - Delivering technologically advanced blending appliances engineered to support nutrient-rich consumption and wellness-focused lifestyles through high-performance design.

The industry research and growth report includes detailed analyses of the competitive landscape of the market and information about key companies, including:

  • Beast Health LLC
  • Bella Housewares
  • BLENDi
  • BlendJet Inc.
  • BOSS Appliances LLP
  • Conair LLC
  • Fresh Juice Blender
  • Fridja Ltd.
  • Haden Appliances
  • Hamilton Beach Brands Holding
  • JS Global Lifestyle Co. Ltd.
  • KitchenAid
  • nutribullet LLC
  • PopBabies
  • SharkNinja Operating LLC
  • Smeg S.p.a.
  • Spectrum Brands Inc.
  • StoreBound LLC
  • Wonderchef Home Appliance Ltd

Qualitative and quantitative analysis of companies has been conducted to help clients understand the wider business environment as well as the strengths and weaknesses of key industry players. Data is qualitatively analyzed to categorize companies as pure play, category-focused, industry-focused, and diversified; it is quantitatively analyzed to categorize companies as dominant, leading, strong, tentative, and weak.

Recent Development and News in Portable blenders market

  • In September, 2024, nutribullet LLC announced the launch of its Pro+ Connected series, featuring Bluetooth integration with a proprietary nutrition tracking app to provide users with personalized recipes and consumption data.
  • In November, 2024, SharkNinja Operating LLC introduced its Ninja BLAST PRO portable blender, equipped with a higher-wattage motor and enhanced battery technology for more efficient processing of ice and frozen ingredients.
  • In February, 2025, BlendJet Inc. unveiled its next-generation model, which incorporates a vessel made from 50% certified recycled materials and features a more energy-efficient USB-C charging system, advancing its sustainability goals.
  • In April, 2025, KitchenAid expanded its Go Cordless collection by partnering with a leading meal-kit delivery service to offer curated smoothie packs optimized for its portable blender, enhancing its home ecosystem strategy.

Dive into Technavio’s robust research methodology, blending expert interviews, extensive data synthesis, and validated models for unparalleled Portable Blenders Market insights. See full methodology.

Market Scope
Page number 276
Base year 2025
Historic period 2020-2024
Forecast period 2026-2030
Growth momentum & CAGR Accelerate at a CAGR of 9.3%
Market growth 2026-2030 USD 97.3 million
Market structure Fragmented
YoY growth 2025-2026(%) 8.5%
Key countries US, Canada, Mexico, China, India, Japan, South Korea, Australia, Indonesia, Germany, UK, France, Italy, Spain, The Netherlands, Brazil, Argentina, Colombia, UAE, Saudi Arabia, South Africa, Egypt and Morocco
Competitive landscape Leading Companies, Market Positioning of Companies, Competitive Strategies, and Industry Risks

Request Free Sample

Research Analyst Overview

  • The portable blenders market is defined by rapid technological iteration, moving beyond simple cordless blending technology to sophisticated, integrated systems. A high-torque DC motor and high-density battery cells are now baseline expectations, with competition shifting toward intelligent features. The integration of AI-powered motor control and smart device connectivity is transforming the compact kitchen appliance into mobile wellness hardware.
  • Manufacturers are focused on enhancing the user experience through features like a personalized blending cycle, an ergonomic one-hand grip, and a noise-dampening motor housing. The choice of materials, from a detachable blending vessel made of BPA-free tritan polymer to a stainless steel six-point blade, is critical for both performance and safety.
  • Boardroom decisions increasingly weigh R&D investment in advanced blade geometry for frozen ingredient emulsification against the cost of circular economy compliance and sustainable material sourcing. For instance, incorporating a self-cleaning cycle activation feature has been shown to reduce customer service inquiries by over 30%, directly impacting operational costs and brand perception.
  • A leak-proof travel lid and water-resistant chassis design further underscore the focus on true portability and durability.

What are the Key Data Covered in this Portable Blenders Market Research and Growth Report?

  • What is the expected growth of the Portable Blenders Market between 2026 and 2030?

    • USD 97.3 million, at a CAGR of 9.3%

  • What segmentation does the market report cover?

    • The report is segmented by Distribution Channel (Offline, and Online), Material (Plastic, Glass, and Steel), End-user (Residential, and Commercial) and Geography (North America, APAC, Europe, South America, Middle East and Africa)

  • Which regions are analyzed in the report?

    • North America, APAC, Europe, South America and Middle East and Africa

  • What are the key growth drivers and market challenges?

    • Proliferation of health and wellness lifestyles among urban consumers, Stringent battery safety regulations and transport compliance hurdles

  • Who are the major players in the Portable Blenders Market?

    • Beast Health LLC, Bella Housewares, BLENDi, BlendJet Inc., BOSS Appliances LLP, Conair LLC, Fresh Juice Blender, Fridja Ltd., Haden Appliances, Hamilton Beach Brands Holding, JS Global Lifestyle Co. Ltd., KitchenAid, nutribullet LLC, PopBabies, SharkNinja Operating LLC, Smeg S.p.a., Spectrum Brands Inc., StoreBound LLC and Wonderchef Home Appliance Ltd

Market Research Insights

  • The market is characterized by rapid innovation, where user-centric design philosophy guides development. Models featuring a one-touch control interface show a 25% higher adoption rate compared to those with more complex settings, underscoring the demand for simplicity. Premium aesthetic design is also a key differentiator, correlating with a 40% increase in sales through the direct-to-consumer e-commerce model.
  • The focus on post-workout nutrition has led to dishwasher-safe components becoming a standard expectation, reducing cleanup time for active users. As a result, brands are increasingly adopting a modular appliance design to offer greater flexibility. This strategic alignment with consumer preferences for convenience and style is essential for maintaining a competitive edge in a crowded marketplace.

We can help! Our analysts can customize this portable blenders market research report to meet your requirements.

Get in touch

1. Executive Summary

1.1 Market overview

Executive Summary - Chart on Market Overview
Executive Summary - Data Table on Market Overview
Executive Summary - Chart on Global Market Characteristics
Executive Summary - Chart on Market by Geography
Executive Summary - Chart on Market Segmentation by Distribution Channel
Executive Summary - Chart on Market Segmentation by Material
Executive Summary - Chart on Market Segmentation by End-user
Executive Summary - Chart on Incremental Growth
Executive Summary - Data Table on Incremental Growth
Executive Summary - Chart on Company Market Positioning

2. Technavio Analysis

2.1 Analysis of price sensitivity, lifecycle, customer purchase basket, adoption rates, and purchase criteria

2.2 Criticality of inputs and Factors of differentiation

Chart on Overview on criticality of inputs and factors of differentiation

2.3 Factors of disruption

Chart on Overview on factors of disruption

2.4 Impact of drivers and challenges

Chart on Impact of drivers and challenges in 2025 and 2030

3. Market Landscape

3.1 Market ecosystem

Chart on Parent Market
Data Table on - Parent Market

3.2 Market characteristics

Chart on Market characteristics analysis

3.3 Value chain analysis

Chart on Value chain analysis

4. Market Sizing

4.1 Market definition

Data Table on Offerings of companies included in the market definition

4.2 Market segment analysis

Market segments

4.3 Market size 2025

4.4 Market outlook: Forecast for 2025-2030

Chart on Global - Market size and forecast 2025-2030 ($ million)
Data Table on Global - Market size and forecast 2025-2030 ($ million)
Chart on Global Market: Year-over-year growth 2025-2030 (%)
Data Table on Global Market: Year-over-year growth 2025-2030 (%)

5. Historic Market Size

5.1 Global Portable Blenders Market 2020 - 2024

Historic Market Size - Data Table on Global Portable Blenders Market 2020 - 2024 ($ million)

5.2 Distribution Channel segment analysis 2020 - 2024

Historic Market Size - Distribution Channel Segment 2020 - 2024 ($ million)

5.3 Material segment analysis 2020 - 2024

Historic Market Size - Material Segment 2020 - 2024 ($ million)

5.4 End-user segment analysis 2020 - 2024

Historic Market Size - End-user Segment 2020 - 2024 ($ million)

5.5 Geography segment analysis 2020 - 2024

Historic Market Size - Geography Segment 2020 - 2024 ($ million)

5.6 Country segment analysis 2020 - 2024

Historic Market Size - Country Segment 2020 - 2024 ($ million)

6. Qualitative Analysis

6.1 Impact of AI on global portable blenders market

6.2 Impact of geopolitical conflicts on global portable blenders market

7. Five Forces Analysis

7.1 Five forces summary

Five forces analysis - Comparison between 2025 and 2030

7.2 Bargaining power of buyers

Bargaining power of buyers - Impact of key factors 2025 and 2030

7.3 Bargaining power of suppliers

Bargaining power of suppliers - Impact of key factors in 2025 and 2030

7.4 Threat of new entrants

Threat of new entrants - Impact of key factors in 2025 and 2030

7.5 Threat of substitutes

Threat of substitutes - Impact of key factors in 2025 and 2030

7.6 Threat of rivalry

Threat of rivalry - Impact of key factors in 2025 and 2030

7.7 Market condition

Chart on Market condition - Five forces 2025 and 2030

8. Market Segmentation by Distribution Channel

8.1 Market segments

Chart on Distribution Channel - Market share 2025-2030 (%)
Data Table on Distribution Channel - Market share 2025-2030 (%)

8.2 Comparison by Distribution Channel

Chart on Comparison by Distribution Channel
Data Table on Comparison by Distribution Channel

8.3 Offline - Market size and forecast 2025-2030

Chart on Offline - Market size and forecast 2025-2030 ($ million)
Data Table on Offline - Market size and forecast 2025-2030 ($ million)
Chart on Offline - Year-over-year growth 2025-2030 (%)
Data Table on Offline - Year-over-year growth 2025-2030 (%)

8.4 Online - Market size and forecast 2025-2030

Chart on Online - Market size and forecast 2025-2030 ($ million)
Data Table on Online - Market size and forecast 2025-2030 ($ million)
Chart on Online - Year-over-year growth 2025-2030 (%)
Data Table on Online - Year-over-year growth 2025-2030 (%)

8.5 Market opportunity by Distribution Channel

Market opportunity by Distribution Channel ($ million)
Data Table on Market opportunity by Distribution Channel ($ million)

9. Market Segmentation by Material

9.1 Market segments

Chart on Material - Market share 2025-2030 (%)
Data Table on Material - Market share 2025-2030 (%)

9.2 Comparison by Material

Chart on Comparison by Material
Data Table on Comparison by Material

9.3 Plastic - Market size and forecast 2025-2030

Chart on Plastic - Market size and forecast 2025-2030 ($ million)
Data Table on Plastic - Market size and forecast 2025-2030 ($ million)
Chart on Plastic - Year-over-year growth 2025-2030 (%)
Data Table on Plastic - Year-over-year growth 2025-2030 (%)

9.4 Glass - Market size and forecast 2025-2030

Chart on Glass - Market size and forecast 2025-2030 ($ million)
Data Table on Glass - Market size and forecast 2025-2030 ($ million)
Chart on Glass - Year-over-year growth 2025-2030 (%)
Data Table on Glass - Year-over-year growth 2025-2030 (%)

9.5 Steel - Market size and forecast 2025-2030

Chart on Steel - Market size and forecast 2025-2030 ($ million)
Data Table on Steel - Market size and forecast 2025-2030 ($ million)
Chart on Steel - Year-over-year growth 2025-2030 (%)
Data Table on Steel - Year-over-year growth 2025-2030 (%)

9.6 Market opportunity by Material

Market opportunity by Material ($ million)
Data Table on Market opportunity by Material ($ million)

10. Market Segmentation by End-user

10.1 Market segments

Chart on End-user - Market share 2025-2030 (%)
Data Table on End-user - Market share 2025-2030 (%)

10.2 Comparison by End-user

Chart on Comparison by End-user
Data Table on Comparison by End-user

10.3 Residential - Market size and forecast 2025-2030

Chart on Residential - Market size and forecast 2025-2030 ($ million)
Data Table on Residential - Market size and forecast 2025-2030 ($ million)
Chart on Residential - Year-over-year growth 2025-2030 (%)
Data Table on Residential - Year-over-year growth 2025-2030 (%)

10.4 Commercial - Market size and forecast 2025-2030

Chart on Commercial - Market size and forecast 2025-2030 ($ million)
Data Table on Commercial - Market size and forecast 2025-2030 ($ million)
Chart on Commercial - Year-over-year growth 2025-2030 (%)
Data Table on Commercial - Year-over-year growth 2025-2030 (%)

10.5 Market opportunity by End-user

Market opportunity by End-user ($ million)
Data Table on Market opportunity by End-user ($ million)

11. Customer Landscape

11.1 Customer landscape overview

Analysis of price sensitivity, lifecycle, customer purchase basket, adoption rates, and purchase criteria

12. Geographic Landscape

12.1 Geographic segmentation

Chart on Market share by geography 2025-2030 (%)
Data Table on Market share by geography 2025-2030 (%)

12.2 Geographic comparison

Chart on Geographic comparison
Data Table on Geographic comparison

12.3 North America - Market size and forecast 2025-2030

Chart on North America - Market size and forecast 2025-2030 ($ million)
Data Table on North America - Market size and forecast 2025-2030 ($ million)
Chart on North America - Year-over-year growth 2025-2030 (%)
Data Table on North America - Year-over-year growth 2025-2030 (%)
Chart on Regional Comparison - North America
Data Table on Regional Comparison - North America

12.3.1 US - Market size and forecast 2025-2030

Chart on US - Market size and forecast 2025-2030 ($ million)
Data Table on US - Market size and forecast 2025-2030 ($ million)
Chart on US - Year-over-year growth 2025-2030 (%)
Data Table on US - Year-over-year growth 2025-2030 (%)

12.3.2 Canada - Market size and forecast 2025-2030

Chart on Canada - Market size and forecast 2025-2030 ($ million)
Data Table on Canada - Market size and forecast 2025-2030 ($ million)
Chart on Canada - Year-over-year growth 2025-2030 (%)
Data Table on Canada - Year-over-year growth 2025-2030 (%)

12.3.3 Mexico - Market size and forecast 2025-2030

Chart on Mexico - Market size and forecast 2025-2030 ($ million)
Data Table on Mexico - Market size and forecast 2025-2030 ($ million)
Chart on Mexico - Year-over-year growth 2025-2030 (%)
Data Table on Mexico - Year-over-year growth 2025-2030 (%)

12.4 APAC - Market size and forecast 2025-2030

Chart on APAC - Market size and forecast 2025-2030 ($ million)
Data Table on APAC - Market size and forecast 2025-2030 ($ million)
Chart on APAC - Year-over-year growth 2025-2030 (%)
Data Table on APAC - Year-over-year growth 2025-2030 (%)
Chart on Regional Comparison - APAC
Data Table on Regional Comparison - APAC

12.4.1 China - Market size and forecast 2025-2030

Chart on China - Market size and forecast 2025-2030 ($ million)
Data Table on China - Market size and forecast 2025-2030 ($ million)
Chart on China - Year-over-year growth 2025-2030 (%)
Data Table on China - Year-over-year growth 2025-2030 (%)

12.4.2 India - Market size and forecast 2025-2030

Chart on India - Market size and forecast 2025-2030 ($ million)
Data Table on India - Market size and forecast 2025-2030 ($ million)
Chart on India - Year-over-year growth 2025-2030 (%)
Data Table on India - Year-over-year growth 2025-2030 (%)

12.4.3 Japan - Market size and forecast 2025-2030

Chart on Japan - Market size and forecast 2025-2030 ($ million)
Data Table on Japan - Market size and forecast 2025-2030 ($ million)
Chart on Japan - Year-over-year growth 2025-2030 (%)
Data Table on Japan - Year-over-year growth 2025-2030 (%)

12.4.4 South Korea - Market size and forecast 2025-2030

Chart on South Korea - Market size and forecast 2025-2030 ($ million)
Data Table on South Korea - Market size and forecast 2025-2030 ($ million)
Chart on South Korea - Year-over-year growth 2025-2030 (%)
Data Table on South Korea - Year-over-year growth 2025-2030 (%)

12.4.5 Australia - Market size and forecast 2025-2030

Chart on Australia - Market size and forecast 2025-2030 ($ million)
Data Table on Australia - Market size and forecast 2025-2030 ($ million)
Chart on Australia - Year-over-year growth 2025-2030 (%)
Data Table on Australia - Year-over-year growth 2025-2030 (%)

12.4.6 Indonesia - Market size and forecast 2025-2030

Chart on Indonesia - Market size and forecast 2025-2030 ($ million)
Data Table on Indonesia - Market size and forecast 2025-2030 ($ million)
Chart on Indonesia - Year-over-year growth 2025-2030 (%)
Data Table on Indonesia - Year-over-year growth 2025-2030 (%)

12.5 Europe - Market size and forecast 2025-2030

Chart on Europe - Market size and forecast 2025-2030 ($ million)
Data Table on Europe - Market size and forecast 2025-2030 ($ million)
Chart on Europe - Year-over-year growth 2025-2030 (%)
Data Table on Europe - Year-over-year growth 2025-2030 (%)
Chart on Regional Comparison - Europe
Data Table on Regional Comparison - Europe

12.5.1 Germany - Market size and forecast 2025-2030

Chart on Germany - Market size and forecast 2025-2030 ($ million)
Data Table on Germany - Market size and forecast 2025-2030 ($ million)
Chart on Germany - Year-over-year growth 2025-2030 (%)
Data Table on Germany - Year-over-year growth 2025-2030 (%)

12.5.2 UK - Market size and forecast 2025-2030

Chart on UK - Market size and forecast 2025-2030 ($ million)
Data Table on UK - Market size and forecast 2025-2030 ($ million)
Chart on UK - Year-over-year growth 2025-2030 (%)
Data Table on UK - Year-over-year growth 2025-2030 (%)

12.5.3 France - Market size and forecast 2025-2030

Chart on France - Market size and forecast 2025-2030 ($ million)
Data Table on France - Market size and forecast 2025-2030 ($ million)
Chart on France - Year-over-year growth 2025-2030 (%)
Data Table on France - Year-over-year growth 2025-2030 (%)

12.5.4 Italy - Market size and forecast 2025-2030

Chart on Italy - Market size and forecast 2025-2030 ($ million)
Data Table on Italy - Market size and forecast 2025-2030 ($ million)
Chart on Italy - Year-over-year growth 2025-2030 (%)
Data Table on Italy - Year-over-year growth 2025-2030 (%)

12.5.5 Spain - Market size and forecast 2025-2030

Chart on Spain - Market size and forecast 2025-2030 ($ million)
Data Table on Spain - Market size and forecast 2025-2030 ($ million)
Chart on Spain - Year-over-year growth 2025-2030 (%)
Data Table on Spain - Year-over-year growth 2025-2030 (%)

12.5.6 The Netherlands - Market size and forecast 2025-2030

Chart on The Netherlands - Market size and forecast 2025-2030 ($ million)
Data Table on The Netherlands - Market size and forecast 2025-2030 ($ million)
Chart on The Netherlands - Year-over-year growth 2025-2030 (%)
Data Table on The Netherlands - Year-over-year growth 2025-2030 (%)

12.6 South America - Market size and forecast 2025-2030

Chart on South America - Market size and forecast 2025-2030 ($ million)
Data Table on South America - Market size and forecast 2025-2030 ($ million)
Chart on South America - Year-over-year growth 2025-2030 (%)
Data Table on South America - Year-over-year growth 2025-2030 (%)
Chart on Regional Comparison - South America
Data Table on Regional Comparison - South America

12.6.1 Brazil - Market size and forecast 2025-2030

Chart on Brazil - Market size and forecast 2025-2030 ($ million)
Data Table on Brazil - Market size and forecast 2025-2030 ($ million)
Chart on Brazil - Year-over-year growth 2025-2030 (%)
Data Table on Brazil - Year-over-year growth 2025-2030 (%)

12.6.2 Argentina - Market size and forecast 2025-2030

Chart on Argentina - Market size and forecast 2025-2030 ($ million)
Data Table on Argentina - Market size and forecast 2025-2030 ($ million)
Chart on Argentina - Year-over-year growth 2025-2030 (%)
Data Table on Argentina - Year-over-year growth 2025-2030 (%)

12.6.3 Colombia - Market size and forecast 2025-2030

Chart on Colombia - Market size and forecast 2025-2030 ($ million)
Data Table on Colombia - Market size and forecast 2025-2030 ($ million)
Chart on Colombia - Year-over-year growth 2025-2030 (%)
Data Table on Colombia - Year-over-year growth 2025-2030 (%)

12.7 Middle East and Africa - Market size and forecast 2025-2030

Chart on Middle East and Africa - Market size and forecast 2025-2030 ($ million)
Data Table on Middle East and Africa - Market size and forecast 2025-2030 ($ million)
Chart on Middle East and Africa - Year-over-year growth 2025-2030 (%)
Data Table on Middle East and Africa - Year-over-year growth 2025-2030 (%)
Chart on Regional Comparison - Middle East and Africa
Data Table on Regional Comparison - Middle East and Africa

12.7.1 UAE - Market size and forecast 2025-2030

Chart on UAE - Market size and forecast 2025-2030 ($ million)
Data Table on UAE - Market size and forecast 2025-2030 ($ million)
Chart on UAE - Year-over-year growth 2025-2030 (%)
Data Table on UAE - Year-over-year growth 2025-2030 (%)

12.7.2 Saudi Arabia - Market size and forecast 2025-2030

Chart on Saudi Arabia - Market size and forecast 2025-2030 ($ million)
Data Table on Saudi Arabia - Market size and forecast 2025-2030 ($ million)
Chart on Saudi Arabia - Year-over-year growth 2025-2030 (%)
Data Table on Saudi Arabia - Year-over-year growth 2025-2030 (%)

12.7.3 South Africa - Market size and forecast 2025-2030

Chart on South Africa - Market size and forecast 2025-2030 ($ million)
Data Table on South Africa - Market size and forecast 2025-2030 ($ million)
Chart on South Africa - Year-over-year growth 2025-2030 (%)
Data Table on South Africa - Year-over-year growth 2025-2030 (%)

12.7.4 Egypt - Market size and forecast 2025-2030

Chart on Egypt - Market size and forecast 2025-2030 ($ million)
Data Table on Egypt - Market size and forecast 2025-2030 ($ million)
Chart on Egypt - Year-over-year growth 2025-2030 (%)
Data Table on Egypt - Year-over-year growth 2025-2030 (%)

12.7.5 Morocco - Market size and forecast 2025-2030

Chart on Morocco - Market size and forecast 2025-2030 ($ million)
Data Table on Morocco - Market size and forecast 2025-2030 ($ million)
Chart on Morocco - Year-over-year growth 2025-2030 (%)
Data Table on Morocco - Year-over-year growth 2025-2030 (%)

12.8 Market opportunity by geography

Market opportunity by geography ($ million)
Data Tables on Market opportunity by geography ($ million)

13. Drivers, Challenges, and Opportunity

13.1 Market drivers

Proliferation of health and wellness lifestyles among urban consumers
Advancements in lithium ion battery technology and charging infrastructure
Rising demand for space saving and multifunctional kitchen solutions

13.2 Market challenges

Stringent battery safety regulations and transport compliance hurdles
Counterfeit products and low cost market fragmentation
Limitations in motor power and durability for challenging ingredients

13.3 Impact of drivers and challenges

Impact of drivers and challenges in 2025 and 2030

13.4 Market opportunities

Integration of smart technology and digital health ecosystems
Transition toward sustainable materials and circular economy principles
Diversification of functionality and hybrid culinary applications

14. Competitive Landscape

14.1 Overview

14.2

Overview on criticality of inputs and factors of differentiation

14.3 Landscape disruption

Overview on factors of disruption

14.4 Industry risks

Impact of key risks on business

15. Competitive Analysis

15.1 Companies profiled

Companies covered

15.2 Company ranking index

15.3 Market positioning of companies

Matrix on companies position and classification

15.4 Bella Housewares

Bella Housewares - Overview
Bella Housewares - Product / Service
Bella Housewares - Key offerings
SWOT

15.5 BLENDi

BLENDi - Overview
BLENDi - Product / Service
BLENDi - Key offerings
SWOT

15.6 BOSS Appliances LLP

BOSS Appliances LLP - Overview
BOSS Appliances LLP - Product / Service
BOSS Appliances LLP - Key offerings
SWOT

15.7 Conair LLC

Conair LLC - Overview
Conair LLC - Product / Service
Conair LLC - Key offerings
SWOT

15.8 Fridja Ltd.

Fridja Ltd. - Overview
Fridja Ltd. - Product / Service
Fridja Ltd. - Key offerings
SWOT

15.9 Haden Appliances

Haden Appliances - Overview
Haden Appliances - Product / Service
Haden Appliances - Key offerings
SWOT

15.10 Hamilton Beach Brands Holding

Hamilton Beach Brands Holding - Overview
Hamilton Beach Brands Holding - Product / Service
Hamilton Beach Brands Holding - Key offerings
SWOT

15.11 KitchenAid

KitchenAid - Overview
KitchenAid - Product / Service
KitchenAid - Key offerings
SWOT

15.12 nutribullet LLC

nutribullet LLC - Overview
nutribullet LLC - Product / Service
nutribullet LLC - Key offerings
SWOT

15.13 PopBabies

PopBabies - Overview
PopBabies - Product / Service
PopBabies - Key offerings
SWOT

15.14 SharkNinja Operating LLC

SharkNinja Operating LLC - Overview
SharkNinja Operating LLC - Business segments
SharkNinja Operating LLC - Key offerings
SharkNinja Operating LLC - Segment focus
SWOT

15.15 Smeg S.p.a.

Smeg S.p.a. - Overview
Smeg S.p.a. - Product / Service
Smeg S.p.a. - Key offerings
SWOT

15.16 Spectrum Brands Inc.

Spectrum Brands Inc. - Overview
Spectrum Brands Inc. - Product / Service
Spectrum Brands Inc. - Key offerings
SWOT

15.17 StoreBound LLC

StoreBound LLC - Overview
StoreBound LLC - Product / Service
StoreBound LLC - Key offerings
SWOT

15.18 Wonderchef Home Appliance Ltd

Wonderchef Home Appliance Ltd - Overview
Wonderchef Home Appliance Ltd - Product / Service
Wonderchef Home Appliance Ltd - Key offerings
SWOT

16. Appendix

16.1 Scope of the report

Market definition
Objectives
Notes and caveats

16.2 Inclusions and exclusions checklist

Inclusions checklist
Exclusions checklist

16.3 Currency conversion rates for US$

16.4 Research methodology

16.5 Data procurement

Information sources

16.6 Data validation

16.7 Validation techniques employed for market sizing

16.8 Data synthesis

16.9 360 degree market analysis

16.10 List of abbreviations

Research Methodology

Technavio presents a detailed picture of the market by way of study, synthesis, and summation of data from multiple sources. The analysts have presented the various facets of the market with a particular focus on identifying the key industry influencers. The data thus presented is comprehensive, reliable, and the result of extensive research, both primary and secondary.

INFORMATION SOURCES

Primary sources

  • Manufacturers and suppliers
  • Channel partners
  • Industry experts
  • Strategic decision makers

Secondary sources

  • Industry journals and periodicals
  • Government data
  • Financial reports of key industry players
  • Historical data
  • Press releases

DATA ANALYSIS

Data Synthesis

  • Collation of data
  • Estimation of key figures
  • Analysis of derived insights

Data Validation

  • Triangulation with data models
  • Reference against proprietary databases
  • Corroboration with industry experts

REPORT WRITING

Qualitative

  • Market drivers
  • Market challenges
  • Market trends
  • Five forces analysis

Quantitative

  • Market size and forecast
  • Market segmentation
  • Geographical insights
  • Competitive landscape

Interested in this report?

Get your sample now to see our research methodology and insights!

Download Now

Frequently Asked Questions

Portable Blenders market growth will increase by USD 97.3 million during 2026-2030.

The Portable Blenders market is expected to grow at a CAGR of 9.3% during 2026-2030.

Portable Blenders market is segmented by Distribution channel (Offline, Online) Material (Plastic, Glass, Steel) End-user (Residential, Commercial)

Beast Health LLC, Bella Housewares, BLENDi, BlendJet Inc., BOSS Appliances LLP, Conair LLC, Fresh Juice Blender, Fridja Ltd., Haden Appliances, Hamilton Beach Brands Holding, JS Global Lifestyle Co. Ltd., KitchenAid, nutribullet LLC, PopBabies, SharkNinja Operating LLC, Smeg S.p.a., Spectrum Brands Inc., StoreBound LLC, Wonderchef Home Appliance Ltd are a few of the key vendors in the Portable Blenders market.

North America will register the highest growth rate of 32.9% among the other regions. Therefore, the Portable Blenders market in North America is expected to garner significant business opportunities for the vendors during the forecast period.

US, Canada, Mexico, China, India, Japan, South Korea, Australia, Indonesia, Germany, UK, France, Italy, Spain, The Netherlands, Brazil, Argentina, Colombia, UAE, Saudi Arabia, South Africa, Egypt, Morocco

  • Proliferation of health and wellness lifestyles among urban consumers is the driving factor this market.

The Portable Blenders market vendors should focus on grabbing business opportunities from the Distribution channel segment as it accounted for the largest market share in the base year.
RIA - Research AI Assistant
Ask RIA