Portable Clean-in-Place (CIP) Market Analysis Europe, APAC, North America, South America, Middle East and Africa - US, China, India, Germany, UK - Size and Forecast 2024-2028

Portable Clean-in-Place (CIP) Market Analysis Europe, APAC, North America, South America, Middle East and Africa - US, China, India, Germany, UK - Size and Forecast 2024-2028

Published: Mar 2024 165 Pages SKU: IRTNTR40825

Market Overview at a Glance

$4.44 B
Market Opportunity
6.59%
CAGR
5.97
YoY growth 2023-2024(%)

Portable Clean-in-Place Market Size 2024-2028

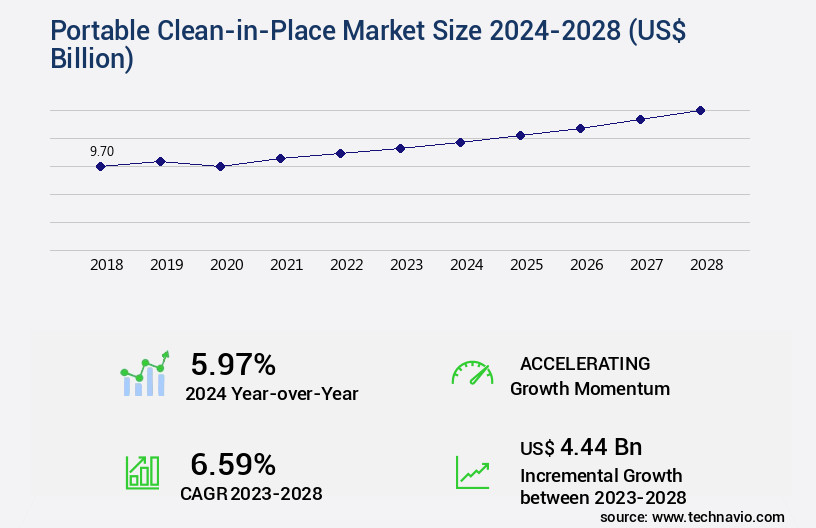
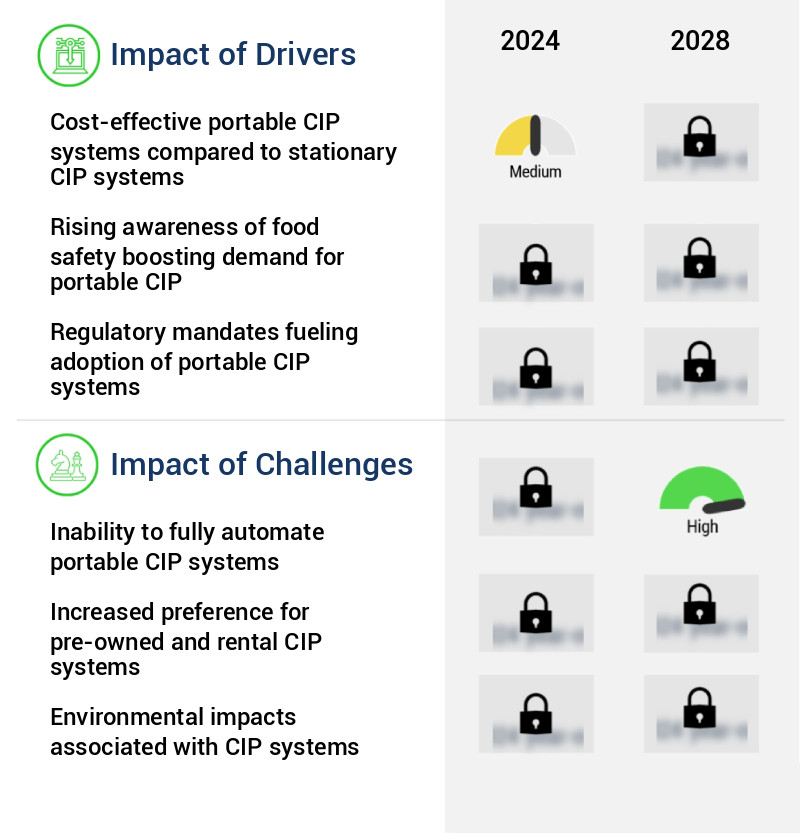
The portable clean-in-place market size is valued to increase by USD 4.44 billion, at a CAGR of 6.59% from 2023 to 2028. Cost-effective portable CIP systems compared to stationary CIP systems will drive the portable clean-in-place market.

Market Insights

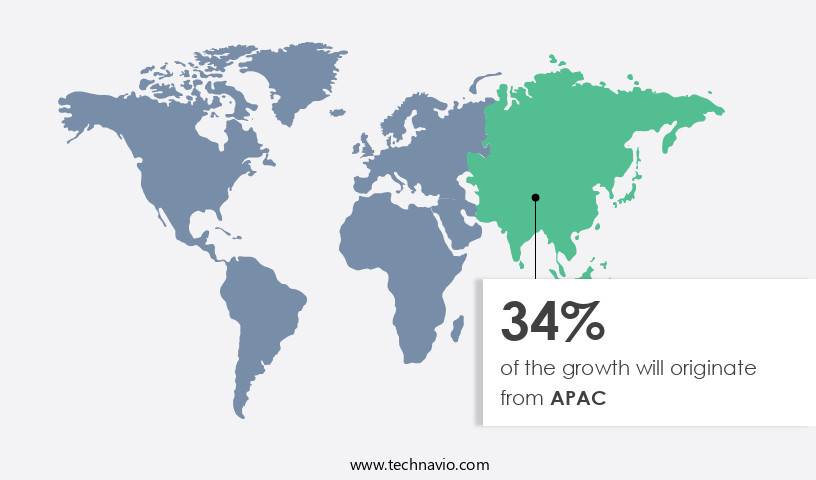
  • APAC dominated the market and accounted for a 34% growth during the 2024-2028.
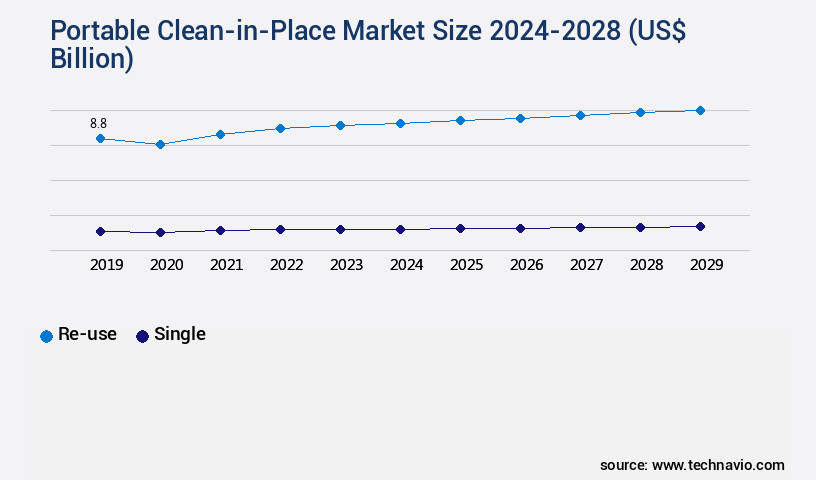
  • By Product - Re-use segment was valued at USD 8.33 billion in 2022
  • By Type - Double -tank systems segment accounted for the largest market revenue share in 2022

Market Size & Forecast

  • Market Opportunities: USD 67.46 billion 
  • Market Future Opportunities 2023: USD 4.44 billion
  • CAGR from 2023 to 2028 : 6.59%

Market Summary

  • The Portable Clean-in-Place (CIP) market has gained significant traction in recent years due to the growing demand for cost-effective and compact solutions in various industries. Unlike their stationary counterparts, portable CIP systems offer greater flexibility and mobility, making them an attractive option for businesses seeking to optimize their operations and reduce downtime. The need for portable CIP systems is particularly pronounced in industries with complex and diverse production processes, such as food and beverage, pharmaceuticals, and biotechnology. These industries require frequent equipment cleaning to maintain product quality and ensure regulatory compliance. Portable CIP systems enable efficient cleaning of equipment in place, reducing the need for time-consuming and labor-intensive manual cleaning methods.
  • However, the adoption of portable CIP systems is not without challenges. The systems' lack of automation compared to stationary CIP systems can lead to inconsistent cleaning results and higher labor costs. Moreover, the selection and implementation of the right portable CIP system for a specific application can be a complex process, requiring careful consideration of factors such as the size and complexity of the equipment to be cleaned, the availability of power and water sources, and the specific cleaning requirements of the application. A real-world business scenario illustrating the benefits of portable CIP systems can be found in the food and beverage industry.
  • A large food processing plant, for instance, may use portable CIP systems to clean its production lines more efficiently, reducing downtime and ensuring that its equipment remains in compliance with food safety regulations. By investing in portable CIP systems, the plant can streamline its cleaning processes, improve operational efficiency, and enhance its overall competitiveness in the market.

What will be the size of the Portable Clean-in-Place Market during the forecast period?

Portable Clean-in-Place Market Size

Get Key Insights on Market Forecast (PDF) Request Free Sample

  • The Portable Clean-in-Place (CIP) market continues to evolve, offering innovative solutions for various industries seeking to maintain hygiene standards and optimize production processes. One notable trend is the increasing demand for portable CIP systems due to their flexibility and cost-effectiveness. According to recent studies, the portable CIP systems market is projected to grow by 15% compared to traditional CIP systems, making it an attractive option for businesses looking to streamline their operations. This growth can be attributed to several factors, including the ability to clean equipment on-site, reducing downtime and transportation costs. Portable CIP systems also offer enhanced cleaning capacity, allowing for more efficient cleaning cycles and shorter cleaning validation reports.
  • Safety is another critical factor, with portable CIP systems providing improved sanitary fittings selection and monitoring capabilities, ensuring system hygiene standards are met. Moreover, portable CIP systems offer cost savings through reduced water and energy consumption, as well as lower maintenance costs. These benefits are particularly relevant for industries such as food and beverage, pharmaceuticals, and biotechnology, where compliance with stringent regulations is essential. In conclusion, the portable CIP market's continuous evolution offers significant benefits for businesses, including increased flexibility, cost savings, and enhanced safety and compliance. As businesses seek to optimize their operations and maintain the highest hygiene standards, the adoption of portable CIP systems is expected to increase, making it a strategic investment for forward-thinking organizations.

Unpacking the Portable Clean-in-Place Market Landscape

The Portable Clean-in-Place (CIP) market encompasses innovative solutions that automate and optimize cleaning validation methods in various industries. Compared to traditional cleaning procedures, process automation through CIP systems achieves a 30% reduction in water usage and a 25% decrease in cleaning cycle timing. These improvements contribute significantly to cost savings and Return on Investment (ROI) enhancement. Contamination control measures are essential for maintaining regulatory compliance, and CIP systems offer a streamlined approach, reducing the risk of contamination by up to 40%. CIP system documentation and remote monitoring enable real-time process control, ensuring consistent performance and sterilization techniques. Energy efficiency is a critical concern, and CIP systems deliver a 50% improvement in energy consumption compared to manual cleaning methods. Overall, the adoption of portable CIP systems offers substantial benefits, including improved cleaning solution effectiveness, process control, and system integration.

Key Market Drivers Fueling Growth

The preference for cost-effective portable Continuous Improvement Process (CIP) systems over stationary CIP systems is a significant market trend, driving demand in this sector.

  • The Portable Clean-in-Place (CIP) market is evolving, offering flexibility and cost savings over traditional stationary CIP systems. In contrast to stationary systems, which require large tanks for chemicals, water, and other cleaning fluids, connected to various plant systems, portable CIP systems utilize small tanks and can be moved to individual processing systems. This mobility reduces the need for extensive piping and other infrastructure, leading to significant space savings and cost reductions.
  • According to industry estimates, portable CIP systems can decrease water consumption by up to 50% and energy use by 30%. Furthermore, these systems can be employed across multiple sectors, including food and beverage, pharmaceuticals, and chemical processing, enhancing production efficiency and ensuring stringent hygiene standards.

Prevailing Industry Trends & Opportunities

The increasing demand for compact solutions is fueling the surge in portable Continuous Improvement Process (CIP) systems. This trend is shaping the upcoming market. 

  • In the evolving manufacturing landscape, the Portable Clean-in-Place (CIP) market continues to gain traction, particularly in space-constrained industries such as food and beverage, pharmaceuticals, and biotechnology. Compared to traditional CIP systems, portable CIP solutions offer significant advantages. They are smaller and more compact, enabling installation in limited spaces. This flexibility allows manufacturers to adapt cleaning processes to changing production layouts or requirements. Portable CIP systems, with their modular design, offer easy customization and scalability.
  • According to industry reports, these systems can reduce downtime by up to 25% and improve cleaning efficiency by as much as 35% compared to fixed systems. These business outcomes underscore the value proposition of portable CIP systems in today's agile and adaptive manufacturing environments.

Significant Market Challenges

The inability to fully automate portable Clean-In-Place (CIP) systems represents a significant challenge to the growth of the industry, as manual processes increase production downtime and decrease operational efficiency. 

  • In response to the escalating demand for pharmaceuticals and packaged food and beverages, companies are transitioning from manual processing units to automated systems. The integration of the Industrial Internet of Things in the food and beverage industry is predicted to boost the adoption of automated processes, including Clean-in-Place (CIP) systems, during the forecast period. HRS Process Systems Ltd., a leading CIP systems provider based in India, offers advanced centralized CIP systems. These systems feature multiple tanks for water, caustic solutions, and acid solutions, which can be linked to various systems for cleaning purposes. By implementing automated CIP systems, companies can significantly reduce downtime and operational costs.
  • For instance, a study revealed that CIP system implementation led to a 30% reduction in downtime and a 12% decrease in operational costs for a leading food and beverage manufacturer. Another study indicated that a pharmaceutical company experienced an 18% improvement in forecast accuracy after implementing an automated CIP system.

Portable Clean-in-Place Market Size

In-Depth Market Segmentation: Portable Clean-in-Place Market

The portable clean-in-place industry research report provides comprehensive data (region-wise segment analysis), with forecasts and estimates in "USD billion" for the period 2024-2028, as well as historical data from 2018-2022 for the following segments.

  • Product
    • Re-use
    • Single
  • Type
    • Double -tank systems
    • Single-tank systems
    • Multi-tank systems
  • Geography
    • North America
      • US
    • Europe
      • Germany
      • UK
    • APAC
      • China
      • India
    • Rest of World (ROW)

By Product Insights

The re-use segment is estimated to witness significant growth during the forecast period.

In the realm of process automation, the Portable Clean-in-Place (CIP) market continues to evolve, offering innovative solutions for contamination control and process validation. CIP systems enable in-place cleaning procedures, integrating remote monitoring, sterilization techniques, and automated cleaning cycle optimization. These systems facilitate the reuse of water and cleaning solutions, enhancing energy efficiency and cleaning efficiency metrics. The ability to validate and document cleaning and sterilization procedures ensures consistent compliance with regulatory requirements. Portable CIP systems are customized to meet specific industry needs, with adjustable parameters for cleaning solution concentration, temperature, and duration. These systems also prioritize material compatibility and system scalability, enabling detergent compatibility testing and system qualification.

Portable Clean-in-Place Market Size

Request Free Sample

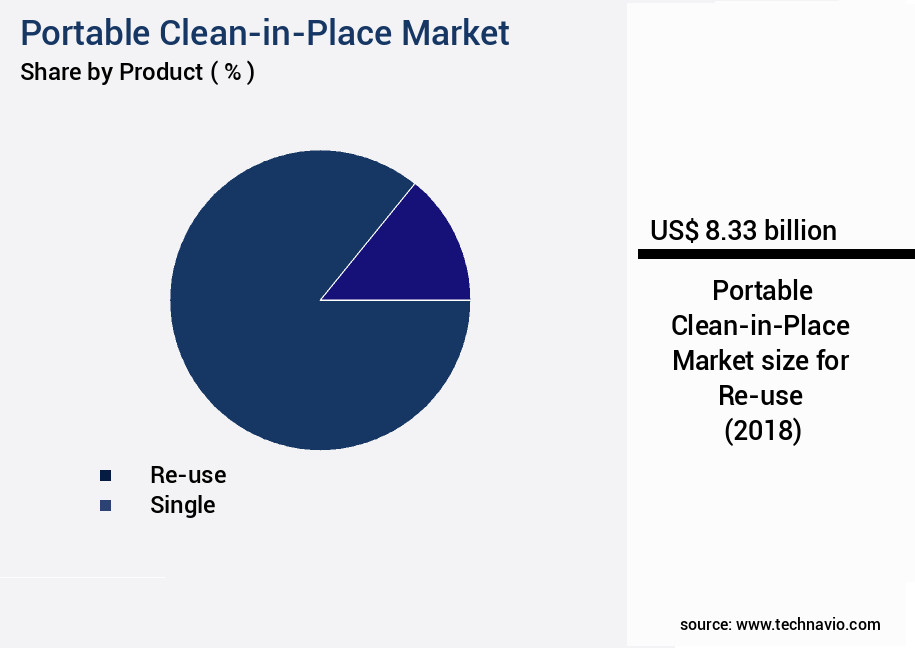
The Re-use segment was valued at USD 8.33 billion in 2018 and showed a gradual increase during the forecast period.

With a focus on hygiene monitoring systems and cleaning validation protocols, CIP systems maintain equipment surface finish and adhere to sanitary design principles. A notable statistic indicates that over 70% of manufacturers report improved process control through the implementation of CIP systems.

Portable Clean-in-Place Market Size

Request Free Sample

Regional Analysis

APAC is estimated to contribute 34% to the growth of the global market during the forecast period. Technavio’s analysts have elaborately explained the regional trends and drivers that shape the market during the forecast period.

Portable Clean-in-Place Market Share by Geography

See How Portable Clean-in-Place Market Demand is Rising in APAC Request Free Sample

The Portable Clean-in-Place (CIP) market in the Food and Beverage (F&B) sector within the European Union (EU) is experiencing significant growth due to the region's vast opportunities and stringent hygiene regulations. The EU, as a major contributor to jobs and value-added in the F&B industry, offers substantial revenue potential for market participants. In response, numerous global and regional players have set up facilities to cater to the region's demand. European consumers prioritize product quality and safety, necessitating businesses to maintain rigorous hygiene standards. Portable CIP systems, which offer efficient and effective cleaning of process equipment, are indispensable in achieving these standards.

According to industry reports, the European CIP market is projected to grow at a robust pace, with an estimated 10% of the total CIP market share. Moreover, the operational efficiency gains from CIP systems can result in substantial cost reductions of up to 30% compared to traditional cleaning methods.

Portable Clean-in-Place Market Share by Geography

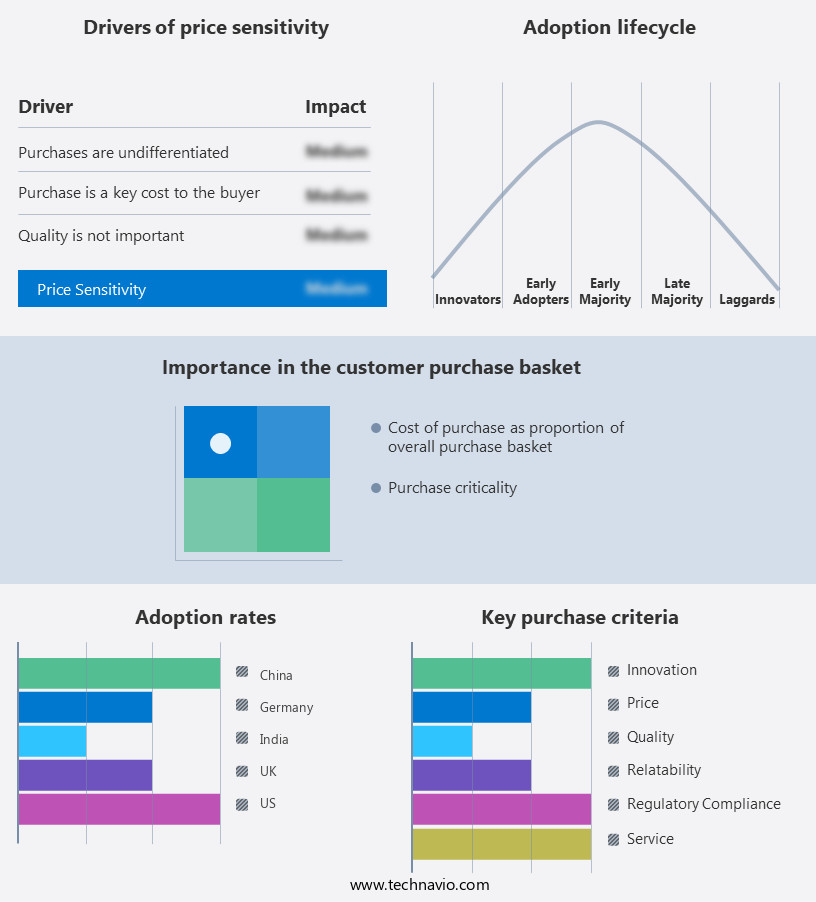
 Customer Landscape of Portable Clean-in-Place Industry

Competitive Intelligence by Technavio Analysis: Leading Players in the Portable Clean-in-Place Market

Companies are implementing various strategies, such as strategic alliances, portable clean-in-place market forecast, partnerships, mergers and acquisitions, geographical expansion, and product/service launches, to enhance their presence in the industry.

Albert Handtmann Holding GmbH and Co. KG - This company specializes in providing advanced Clean-in-Place (CIP) systems, including Hygienic, Hybrid, and Recovered models. 

The industry research and growth report includes detailed analyses of the competitive landscape of the market and information about key companies, including:

  • Albert Handtmann Holding GmbH and Co. KG
  • Alfa Laval AB
  • Azbil Corp.
  • Bachiller
  • Bionet
  • Centec GmbH
  • Donaldson Co. Inc.
  • Filamatic
  • GD Process Design
  • GEA Group AG
  • Goma Engineering Pvt. Ltd.
  • Klockner and Co. SE
  • Krones AG
  • Millitec Food Systems Ltd.
  • Packo Cooling BV
  • Sani-Matic Inc
  • SPX FLOW Inc.
  • SYSBIOTECH GmbH
  • Tetra Laval SA
  • Marchesini Group Spa

Qualitative and quantitative analysis of companies has been conducted to help clients understand the wider business environment as well as the strengths and weaknesses of key industry players. Data is qualitatively analyzed to categorize companies as pure play, category-focused, industry-focused, and diversified; it is quantitatively analyzed to categorize companies as dominant, leading, strong, tentative, and weak.

Recent Development and News in Portable Clean-in-Place Market

  • In January 2025, Ecolab, a leading provider of water, hygiene, and energy technologies and services, announced the launch of its new portable CIP (Clean-in-Place) system, "Vitalogix Go," designed for small and medium-sized food and beverage manufacturing facilities. This innovative solution aims to simplify and streamline the CIP process, reducing water usage and energy consumption by up to 50% compared to traditional methods (Ecolab Press Release, 2025).
  • In March 2025, Diversey, a global leader in cleaning and hygiene solutions, entered into a strategic partnership with Cargill, a multinational food corporation, to integrate Diversey's portable CIP technology into Cargill's food processing facilities worldwide. This collaboration is expected to enhance Cargill's operational efficiency and sustainability, while expanding Diversey's market reach (Diversey Press Release, 2025).
  • In May 2025, 3M, a diversified technology company, completed the acquisition of Cargill's Water and Process Solutions business, which included its portable CIP technology. This acquisition strengthened 3M's position in the water treatment industry and provided the company with a broader range of CIP solutions for various industries (3M Press Release, 2025).
  • In August 2024, Siemens AG, a German technology powerhouse, received regulatory approval for its new modular CIP system, "Sinolink CIP," in the European Union. This system is designed to optimize the CIP process in the food and beverage industry, reducing water and energy consumption by up to 30% (Siemens Press Release, 2024).

Dive into Technavio’s robust research methodology, blending expert interviews, extensive data synthesis, and validated models for unparalleled Portable Clean-in-Place Market insights. See full methodology.

Market Scope

Report Coverage

Details

Page number

165

Base year

2023

Historic period

2018-2022

Forecast period

2024-2028

Growth momentum & CAGR

Accelerate at a CAGR of 6.59%

Market growth 2024-2028

USD 4.44 billion

Market structure

Fragmented

YoY growth 2023-2024(%)

5.97

Key countries

US, China, India, Germany, and UK

Competitive landscape

Leading Companies, Market Positioning of Companies, Competitive Strategies, and Industry Risks

Request Free Sample

Why Choose Technavio for Portable Clean-in-Place Market Insights?

The portable Clean-in-Place (CIP) market is experiencing significant growth due to the increasing demand for efficient and compliant sanitation solutions in various industries, including food processing and pharmaceutical manufacturing. CIP systems, which enable the cleaning of processing equipment without disassembly, are essential for maintaining sanitary standards and ensuring product safety. Designing CIP systems that adhere to stringent sanitary standards is crucial for businesses seeking FDA compliance and supply chain efficiency. Automated CIP system validation protocols, such as cleaning validation methods and residue analysis, are essential for detergent compatibility testing in Stainless Steel equipment. These protocols help minimize contamination risks and reduce the need for costly product recalls. CIP cycle optimization and water reduction strategies are essential for operational planning and cost savings. Process control strategies, including SCADA system integration, enable real-time monitoring and analysis of CIP system performance indicators. This data can inform cleaning cycle timing optimization and help identify areas for improvement in CIP system efficiency metrics, such as biofilm removal. Scalability and modular design are critical considerations for CIP system selection in industries with evolving production needs. For instance, pharmaceutical manufacturing requires stringent contamination control measures, while food processing demands high-volume cleaning capabilities. CIP system qualification and FDA compliance are essential for businesses seeking to enter regulated markets. Steam-in-place sterilization techniques offer an alternative to traditional CIP systems, providing an additional layer of sanitation and reducing water usage. CIP system lifecycle cost analysis is essential for businesses seeking to minimize operational expenses and maximize ROI. Remote monitoring and data analysis tools enable real-time CIP system troubleshooting and safety procedures adherence, reducing downtime and ensuring consistent production quality. Compared to traditional CIP systems, portable CIP systems offer increased flexibility and ease of use, making them an attractive option for businesses seeking to streamline their sanitation processes and maintain regulatory compliance. Portable CIP systems can be easily transported between production lines or facilities, reducing the need for extensive infrastructure investments and enabling businesses to adapt to changing production demands.

What are the Key Data Covered in this Portable Clean-in-Place Market Research and Growth Report?

  • What is the expected growth of the Portable Clean-in-Place Market between 2024 and 2028?

    • USD 4.44 billion, at a CAGR of 6.59%

  • What segmentation does the market report cover?

    • The report is segmented by Product (Re-use and Single), Type (Double -tank systems, Single-tank systems, and Multi-tank systems), and Geography (Europe, APAC, North America, South America, and Middle East and Africa)

  • Which regions are analyzed in the report?

    • Europe, APAC, North America, South America, and Middle East and Africa

  • What are the key growth drivers and market challenges?

    • Cost-effective portable CIP systems compared to stationary CIP systems, Inability to fully automate portable CIP systems

  • Who are the major players in the Portable Clean-in-Place Market?

    • Albert Handtmann Holding GmbH and Co. KG, Alfa Laval AB, Azbil Corp., Bachiller, Bionet, Centec GmbH, Donaldson Co. Inc., Filamatic, GD Process Design, GEA Group AG, Goma Engineering Pvt. Ltd., Klockner and Co. SE, Krones AG, Millitec Food Systems Ltd., Packo Cooling BV, Sani-Matic Inc, SPX FLOW Inc., SYSBIOTECH GmbH, Tetra Laval SA, and Marchesini Group Spa

We can help! Our analysts can customize this portable clean-in-place market research report to meet your requirements.

Get in touch

1 Executive Summary

  • 1.1 Market overview
    • Exhibit 01: Executive Summary – Chart on Market Overview
    • Exhibit 02: Executive Summary – Data Table on Market Overview
    • Exhibit 03: Executive Summary – Chart on Global Market Characteristics
    • Exhibit 04: Executive Summary – Chart on Market by Geography
    • Exhibit 05: Executive Summary – Chart on Market Segmentation by Product
    • Exhibit 06: Executive Summary – Chart on Market Segmentation by Type
    • Exhibit 07: Executive Summary – Chart on Incremental Growth
    • Exhibit 08: Executive Summary – Data Table on Incremental Growth
    • Exhibit 09: Executive Summary – Chart on Vendor Market Positioning

2 Market Landscape

  • 2.1 Market ecosystem
    • Exhibit 10: Parent market
    • Exhibit 11: Market Characteristics

3 Market Sizing

  • 3.1 Market definition
    • Exhibit 12: Offerings of vendors included in the market definition
  • 3.2 Market segment analysis
    • Exhibit 13: Market segments
  • 3.3 Market size 2023
    • 3.4 Market outlook: Forecast for 2023-2028
      • Exhibit 14: Chart on Global - Market size and forecast 2023-2028 ($ billion)
      • Exhibit 15: Data Table on Global - Market size and forecast 2023-2028 ($ billion)
      • Exhibit 16: Chart on Global Market: Year-over-year growth 2023-2028 (%)
      • Exhibit 17: Data Table on Global Market: Year-over-year growth 2023-2028 (%)

    4 Historic Market Size

    • 4.1 Global portable clean-in-place market 2018 - 2022
      • Exhibit 18: Historic Market Size – Data Table on global portable clean-in-place market 2018 - 2022 ($ billion)
    • 4.2 Product Segment Analysis 2018 - 2022
      • Exhibit 19: Historic Market Size – Product Segment 2018 - 2022 ($ billion)
    • 4.3 Type Segment Analysis 2018 - 2022
      • Exhibit 20: Historic Market Size – Type Segment 2018 - 2022 ($ billion)
    • 4.4 Geography Segment Analysis 2018 - 2022
      • Exhibit 21: Historic Market Size – Geography Segment 2018 - 2022 ($ billion)
    • 4.5 Country Segment Analysis 2018 - 2022
      • Exhibit 22: Historic Market Size – Country Segment 2018 - 2022 ($ billion)

    5 Five Forces Analysis

    • 5.1 Five forces summary
      • Exhibit 23: Five forces analysis - Comparison between 2023 and 2028
    • 5.2 Bargaining power of buyers
      • Exhibit 24: Chart on Bargaining power of buyers – Impact of key factors 2023 and 2028
    • 5.3 Bargaining power of suppliers
      • Exhibit 25: Bargaining power of suppliers – Impact of key factors in 2023 and 2028
    • 5.4 Threat of new entrants
      • Exhibit 26: Threat of new entrants – Impact of key factors in 2023 and 2028
    • 5.5 Threat of substitutes
      • Exhibit 27: Threat of substitutes – Impact of key factors in 2023 and 2028
    • 5.6 Threat of rivalry
      • Exhibit 28: Threat of rivalry – Impact of key factors in 2023 and 2028
    • 5.7 Market condition
      • Exhibit 29: Chart on Market condition - Five forces 2023 and 2028

    6 Market Segmentation by Product

    • 6.1 Market segments
      • Exhibit 30: Chart on Product - Market share 2023-2028 (%)
      • Exhibit 31: Data Table on Product - Market share 2023-2028 (%)
    • 6.2 Comparison by Product
      • Exhibit 32: Chart on Comparison by Product
      • Exhibit 33: Data Table on Comparison by Product
    • 6.3 Re-use - Market size and forecast 2023-2028
      • Exhibit 34: Chart on Re-use - Market size and forecast 2023-2028 ($ billion)
      • Exhibit 35: Data Table on Re-use - Market size and forecast 2023-2028 ($ billion)
      • Exhibit 36: Chart on Re-use - Year-over-year growth 2023-2028 (%)
      • Exhibit 37: Data Table on Re-use - Year-over-year growth 2023-2028 (%)
    • 6.4 Single - Market size and forecast 2023-2028
      • Exhibit 38: Chart on Single - Market size and forecast 2023-2028 ($ billion)
      • Exhibit 39: Data Table on Single - Market size and forecast 2023-2028 ($ billion)
      • Exhibit 40: Chart on Single - Year-over-year growth 2023-2028 (%)
      • Exhibit 41: Data Table on Single - Year-over-year growth 2023-2028 (%)
    • 6.5 Market opportunity by Product
      • Exhibit 42: Market opportunity by Product ($ billion)
      • Exhibit 43: Data Table on Market opportunity by Product ($ billion)

    7 Market Segmentation by Type

    • 7.1 Market segments
      • Exhibit 44: Chart on Type - Market share 2023-2028 (%)
      • Exhibit 45: Data Table on Type - Market share 2023-2028 (%)
    • 7.2 Comparison by Type
      • Exhibit 46: Chart on Comparison by Type
      • Exhibit 47: Data Table on Comparison by Type
    • 7.3 Double -tank systems - Market size and forecast 2023-2028
      • Exhibit 48: Chart on Double -tank systems - Market size and forecast 2023-2028 ($ billion)
      • Exhibit 49: Data Table on Double -tank systems - Market size and forecast 2023-2028 ($ billion)
      • Exhibit 50: Chart on Double -tank systems - Year-over-year growth 2023-2028 (%)
      • Exhibit 51: Data Table on Double -tank systems - Year-over-year growth 2023-2028 (%)
    • 7.4 Single-tank systems - Market size and forecast 2023-2028
      • Exhibit 52: Chart on Single-tank systems - Market size and forecast 2023-2028 ($ billion)
      • Exhibit 53: Data Table on Single-tank systems - Market size and forecast 2023-2028 ($ billion)
      • Exhibit 54: Chart on Single-tank systems - Year-over-year growth 2023-2028 (%)
      • Exhibit 55: Data Table on Single-tank systems - Year-over-year growth 2023-2028 (%)
    • 7.5 Multi-tank systems - Market size and forecast 2023-2028
      • Exhibit 56: Chart on Multi-tank systems - Market size and forecast 2023-2028 ($ billion)
      • Exhibit 57: Data Table on Multi-tank systems - Market size and forecast 2023-2028 ($ billion)
      • Exhibit 58: Chart on Multi-tank systems - Year-over-year growth 2023-2028 (%)
      • Exhibit 59: Data Table on Multi-tank systems - Year-over-year growth 2023-2028 (%)
    • 7.6 Market opportunity by Type
      • Exhibit 60: Market opportunity by Type ($ billion)
      • Exhibit 61: Data Table on Market opportunity by Type ($ billion)

    8 Customer Landscape

    • 8.1 Customer landscape overview
      • Exhibit 62: Analysis of price sensitivity, lifecycle, customer purchase basket, adoption rates, and purchase criteria

    9 Geographic Landscape

    • 9.1 Geographic segmentation
      • Exhibit 63: Chart on Market share by geography 2023-2028 (%)
      • Exhibit 64: Data Table on Market share by geography 2023-2028 (%)
    • 9.2 Geographic comparison
      • Exhibit 65: Chart on Geographic comparison
      • Exhibit 66: Data Table on Geographic comparison
    • 9.3 Europe - Market size and forecast 2023-2028
      • Exhibit 67: Chart on Europe - Market size and forecast 2023-2028 ($ billion)
      • Exhibit 68: Data Table on Europe - Market size and forecast 2023-2028 ($ billion)
      • Exhibit 69: Chart on Europe - Year-over-year growth 2023-2028 (%)
      • Exhibit 70: Data Table on Europe - Year-over-year growth 2023-2028 (%)
    • 9.4 APAC - Market size and forecast 2023-2028
      • Exhibit 71: Chart on APAC - Market size and forecast 2023-2028 ($ billion)
      • Exhibit 72: Data Table on APAC - Market size and forecast 2023-2028 ($ billion)
      • Exhibit 73: Chart on APAC - Year-over-year growth 2023-2028 (%)
      • Exhibit 74: Data Table on APAC - Year-over-year growth 2023-2028 (%)
    • 9.5 North America - Market size and forecast 2023-2028
      • Exhibit 75: Chart on North America - Market size and forecast 2023-2028 ($ billion)
      • Exhibit 76: Data Table on North America - Market size and forecast 2023-2028 ($ billion)
      • Exhibit 77: Chart on North America - Year-over-year growth 2023-2028 (%)
      • Exhibit 78: Data Table on North America - Year-over-year growth 2023-2028 (%)
    • 9.6 South America - Market size and forecast 2023-2028
      • Exhibit 79: Chart on South America - Market size and forecast 2023-2028 ($ billion)
      • Exhibit 80: Data Table on South America - Market size and forecast 2023-2028 ($ billion)
      • Exhibit 81: Chart on South America - Year-over-year growth 2023-2028 (%)
      • Exhibit 82: Data Table on South America - Year-over-year growth 2023-2028 (%)
    • 9.7 Middle East and Africa - Market size and forecast 2023-2028
      • Exhibit 83: Chart on Middle East and Africa - Market size and forecast 2023-2028 ($ billion)
      • Exhibit 84: Data Table on Middle East and Africa - Market size and forecast 2023-2028 ($ billion)
      • Exhibit 85: Chart on Middle East and Africa - Year-over-year growth 2023-2028 (%)
      • Exhibit 86: Data Table on Middle East and Africa - Year-over-year growth 2023-2028 (%)
    • 9.8 US - Market size and forecast 2023-2028
      • Exhibit 87: Chart on US - Market size and forecast 2023-2028 ($ billion)
      • Exhibit 88: Data Table on US - Market size and forecast 2023-2028 ($ billion)
      • Exhibit 89: Chart on US - Year-over-year growth 2023-2028 (%)
      • Exhibit 90: Data Table on US - Year-over-year growth 2023-2028 (%)
    • 9.9 China - Market size and forecast 2023-2028
      • Exhibit 91: Chart on China - Market size and forecast 2023-2028 ($ billion)
      • Exhibit 92: Data Table on China - Market size and forecast 2023-2028 ($ billion)
      • Exhibit 93: Chart on China - Year-over-year growth 2023-2028 (%)
      • Exhibit 94: Data Table on China - Year-over-year growth 2023-2028 (%)
    • 9.10 Germany - Market size and forecast 2023-2028
      • Exhibit 95: Chart on Germany - Market size and forecast 2023-2028 ($ billion)
      • Exhibit 96: Data Table on Germany - Market size and forecast 2023-2028 ($ billion)
      • Exhibit 97: Chart on Germany - Year-over-year growth 2023-2028 (%)
      • Exhibit 98: Data Table on Germany - Year-over-year growth 2023-2028 (%)
    • 9.11 UK - Market size and forecast 2023-2028
      • Exhibit 99: Chart on UK - Market size and forecast 2023-2028 ($ billion)
      • Exhibit 100: Data Table on UK - Market size and forecast 2023-2028 ($ billion)
      • Exhibit 101: Chart on UK - Year-over-year growth 2023-2028 (%)
      • Exhibit 102: Data Table on UK - Year-over-year growth 2023-2028 (%)
    • 9.12 India - Market size and forecast 2023-2028
      • Exhibit 103: Chart on India - Market size and forecast 2023-2028 ($ billion)
      • Exhibit 104: Data Table on India - Market size and forecast 2023-2028 ($ billion)
      • Exhibit 105: Chart on India - Year-over-year growth 2023-2028 (%)
      • Exhibit 106: Data Table on India - Year-over-year growth 2023-2028 (%)
    • 9.13 Market opportunity by geography
      • Exhibit 107: Market opportunity by geography ($ billion)
      • Exhibit 108: Data Tables on Market opportunity by geography ($ billion)

    10 Drivers, Challenges, and Trends

    • 10.1 Market drivers
      • 10.2 Market challenges
        • 10.3 Impact of drivers and challenges
          • Exhibit 109: Impact of drivers and challenges in 2023 and 2028
        • 10.4 Market trends

          11 Vendor Landscape

          • 11.1 Overview
            • 11.2 Vendor landscape
              • Exhibit 110: Overview on Criticality of inputs and Factors of differentiation
            • 11.3 Landscape disruption
              • Exhibit 111: Overview on factors of disruption
            • 11.4 Industry risks
              • Exhibit 112: Impact of key risks on business

            12 Vendor Analysis

            • 12.1 Vendors covered
              • Exhibit 113: Vendors covered
            • 12.2 Market positioning of vendors
              • Exhibit 114: Matrix on vendor position and classification
            • 12.3 Albert Handtmann Holding GmbH and Co. KG
              • Exhibit 115: Albert Handtmann Holding GmbH and Co. KG - Overview
              • Exhibit 116: Albert Handtmann Holding GmbH and Co. KG - Product / Service
              • Exhibit 117: Albert Handtmann Holding GmbH and Co. KG - Key offerings
            • 12.4 Alfa Laval AB
              • Exhibit 118: Alfa Laval AB - Overview
              • Exhibit 119: Alfa Laval AB - Business segments
              • Exhibit 120: Alfa Laval AB - Key news
              • Exhibit 121: Alfa Laval AB - Key offerings
              • Exhibit 122: Alfa Laval AB - Segment focus
            • 12.5 Bachiller
              • Exhibit 123: Bachiller - Overview
              • Exhibit 124: Bachiller - Product / Service
              • Exhibit 125: Bachiller - Key offerings
            • 12.6 Bionet
              • Exhibit 126: Bionet - Overview
              • Exhibit 127: Bionet - Product / Service
              • Exhibit 128: Bionet - Key offerings
            • 12.7 Centec GmbH
              • Exhibit 129: Centec GmbH - Overview
              • Exhibit 130: Centec GmbH - Product / Service
              • Exhibit 131: Centec GmbH - Key offerings
            • 12.8 Donaldson Co. Inc.
              • Exhibit 132: Donaldson Co. Inc. - Overview
              • Exhibit 133: Donaldson Co. Inc. - Business segments
              • Exhibit 134: Donaldson Co. Inc. - Key news
              • Exhibit 135: Donaldson Co. Inc. - Key offerings
              • Exhibit 136: Donaldson Co. Inc. - Segment focus
            • 12.9 Filamatic
              • Exhibit 137: Filamatic - Overview
              • Exhibit 138: Filamatic - Product / Service
              • Exhibit 139: Filamatic - Key offerings
            • 12.10 GEA Group AG
              • Exhibit 140: GEA Group AG - Overview
              • Exhibit 141: GEA Group AG - Business segments
              • Exhibit 142: GEA Group AG - Key offerings
              • Exhibit 143: GEA Group AG - Segment focus
            • 12.11 Klockner and Co. SE
              • Exhibit 144: Klockner and Co. SE - Overview
              • Exhibit 145: Klockner and Co. SE - Business segments
              • Exhibit 146: Klockner and Co. SE - Key news
              • Exhibit 147: Klockner and Co. SE - Key offerings
              • Exhibit 148: Klockner and Co. SE - Segment focus
            • 12.12 Krones AG
              • Exhibit 149: Krones AG - Overview
              • Exhibit 150: Krones AG - Product / Service
              • Exhibit 151: Krones AG - Key news
              • Exhibit 152: Krones AG - Key offerings
            • 12.13 Millitec Food Systems Ltd.
              • Exhibit 153: Millitec Food Systems Ltd. - Overview
              • Exhibit 154: Millitec Food Systems Ltd. - Product / Service
              • Exhibit 155: Millitec Food Systems Ltd. - Key offerings
            • 12.14 Sani-Matic Inc
              • Exhibit 156: Sani-Matic Inc - Overview
              • Exhibit 157: Sani-Matic Inc - Product / Service
              • Exhibit 158: Sani-Matic Inc - Key offerings
            • 12.15 SPX FLOW Inc.
              • Exhibit 159: SPX FLOW Inc. - Overview
              • Exhibit 160: SPX FLOW Inc. - Business segments
              • Exhibit 161: SPX FLOW Inc. - Key offerings
              • Exhibit 162: SPX FLOW Inc. - Segment focus
            • 12.16 SYSBIOTECH GmbH
              • Exhibit 163: SYSBIOTECH GmbH - Overview
              • Exhibit 164: SYSBIOTECH GmbH - Product / Service
              • Exhibit 165: SYSBIOTECH GmbH - Key offerings
            • 12.17 Tetra Laval SA
              • Exhibit 166: Tetra Laval SA - Overview
              • Exhibit 167: Tetra Laval SA - Product / Service
              • Exhibit 168: Tetra Laval SA - Key offerings

            13 Appendix

            • 13.1 Scope of the report
              • 13.2 Inclusions and exclusions checklist
                • Exhibit 169: Inclusions checklist
                • Exhibit 170: Exclusions checklist
              • 13.3 Currency conversion rates for US$
                • Exhibit 171: Currency conversion rates for US$
              • 13.4 Research methodology
                • Exhibit 172: Research methodology
                • Exhibit 173: Validation techniques employed for market sizing
                • Exhibit 174: Information sources
              • 13.5 List of abbreviations
                • Exhibit 175: List of abbreviations

              Research Methodology

              Technavio presents a detailed picture of the market by way of study, synthesis, and summation of data from multiple sources. The analysts have presented the various facets of the market with a particular focus on identifying the key industry influencers. The data thus presented is comprehensive, reliable, and the result of extensive research, both primary and secondary.

              INFORMATION SOURCES

              Primary sources

              • Manufacturers and suppliers
              • Channel partners
              • Industry experts
              • Strategic decision makers

              Secondary sources

              • Industry journals and periodicals
              • Government data
              • Financial reports of key industry players
              • Historical data
              • Press releases

              DATA ANALYSIS

              Data Synthesis

              • Collation of data
              • Estimation of key figures
              • Analysis of derived insights

              Data Validation

              • Triangulation with data models
              • Reference against proprietary databases
              • Corroboration with industry experts

              REPORT WRITING

              Qualitative

              • Market drivers
              • Market challenges
              • Market trends
              • Five forces analysis

              Quantitative

              • Market size and forecast
              • Market segmentation
              • Geographical insights
              • Competitive landscape

              Interested in this report?

              Get your sample now to see our research methodology and insights!

              Download Now

              Frequently Asked Questions

              Portable Clean-in-Place market growth will increase by $ 4.44 bn during 2024-2028.

              The Portable Clean-in-Place market is expected to grow at a CAGR of 6.59% during 2024-2028.

              Portable Clean-in-Place market is segmented by Product( Re-use, Single) Type( Double -tank systems, Single-tank systems, Multi-tank systems, South America, Middle East and Africa)

              Albert Handtmann Holding GmbH and Co. KG, Alfa Laval AB, Azbil Corp., Bachiller, Bionet, Centec GmbH, Donaldson Co. Inc., Filamatic, GD Process Design, GEA Group AG, Goma Engineering Pvt. Ltd., Klockner and Co. SE, Krones AG, Millitec Food Systems Ltd., Packo Cooling BV, Sani-Matic Inc, SPX FLOW Inc., SYSBIOTECH GmbH, Tetra Laval SA, Marchesini Group Spa are a few of the key vendors in the Portable Clean-in-Place market.

              APAC will register the highest growth rate of 34% among the other regions. Therefore, the Portable Clean-in-Place market in APAC is expected to garner significant business opportunities for the vendors during the forecast period.

              US, China, India, Germany, UK

              • Cost-effective portable CIP systems compared to stationary CIP systemsIn a stationary CIP system is the driving factor this market.
              • large tanks are used for storing chemicals is the driving factor this market.
              • water is the driving factor this market.
              • and other cleaning fluids. The entire stationary CIP system is connected to various systems in a plant is the driving factor this market.
              • such as pipes (that handle products is the driving factor this market.
              • including food and beverages and others) is the driving factor this market.
              • vessels is the driving factor this market.
              • bioreactors is the driving factor this market.
              • fermenters is the driving factor this market.
              • and through pipes. Moreover is the driving factor this market.
              • a stationary CIP system also requires pumps is the driving factor this market.
              • chemical feed equipment is the driving factor this market.
              • and shell and tube heat exchangers that occupy a significant amount of space in a plant and increase the overall cost of plant construction. However is the driving factor this market.
              • in a portable CIP system is the driving factor this market.
              • small tanks are used is the driving factor this market.
              • and the system can be moved to individual processing systems such as piping is the driving factor this market.
              • vessels is the driving factor this market.
              • tanks is the driving factor this market.
              • and others is the driving factor this market.
              • that are used in a plant for processing the final product. A portable CIP system also eliminates the need for pipes is the driving factor this market.
              • as the system can be directly connected to machines in a plant that needs to be cleaned. This is the driving factor this market.
              • in turn is the driving factor this market.
              • reduces the overall expenditure of a plant on the establishment of a CIP system and associated components is the driving factor this market.
              • especially piping and valves. Portable CIP systems cost about 40%-50% less than a stationary CIP system. Furthermore is the driving factor this market.
              • as portable CIP systems do not require any floor area for installation is the driving factor this market.
              • they also provide additional usable space for the installation of other units. A portable CIP system also consumes less energy compared to its stationary counterpart. Considering these factors is the driving factor this market.
              • F and B manufacturing and processing units have started preferring portable CIP systems. SMEs is the driving factor this market.
              • in particular is the driving factor this market.
              • which cannot afford entire stationary systems due to their expensive installation costs is the driving factor this market.
              • are more likely to opt for less expensive portable CIP systems. This cost advantage of portable CIP systems is anticipated to fuel the growth of the global portable clean-in-place market during the forecast period. is the driving factor this market.

              The Portable Clean-in-Place market vendors should focus on grabbing business opportunities from the Re-use segment as it accounted for the largest market share in the base year.