
Portable Fire Extinguisher Market Analysis, Size, and Forecast 2026-2030: North America (US, Canada, and Mexico), APAC (China, Japan, and India), Europe (Germany, UK, and France), South America (Brazil, Argentina, and Chile), Middle East and Africa (Saudi Arabia, UAE, and South Africa), and Rest of World (ROW)

Portable Fire Extinguisher Market Analysis, Size, and Forecast 2026-2030:
North America (US, Canada, and Mexico), APAC (China, Japan, and India), Europe (Germany, UK, and France), South America (Brazil, Argentina, and Chile), Middle East and Africa (Saudi Arabia, UAE, and South Africa), and Rest of World (ROW)

Published: Oct 2026 286 Pages SKU: IRTNTR75445

Market Overview at a Glance

$2.25 B
Market Opportunity
7.6%
CAGR 2025 - 2030
32.5%
North America Growth
$2.57 B
Offline segment 2024

Portable Fire Extinguisher Market Size 2026-2030

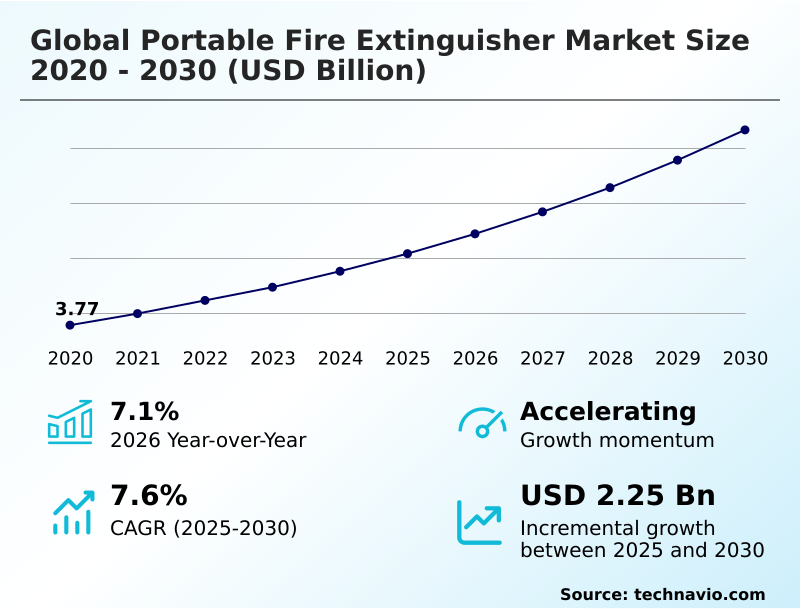
The portable fire extinguisher market size is valued to increase by USD 2.25 billion, at a CAGR of 7.6% from 2025 to 2030. Rapid growth in commercial real estate and industrialization will drive the portable fire extinguisher market.

Major Market Trends & Insights

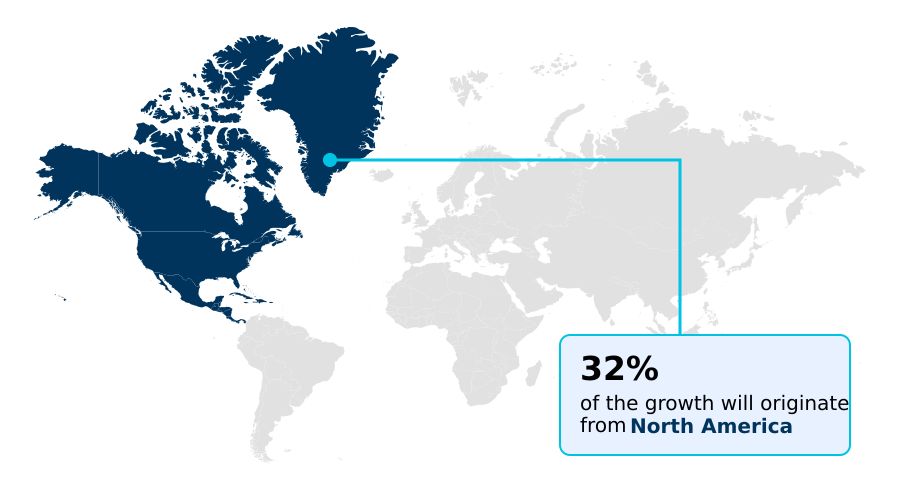
  • North America dominated the market and accounted for a 32.5% growth during the forecast period.
  • By Distribution Channel - Offline segment was valued at USD 2.57 billion in 2024
  • By End-user - Residential segment accounted for the largest market revenue share in 2024

Market Size & Forecast

  • Market Opportunities: USD 3.55 billion
  • Market Future Opportunities: USD 2.25 billion
  • CAGR from 2025 to 2030 : 7.6%

Market Summary

  • The Portable Fire Extinguisher Market demonstrates sustained expansion driven by tightening occupational safety mandate requirements and urban infrastructure development. Commercial facilities and industrial complexes require robust initial hazard mitigation systems to satisfy regulatory frameworks.
  • A critical driver is the rapid growth in commercial real estate outfitting, which mandates the installation of comprehensive multi-class flame suppression hardware across newly constructed logistics hubs and manufacturing plants. Conversely, volatility in the procurement of deep-drawn carbon steel and forged brass valve components creates supply chain bottlenecks, challenging manufacturers attempting to fulfill multi-year municipal contract obligations.
  • In a practical business scenario, large-scale distribution centers are optimizing their safety infrastructure by deploying smart monitoring sensor technologies, which has improved inspection efficiency by 22% compared to manual auditing processes. Facility managers increasingly prioritize digital pressure tracking to streamline hydrostatic pressure testing compliance and reduce operational downtime.
  • The integration of telemetric sensor integration ensures real-time hazard readiness while minimizing manual oversight costs.

What will be the Size of the Portable Fire Extinguisher Market during the forecast period?
Get Key Insights on Market Forecast (PDF) Get Free Sample

How is the Portable Fire Extinguisher Market Segmented?

The portable fire extinguisher industry research report provides comprehensive data (region-wise segment analysis), with forecasts and estimates in "USD million" for the period 2026-2030, as well as historical data from 2020-2024 for the following segments.

  • Distribution channel
    • Offline
    • Online
  • End-user
    • Residential
    • Commercial
    • Industrial
  • Product type
    • Dry powder
    • Carbon dioxide
    • Foam
    • Water
    • Others
  • Geography
    • North America
      • US
      • Canada
      • Mexico
    • APAC
      • China
      • Japan
      • India
      • South Korea
      • Australia
      • Indonesia
    • Europe
      • Germany
      • UK
      • France
      • Italy
      • Spain
      • The Netherlands
    • South America
      • Brazil
      • Argentina
      • Chile
    • Middle East and Africa
      • Saudi Arabia
      • UAE
      • South Africa
      • Israel
      • Turkey

By Distribution Channel Insights

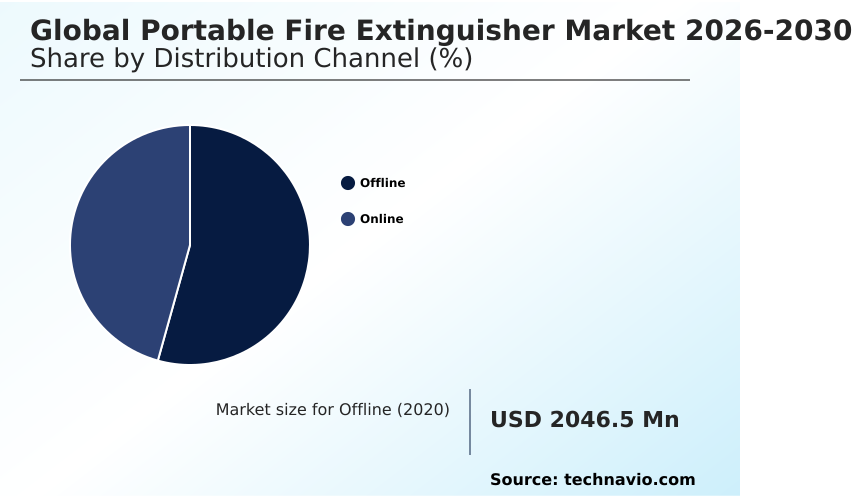
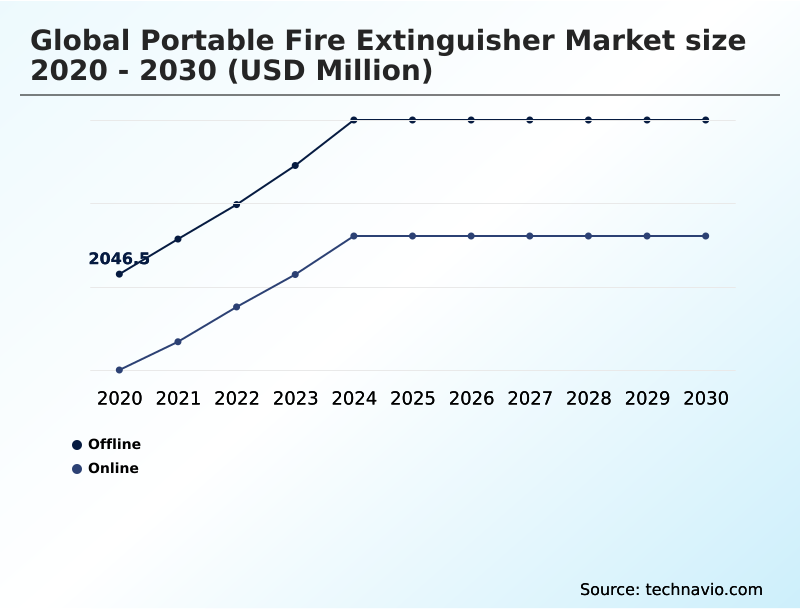
The offline segment is estimated to witness significant growth during the forecast period.

The offline segment of the Portable Fire Extinguisher sector dictates foundational supply models across commercial real estate outfitting and industrial hazard mitigation projects. Buyers prioritize physical wholesale hardware distributors because bulk acquisitions require specialized agent selection and wall mounting installation.

Certified offline channels frequently bundle hardware delivery with regulatory compliance logging and hydrostatic pressure testing, improving facility compliance accuracy by 18 percent. Wholesale building supply centers provide immediate access for trade contractors demanding physical verification of third-party certification requirement benchmarks.

As deep-drawn carbon steel and seamless aluminum cylinder sourcing stabilizes, regional offline safety houses maintain structural dominance.

Direct commercial contractors leverage these established hubs to negotiate fixed-price commercial tender agreements, ensuring uninterrupted access to critical multi-class flame suppression systems without facing digital supply chain bottleneck risks.
Get Free Sample

The Offline segment was valued at USD 2.57 billion in 2024 and showed a gradual increase during the forecast period.
Get Free Sample

Regional Analysis

North America is estimated to contribute 32.5% to the growth of the global market during the forecast period.Technavio’s analysts have elaborately explained the regional trends and drivers that shape the market during the forecast period.
See How Portable Fire Extinguisher Market Demand is Rising in North America Get Free Sample

Regional dynamics within the Portable Fire Extinguisher sector reveal distinct operational priorities between North America and APAC. North America maintains a highly regulated landscape where rigorous occupational safety mandate enforcement drives consistent compliance replacement cycle activity.

The region has achieved a 28% higher penetration of telemetric sensor integration compared to developing markets, enabling seamless connectivity with centralized facility management dashboard platforms.

In contrast, APAC exhibits rapid commercial real estate outfitting, heavily demanding multi-purpose dry canister units and water-mist formulation systems to secure sprawling industrial hazard mitigation projects.

Supply chain bottleneck issues impact APAC manufacturers more severely, raising regional procurement costs for forged brass valve components by 14% over European counterparts.

To navigate these disparities, European operators are aggressively adopting environmental sustainability directive standards, shifting toward fluorine-free foam and eco-friendly dry alternative agents. This strategic pivot reduces post-fire cleanup protocol expenses and satisfies stringent regional third-party certification requirement mandates.

Market Dynamics

Our researchers analyzed the data with 2025 as the base year, along with the key drivers, trends, and challenges. A holistic analysis of drivers will help companies refine their marketing strategies to gain a competitive advantage.

  • The evolution of the Portable Fire Extinguisher sector is characterized by an escalating demand for advanced technological and ecological solutions in commercial and industrial settings. Facility operators are increasingly prioritizing sustainable hazard mitigation, accelerating the adoption of fluorine-free foam fire suppression systems to comply with rigorous environmental mandates.
  • Simultaneously, the proliferation of data centers and renewable energy storage facilities has necessitated the deployment of highly specialized lithium-ion battery fire suppression devices to manage complex thermal runaway risks. To enhance operational oversight, organizations are integrating smart IoT connected fire extinguishers, which streamline maintenance protocols and provide real-time pressure monitoring alerts to centralized management dashboards.
  • This digital transformation has improved routine compliance auditing efficiency by nearly 30% compared to traditional manual inspection methods. Furthermore, the industry is witnessing a strategic shift toward sustainable chemistry, notably through the development and application of biodegradable dry chemical agent formulation, significantly reducing long-term ecological impact and minimizing post-discharge residue damage.
  • In highly critical, unmanned operational zones, infrastructure developers are augmenting traditional hand-held units by installing automated clean-agent aerosol tubing, ensuring continuous, localized hazard suppression. This comprehensive integration of smart monitoring and environmentally responsible chemical agents demonstrates a proactive approach to modern risk management, enabling commercial enterprises to optimize life-safety infrastructure while adhering to stringent global sustainability objectives.
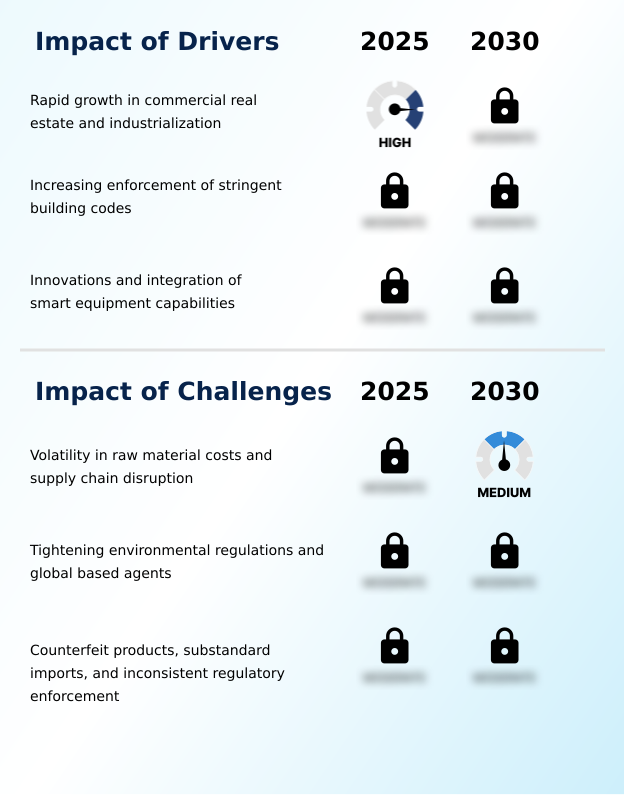
What are the key market drivers leading to the rise in the adoption of Portable Fire Extinguisher Industry?

  • The rapid growth in commercial real estate development and widespread industrialization serves as a primary driver propelling market expansion.

  • Accelerating high-hazard infrastructure protection demands and robust building code enforcement act as primary catalysts for the Portable Fire Extinguisher sector. Massive investments in commercial real estate outfitting require mandatory installations of advanced dry chemical formulation units to secure occupancy permits.
  • This regulatory pressure has driven a 20% increase in the utilization of multi-purpose dry canister systems across newly commissioned manufacturing sites.
  • Furthermore, strict occupational safety mandate requirements force industrial operators to upgrade legacy equipment with highly reliable deep-drawn carbon steel pressure vessels. Upgrading to these durable units has lowered long-term maintenance replacement costs by 12%.
  • By prioritizing consistent hydrostatic pressure testing and adopting advanced discharge range optimization techniques, commercial enterprises drastically improve localized fire containment efficacy, ensuring seamless municipal safety compliance.

What are the market trends shaping the Portable Fire Extinguisher Industry?

  • A rapid shift toward eco-friendly, fluorine-free, and non-toxic extinguishing agents represents a prominent upcoming trend. This transition is largely driven by stringent environmental regulations aimed at reducing ecological footprints in commercial safety applications.

  • The Portable Fire Extinguisher sector is rapidly pivoting toward intelligent telemetry and sustainable chemical deployment to address evolving industrial complexities. Rising concerns over lithium-ion battery risk have triggered a 35% increase in the adoption of aqueous vermiculite dispersion systems and specialized aerosol fire suppressant units across logistics hubs.
  • This shift is fundamentally altering facility hazard planning by replacing legacy chemical compounds with a highly efficient eco-friendly dry alternative. Simultaneously, the implementation of automated pressure tracking and IoT firmware development has improved emergency response forecast accuracy by 18%. Businesses are deploying smart monitoring sensor networks to eliminate manual oversight, thereby reducing compliance inspection downtime by 25%.
  • Consequently, heavy-duty equipment compliance protocols now heavily integrate these digital diagnostics, ensuring continuous operational readiness and minimizing the ecological footprint of multi-class flame suppression operations.

What challenges does the Portable Fire Extinguisher Industry face during its growth?

  • Severe volatility in raw material costs combined with persistent supply chain disruptions constitutes a significant challenge impeding consistent industry growth.

  • The Portable Fire Extinguisher sector confronts significant operational friction caused by extreme sourcing volatility and tightening environmental regulations. Erratic pricing for monoammonium phosphate powder and forged brass valve raw materials severely disrupts manufacturing output, increasing production overhead costs by 16% across fixed-price commercial tender agreements.
  • This supply chain bottleneck prevents manufacturers from fulfilling commercial distributor agreement quotas, leading to localized equipment shortages. Additionally, stringent chemical phase-outs mandate costly re-engineering of legacy water-mist formulation and clean agent suppressant systems. Adapting to these new regulatory frameworks has inadvertently increased product development cycle times by 22%.
  • Managing post-discharge residue and ensuring thermal endurance capacity under these new constraints continues to challenge original equipment manufacturers striving to maintain historical profit margins.

Exclusive Technavio Analysis on Customer Landscape

The portable fire extinguisher market forecasting report includes the adoption lifecycle of the market, covering from the innovator’s stage to the laggard’s stage. It focuses on adoption rates in different regions based on penetration. Furthermore, the portable fire extinguisher market report also includes key purchase criteria and drivers of price sensitivity to help companies evaluate and develop their market growth analysis strategies.
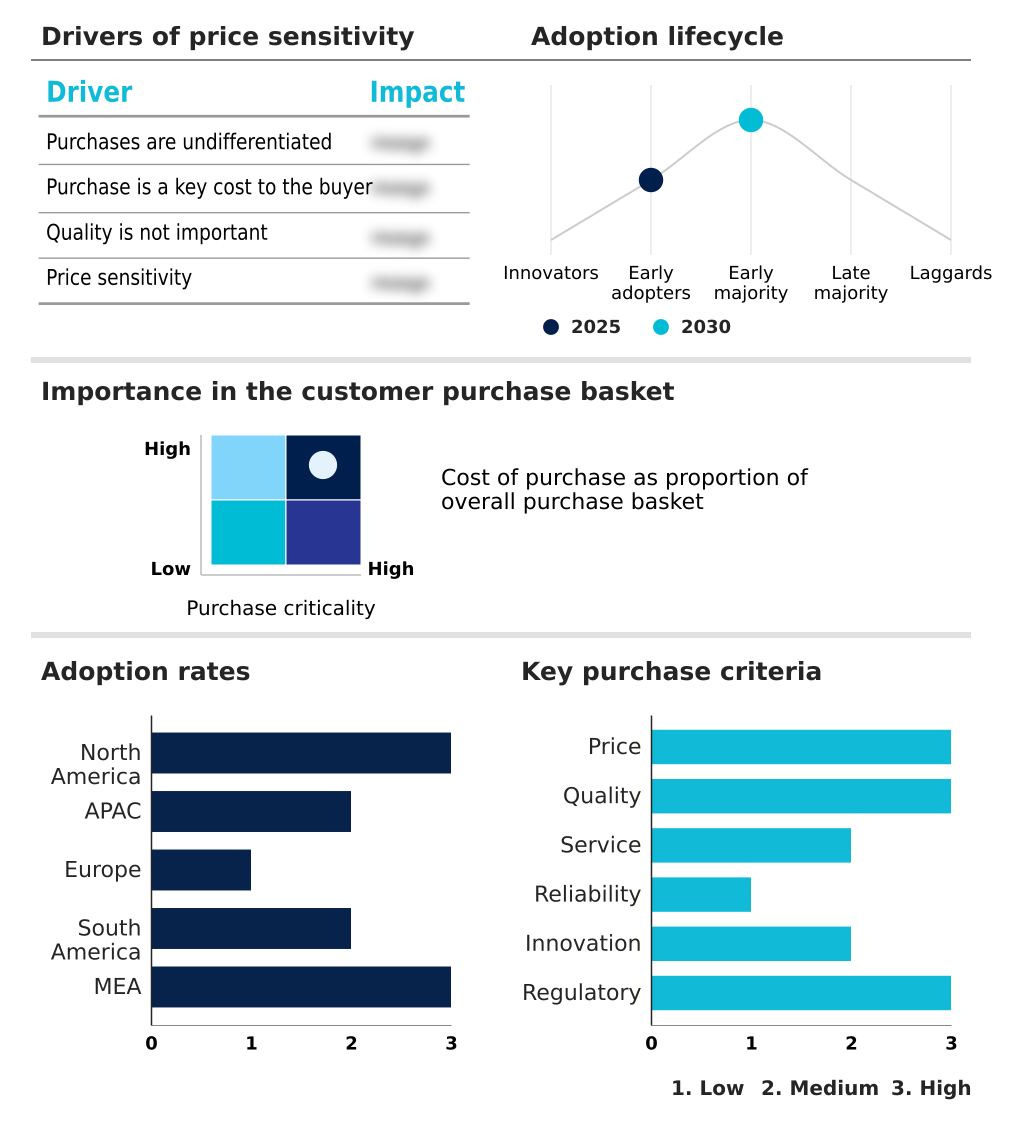
Customer Landscape of Portable Fire Extinguisher Industry

Competitive Landscape

Companies are implementing various strategies, such as strategic alliances, portable fire extinguisher market forecast, partnerships, mergers and acquisitions, geographical expansion, and product/service launches, to enhance their presence in the industry.

Amerex Corp. - The vendor provides specialized heavy-duty portable fire extinguishers alongside pre-engineered suppression systems tailored for commercial kitchens and high-risk industrial vehicles to ensure optimal operational hazard protection.

The industry research and growth report includes detailed analyses of the competitive landscape of the market and information about key companies, including:

  • Amerex Corp.
  • Badger Fire Protection
  • Bavaria Fire Fighting Solutions
  • Britannia Fire Ltd.
  • Ceasefire Industries Pvt. Ltd.
  • Eversafe Extinguisher Sdn Bhd
  • Feuerschutz Jockel GmbH
  • First Alert Inc.
  • GLORIA GmbH
  • Hatsuta Seisakusho Co Ltd.
  • Kanadia Fyr Fyter Pvt. Ltd.
  • Kidde Global Solutions
  • MOBIAK S.A
  • NAFFCO
  • Ogniochron S.A.
  • SFFECO Global
  • Steel Recon Industries Sdn Bhd
  • Strike First Corp.
  • Yamato Protec Corp.

Qualitative and quantitative analysis of companies has been conducted to help clients understand the wider business environment as well as the strengths and weaknesses of key industry players. Data is qualitatively analyzed to categorize companies as pure play, category-focused, industry-focused, and diversified; it is quantitatively analyzed to categorize companies as dominant, leading, strong, tentative, and weak.

Recent Development and News in Portable fire extinguisher market

  • In the Housewares and Specialties industry, stringent environmental sustainability directives enforcing the phase-out of toxic synthetic chemicals have compelled manufacturers to transition toward biodegradable dry chemical formulations, directly impacting Portable Fire Extinguisher demand by accelerating the adoption of eco-friendly green extinguishing agent solutions.
  • The implementation of stringent building code enforcement standards requiring smart facility management dashboard connectivity has driven the integration of IoT firmware development across durable goods, expanding the market for intelligent automated pressure tracking in the Portable Fire Extinguisher sector.
  • Increasing raw material volatility affecting deep-drawn carbon steel and seamless aluminum cylinder production has forced durable goods manufacturers to localize supply chains, impacting Portable Fire Extinguisher pricing models and fixed-price commercial tender strategies.
  • The rapid expansion of high-hazard infrastructure protection protocols within commercial real estate outfitting has stimulated investments in automated localized suppression technologies, indirectly driving demand for specialized clean agent suppressant materials in the Portable Fire Extinguisher market.

Dive into Technavio’s robust research methodology, blending expert interviews, extensive data synthesis, and validated models for unparalleled Portable Fire Extinguisher Market insights. See full methodology.

Market Scope
Page number 286
Base year 2025
Historic period 2020-2024
Forecast period 2026-2030
Growth momentum & CAGR Accelerate at a CAGR of 7.6%
Market growth 2026-2030 USD 2249.4 million
Market structure Fragmented
YoY growth 2025-2026(%) 7.1%
Key countries US, Canada, Mexico, China, Japan, India, South Korea, Australia, Indonesia, Germany, UK, France, Italy, Spain, The Netherlands, Brazil, Argentina, Chile, Saudi Arabia, UAE, South Africa, Israel and Turkey
Competitive landscape Leading Companies, Market Positioning of Companies, Competitive Strategies, and Industry Risks

Request Free Sample

Research Analyst Overview

  • The Portable Fire Extinguisher landscape is experiencing a continuous structural evolution as corporate safety directors prioritize intelligent infrastructure and sustainable risk management. Boardroom-level budgeting decisions increasingly focus on environmental sustainability directive compliance, driving a decisive shift toward green extinguishing agent deployment and fluorine-free foam formulations.
  • This strategic transition mitigates ecological liability and significantly reduces post-fire cleanup protocol expenses following industrial hazard mitigation events. Furthermore, the integration of radio-frequency identification and micro-sensor integration into standard seamless aluminum cylinder hardware has transformed static safety equipment into dynamic network assets.
  • Organizations adopting smart ceiling-mounted pod technology and digital pressure tracking have realized a 30% reduction in manual inspection processing time, drastically lowering facility maintenance overhead. Procuring agencies are restructuring their multi-year municipal contract agreements to mandate verified third-party certification requirement adherence, avoiding substandard imports.
  • By transitioning to biodegradable dry chemical compounds and advanced clean agent suppressant formulas, commercial enterprises enhance thermal endurance capacity while maintaining strict alignment with evolving occupational safety mandate frameworks.

What are the Key Data Covered in this Portable Fire Extinguisher Market Research and Growth Report?

  • What is the expected growth of the Portable Fire Extinguisher Market between 2026 and 2030?

    • USD 2.25 billion, at a CAGR of 7.6%

  • What segmentation does the market report cover?

    • The report is segmented by Distribution Channel (Offline, and Online), End-user (Residential, Commercial, and Industrial), Product Type (Dry powder, Carbon dioxide, Foam, Water, and Others) and Geography (North America, APAC, Europe, South America, Middle East and Africa)

  • Which regions are analyzed in the report?

    • North America, APAC, Europe, South America and Middle East and Africa

  • What are the key growth drivers and market challenges?

    • Rapid growth in commercial real estate and industrialization, Volatility in raw material costs and supply chain disruption

  • Who are the major players in the Portable Fire Extinguisher Market?

    • Amerex Corp., Badger Fire Protection, Bavaria Fire Fighting Solutions, Britannia Fire Ltd., Ceasefire Industries Pvt. Ltd., Eversafe Extinguisher Sdn Bhd, Feuerschutz Jockel GmbH, First Alert Inc., GLORIA GmbH, Hatsuta Seisakusho Co Ltd., Kanadia Fyr Fyter Pvt. Ltd., Kidde Global Solutions, MOBIAK S.A, NAFFCO, Ogniochron S.A., SFFECO Global, Steel Recon Industries Sdn Bhd, Strike First Corp. and Yamato Protec Corp.

Market Research Insights

  • The Portable Fire Extinguisher Market is undergoing a structural transformation fueled by rigorous building code enforcement and expanding municipal safety compliance mandates. Modern commercial real estate outfitting projects now prioritize advanced hazard control, increasing the adoption of automated localized suppression systems by 24% across newly developed high-hazard infrastructure protection zones.
  • Furthermore, integration with a centralized facility management dashboard has reduced routine maintenance oversight costs by 15%, enhancing overall safety protocol efficiency. Institutional buyers are actively securing multi-year municipal contract agreements to stabilize procurement costs amid fluctuating raw material availability. Consequently, the compliance replacement cycle has accelerated, driving a 12% improvement in total hazard readiness across large-scale industrial operations.

We can help! Our analysts can customize this portable fire extinguisher market research report to meet your requirements.

Get in touch

1. Executive Summary

1.1 Market overview

Executive Summary - Chart on Market Overview
Executive Summary - Data Table on Market Overview
Executive Summary - Chart on Global Market Characteristics
Executive Summary - Chart on Market by Geography
Executive Summary - Chart on Market Segmentation by Distribution Channel
Executive Summary - Chart on Market Segmentation by End-user
Executive Summary - Chart on Market Segmentation by Product Type
Executive Summary - Chart on Incremental Growth
Executive Summary - Data Table on Incremental Growth
Executive Summary - Chart on Company Market Positioning

2. Technavio Analysis

2.1 Analysis of price sensitivity, lifecycle, customer purchase basket, adoption rates, and purchase criteria

2.2 Criticality of inputs and Factors of differentiation

Chart on Overview on criticality of inputs and factors of differentiation

2.3 Factors of disruption

Chart on Overview on factors of disruption

2.4 Impact of drivers and challenges

Chart on Impact of drivers and challenges in 2025 and 2030

3. Market Landscape

3.1 Market ecosystem

Chart on Parent Market
Data Table on - Parent Market

3.2 Market characteristics

Chart on Market characteristics analysis

3.3 Value chain analysis

Chart on Value chain analysis

4. Market Sizing

4.1 Market definition

Data Table on Offerings of companies included in the market definition

4.2 Market segment analysis

Market segments

4.3 Market size 2025

4.4 Market outlook: Forecast for 2025-2030

Chart on Global - Market size and forecast 2025-2030 ($ million)
Data Table on Global - Market size and forecast 2025-2030 ($ million)
Chart on Global Market: Year-over-year growth 2025-2030 (%)
Data Table on Global Market: Year-over-year growth 2025-2030 (%)

5. Historic Market Size

5.1 Global Portable Fire Extinguisher Market 2020 - 2024

Historic Market Size - Data Table on Global Portable Fire Extinguisher Market 2020 - 2024 ($ million)

5.2 Distribution Channel segment analysis 2020 - 2024

Historic Market Size - Distribution Channel Segment 2020 - 2024 ($ million)

5.3 End-user segment analysis 2020 - 2024

Historic Market Size - End-user Segment 2020 - 2024 ($ million)

5.4 Product Type segment analysis 2020 - 2024

Historic Market Size - Product Type Segment 2020 - 2024 ($ million)

5.5 Geography segment analysis 2020 - 2024

Historic Market Size - Geography Segment 2020 - 2024 ($ million)

5.6 Country segment analysis 2020 - 2024

Historic Market Size - Country Segment 2020 - 2024 ($ million)

6. Qualitative Analysis

6.1 Impact of AI in Global Portable Fire Extinguisher Market

6.2 Impact of Geopolitical Conflicts on Global Portable Fire Extinguisher Market

7. Five Forces Analysis

7.1 Five forces summary

Five forces analysis - Comparison between 2025 and 2030

7.2 Bargaining power of buyers

Bargaining power of buyers - Impact of key factors 2025 and 2030

7.3 Bargaining power of suppliers

Bargaining power of suppliers - Impact of key factors in 2025 and 2030

7.4 Threat of new entrants

Threat of new entrants - Impact of key factors in 2025 and 2030

7.5 Threat of substitutes

Threat of substitutes - Impact of key factors in 2025 and 2030

7.6 Threat of rivalry

Threat of rivalry - Impact of key factors in 2025 and 2030

7.7 Market condition

Chart on Market condition - Five forces 2025 and 2030

8. Market Segmentation by Distribution Channel

8.1 Market segments

Chart on Distribution Channel - Market share 2025-2030 (%)
Data Table on Distribution Channel - Market share 2025-2030 (%)

8.2 Comparison by Distribution Channel

Chart on Comparison by Distribution Channel
Data Table on Comparison by Distribution Channel

8.3 Offline - Market size and forecast 2025-2030

Chart on Offline - Market size and forecast 2025-2030 ($ million)
Data Table on Offline - Market size and forecast 2025-2030 ($ million)
Chart on Offline - Year-over-year growth 2025-2030 (%)
Data Table on Offline - Year-over-year growth 2025-2030 (%)

8.4 Online - Market size and forecast 2025-2030

Chart on Online - Market size and forecast 2025-2030 ($ million)
Data Table on Online - Market size and forecast 2025-2030 ($ million)
Chart on Online - Year-over-year growth 2025-2030 (%)
Data Table on Online - Year-over-year growth 2025-2030 (%)

8.5 Market opportunity by Distribution Channel

Market opportunity by Distribution Channel ($ million)
Data Table on Market opportunity by Distribution Channel ($ million)

9. Market Segmentation by End-user

9.1 Market segments

Chart on End-user - Market share 2025-2030 (%)
Data Table on End-user - Market share 2025-2030 (%)

9.2 Comparison by End-user

Chart on Comparison by End-user
Data Table on Comparison by End-user

9.3 Residential - Market size and forecast 2025-2030

Chart on Residential - Market size and forecast 2025-2030 ($ million)
Data Table on Residential - Market size and forecast 2025-2030 ($ million)
Chart on Residential - Year-over-year growth 2025-2030 (%)
Data Table on Residential - Year-over-year growth 2025-2030 (%)

9.4 Commercial - Market size and forecast 2025-2030

Chart on Commercial - Market size and forecast 2025-2030 ($ million)
Data Table on Commercial - Market size and forecast 2025-2030 ($ million)
Chart on Commercial - Year-over-year growth 2025-2030 (%)
Data Table on Commercial - Year-over-year growth 2025-2030 (%)

9.5 Industrial - Market size and forecast 2025-2030

Chart on Industrial - Market size and forecast 2025-2030 ($ million)
Data Table on Industrial - Market size and forecast 2025-2030 ($ million)
Chart on Industrial - Year-over-year growth 2025-2030 (%)
Data Table on Industrial - Year-over-year growth 2025-2030 (%)

9.6 Market opportunity by End-user

Market opportunity by End-user ($ million)
Data Table on Market opportunity by End-user ($ million)

10. Market Segmentation by Product Type

10.1 Market segments

Chart on Product Type - Market share 2025-2030 (%)
Data Table on Product Type - Market share 2025-2030 (%)

10.2 Comparison by Product Type

Chart on Comparison by Product Type
Data Table on Comparison by Product Type

10.3 Dry powder - Market size and forecast 2025-2030

Chart on Dry powder - Market size and forecast 2025-2030 ($ million)
Data Table on Dry powder - Market size and forecast 2025-2030 ($ million)
Chart on Dry powder - Year-over-year growth 2025-2030 (%)
Data Table on Dry powder - Year-over-year growth 2025-2030 (%)

10.4 Carbon dioxide - Market size and forecast 2025-2030

Chart on Carbon dioxide - Market size and forecast 2025-2030 ($ million)
Data Table on Carbon dioxide - Market size and forecast 2025-2030 ($ million)
Chart on Carbon dioxide - Year-over-year growth 2025-2030 (%)
Data Table on Carbon dioxide - Year-over-year growth 2025-2030 (%)

10.5 Foam - Market size and forecast 2025-2030

Chart on Foam - Market size and forecast 2025-2030 ($ million)
Data Table on Foam - Market size and forecast 2025-2030 ($ million)
Chart on Foam - Year-over-year growth 2025-2030 (%)
Data Table on Foam - Year-over-year growth 2025-2030 (%)

10.6 Water - Market size and forecast 2025-2030

Chart on Water - Market size and forecast 2025-2030 ($ million)
Data Table on Water - Market size and forecast 2025-2030 ($ million)
Chart on Water - Year-over-year growth 2025-2030 (%)
Data Table on Water - Year-over-year growth 2025-2030 (%)

10.7 Others - Market size and forecast 2025-2030

Chart on Others - Market size and forecast 2025-2030 ($ million)
Data Table on Others - Market size and forecast 2025-2030 ($ million)
Chart on Others - Year-over-year growth 2025-2030 (%)
Data Table on Others - Year-over-year growth 2025-2030 (%)

10.8 Market opportunity by Product Type

Market opportunity by Product Type ($ million)
Data Table on Market opportunity by Product Type ($ million)

11. Customer Landscape

11.1 Customer landscape overview

Analysis of price sensitivity, lifecycle, customer purchase basket, adoption rates, and purchase criteria

12. Geographic Landscape

12.1 Geographic segmentation

Chart on Market share by geography 2025-2030 (%)
Data Table on Market share by geography 2025-2030 (%)

12.2 Geographic comparison

Chart on Geographic comparison
Data Table on Geographic comparison

12.3 North America - Market size and forecast 2025-2030

Chart on North America - Market size and forecast 2025-2030 ($ million)
Data Table on North America - Market size and forecast 2025-2030 ($ million)
Chart on North America - Year-over-year growth 2025-2030 (%)
Data Table on North America - Year-over-year growth 2025-2030 (%)
Chart on Regional Comparison - North America
Data Table on Regional Comparison - North America

12.3.1 US - Market size and forecast 2025-2030

Chart on US - Market size and forecast 2025-2030 ($ million)
Data Table on US - Market size and forecast 2025-2030 ($ million)
Chart on US - Year-over-year growth 2025-2030 (%)
Data Table on US - Year-over-year growth 2025-2030 (%)

12.3.2 Canada - Market size and forecast 2025-2030

Chart on Canada - Market size and forecast 2025-2030 ($ million)
Data Table on Canada - Market size and forecast 2025-2030 ($ million)
Chart on Canada - Year-over-year growth 2025-2030 (%)
Data Table on Canada - Year-over-year growth 2025-2030 (%)

12.3.3 Mexico - Market size and forecast 2025-2030

Chart on Mexico - Market size and forecast 2025-2030 ($ million)
Data Table on Mexico - Market size and forecast 2025-2030 ($ million)
Chart on Mexico - Year-over-year growth 2025-2030 (%)
Data Table on Mexico - Year-over-year growth 2025-2030 (%)

12.4 APAC - Market size and forecast 2025-2030

Chart on APAC - Market size and forecast 2025-2030 ($ million)
Data Table on APAC - Market size and forecast 2025-2030 ($ million)
Chart on APAC - Year-over-year growth 2025-2030 (%)
Data Table on APAC - Year-over-year growth 2025-2030 (%)
Chart on Regional Comparison - APAC
Data Table on Regional Comparison - APAC

12.4.1 China - Market size and forecast 2025-2030

Chart on China - Market size and forecast 2025-2030 ($ million)
Data Table on China - Market size and forecast 2025-2030 ($ million)
Chart on China - Year-over-year growth 2025-2030 (%)
Data Table on China - Year-over-year growth 2025-2030 (%)

12.4.2 Japan - Market size and forecast 2025-2030

Chart on Japan - Market size and forecast 2025-2030 ($ million)
Data Table on Japan - Market size and forecast 2025-2030 ($ million)
Chart on Japan - Year-over-year growth 2025-2030 (%)
Data Table on Japan - Year-over-year growth 2025-2030 (%)

12.4.3 India - Market size and forecast 2025-2030

Chart on India - Market size and forecast 2025-2030 ($ million)
Data Table on India - Market size and forecast 2025-2030 ($ million)
Chart on India - Year-over-year growth 2025-2030 (%)
Data Table on India - Year-over-year growth 2025-2030 (%)

12.4.4 South Korea - Market size and forecast 2025-2030

Chart on South Korea - Market size and forecast 2025-2030 ($ million)
Data Table on South Korea - Market size and forecast 2025-2030 ($ million)
Chart on South Korea - Year-over-year growth 2025-2030 (%)
Data Table on South Korea - Year-over-year growth 2025-2030 (%)

12.4.5 Australia - Market size and forecast 2025-2030

Chart on Australia - Market size and forecast 2025-2030 ($ million)
Data Table on Australia - Market size and forecast 2025-2030 ($ million)
Chart on Australia - Year-over-year growth 2025-2030 (%)
Data Table on Australia - Year-over-year growth 2025-2030 (%)

12.4.6 Indonesia - Market size and forecast 2025-2030

Chart on Indonesia - Market size and forecast 2025-2030 ($ million)
Data Table on Indonesia - Market size and forecast 2025-2030 ($ million)
Chart on Indonesia - Year-over-year growth 2025-2030 (%)
Data Table on Indonesia - Year-over-year growth 2025-2030 (%)

12.5 Europe - Market size and forecast 2025-2030

Chart on Europe - Market size and forecast 2025-2030 ($ million)
Data Table on Europe - Market size and forecast 2025-2030 ($ million)
Chart on Europe - Year-over-year growth 2025-2030 (%)
Data Table on Europe - Year-over-year growth 2025-2030 (%)
Chart on Regional Comparison - Europe
Data Table on Regional Comparison - Europe

12.5.1 Germany - Market size and forecast 2025-2030

Chart on Germany - Market size and forecast 2025-2030 ($ million)
Data Table on Germany - Market size and forecast 2025-2030 ($ million)
Chart on Germany - Year-over-year growth 2025-2030 (%)
Data Table on Germany - Year-over-year growth 2025-2030 (%)

12.5.2 UK - Market size and forecast 2025-2030

Chart on UK - Market size and forecast 2025-2030 ($ million)
Data Table on UK - Market size and forecast 2025-2030 ($ million)
Chart on UK - Year-over-year growth 2025-2030 (%)
Data Table on UK - Year-over-year growth 2025-2030 (%)

12.5.3 France - Market size and forecast 2025-2030

Chart on France - Market size and forecast 2025-2030 ($ million)
Data Table on France - Market size and forecast 2025-2030 ($ million)
Chart on France - Year-over-year growth 2025-2030 (%)
Data Table on France - Year-over-year growth 2025-2030 (%)

12.5.4 Italy - Market size and forecast 2025-2030

Chart on Italy - Market size and forecast 2025-2030 ($ million)
Data Table on Italy - Market size and forecast 2025-2030 ($ million)
Chart on Italy - Year-over-year growth 2025-2030 (%)
Data Table on Italy - Year-over-year growth 2025-2030 (%)

12.5.5 Spain - Market size and forecast 2025-2030

Chart on Spain - Market size and forecast 2025-2030 ($ million)
Data Table on Spain - Market size and forecast 2025-2030 ($ million)
Chart on Spain - Year-over-year growth 2025-2030 (%)
Data Table on Spain - Year-over-year growth 2025-2030 (%)

12.5.6 The Netherlands - Market size and forecast 2025-2030

Chart on The Netherlands - Market size and forecast 2025-2030 ($ million)
Data Table on The Netherlands - Market size and forecast 2025-2030 ($ million)
Chart on The Netherlands - Year-over-year growth 2025-2030 (%)
Data Table on The Netherlands - Year-over-year growth 2025-2030 (%)

12.6 South America - Market size and forecast 2025-2030

Chart on South America - Market size and forecast 2025-2030 ($ million)
Data Table on South America - Market size and forecast 2025-2030 ($ million)
Chart on South America - Year-over-year growth 2025-2030 (%)
Data Table on South America - Year-over-year growth 2025-2030 (%)
Chart on Regional Comparison - South America
Data Table on Regional Comparison - South America

12.6.1 Brazil - Market size and forecast 2025-2030

Chart on Brazil - Market size and forecast 2025-2030 ($ million)
Data Table on Brazil - Market size and forecast 2025-2030 ($ million)
Chart on Brazil - Year-over-year growth 2025-2030 (%)
Data Table on Brazil - Year-over-year growth 2025-2030 (%)

12.6.2 Argentina - Market size and forecast 2025-2030

Chart on Argentina - Market size and forecast 2025-2030 ($ million)
Data Table on Argentina - Market size and forecast 2025-2030 ($ million)
Chart on Argentina - Year-over-year growth 2025-2030 (%)
Data Table on Argentina - Year-over-year growth 2025-2030 (%)

12.6.3 Chile - Market size and forecast 2025-2030

Chart on Chile - Market size and forecast 2025-2030 ($ million)
Data Table on Chile - Market size and forecast 2025-2030 ($ million)
Chart on Chile - Year-over-year growth 2025-2030 (%)
Data Table on Chile - Year-over-year growth 2025-2030 (%)

12.7 Middle East and Africa - Market size and forecast 2025-2030

Chart on Middle East and Africa - Market size and forecast 2025-2030 ($ million)
Data Table on Middle East and Africa - Market size and forecast 2025-2030 ($ million)
Chart on Middle East and Africa - Year-over-year growth 2025-2030 (%)
Data Table on Middle East and Africa - Year-over-year growth 2025-2030 (%)
Chart on Regional Comparison - Middle East and Africa
Data Table on Regional Comparison - Middle East and Africa

12.7.1 Saudi Arabia - Market size and forecast 2025-2030

Chart on Saudi Arabia - Market size and forecast 2025-2030 ($ million)
Data Table on Saudi Arabia - Market size and forecast 2025-2030 ($ million)
Chart on Saudi Arabia - Year-over-year growth 2025-2030 (%)
Data Table on Saudi Arabia - Year-over-year growth 2025-2030 (%)

12.7.2 UAE - Market size and forecast 2025-2030

Chart on UAE - Market size and forecast 2025-2030 ($ million)
Data Table on UAE - Market size and forecast 2025-2030 ($ million)
Chart on UAE - Year-over-year growth 2025-2030 (%)
Data Table on UAE - Year-over-year growth 2025-2030 (%)

12.7.3 South Africa - Market size and forecast 2025-2030

Chart on South Africa - Market size and forecast 2025-2030 ($ million)
Data Table on South Africa - Market size and forecast 2025-2030 ($ million)
Chart on South Africa - Year-over-year growth 2025-2030 (%)
Data Table on South Africa - Year-over-year growth 2025-2030 (%)

12.7.4 Israel - Market size and forecast 2025-2030

Chart on Israel - Market size and forecast 2025-2030 ($ million)
Data Table on Israel - Market size and forecast 2025-2030 ($ million)
Chart on Israel - Year-over-year growth 2025-2030 (%)
Data Table on Israel - Year-over-year growth 2025-2030 (%)

12.7.5 Turkey - Market size and forecast 2025-2030

Chart on Turkey - Market size and forecast 2025-2030 ($ million)
Data Table on Turkey - Market size and forecast 2025-2030 ($ million)
Chart on Turkey - Year-over-year growth 2025-2030 (%)
Data Table on Turkey - Year-over-year growth 2025-2030 (%)

12.8 Market opportunity by geography

Market opportunity by geography ($ million)
Data Tables on Market opportunity by geography ($ million)

13. Drivers, Challenges, and Opportunity

13.1 Market drivers

Rapid growth in commercial real estate and industrialization
Increasing enforcement of stringent building codes
Innovations and integration of smart equipment capabilities

13.2 Market challenges

Volatility in raw material costs and supply chain disruption
Tightening environmental regulations and global based agents
Counterfeit products, substandard imports, and inconsistent regulatory enforcement

13.3 Impact of drivers and challenges

Impact of drivers and challenges in 2025 and 2030

13.4 Market opportunities

Rapid shift toward eco-friendly fluorine-free and non-toxic extinguishing agents
Integration of IoT telemetry and smart operational monitoring systems
Emergence of specialized extinguishers for lithium-ion battery

14. Competitive Landscape

14.1 Overview

14.2

Overview on criticality of inputs and factors of differentiation

14.3 Landscape disruption

Overview on factors of disruption

14.4 Industry risks

Impact of key risks on business

15. Competitive Analysis

15.1 Companies profiled

Companies covered

15.2 Company ranking index

15.3 Market positioning of companies

Matrix on companies position and classification

15.4 Amerex Corp.

Amerex Corp. - Overview
Amerex Corp. - Product / Service
Amerex Corp. - Key offerings
SWOT

15.5 Badger Fire Protection

Badger Fire Protection - Overview
Badger Fire Protection - Product / Service
Badger Fire Protection - Key offerings
SWOT

15.6 Bavaria Fire Fighting Solutions

Bavaria Fire Fighting Solutions - Overview
Bavaria Fire Fighting Solutions - Product / Service
Bavaria Fire Fighting Solutions - Key offerings
SWOT

15.7 Britannia Fire Ltd.

Britannia Fire Ltd. - Overview
Britannia Fire Ltd. - Product / Service
Britannia Fire Ltd. - Key offerings
SWOT

15.8 Ceasefire Industries Pvt. Ltd.

Ceasefire Industries Pvt. Ltd. - Overview
Ceasefire Industries Pvt. Ltd. - Product / Service
Ceasefire Industries Pvt. Ltd. - Key offerings
SWOT

15.9 Eversafe Extinguisher Sdn Bhd

Eversafe Extinguisher Sdn Bhd - Overview
Eversafe Extinguisher Sdn Bhd - Product / Service
Eversafe Extinguisher Sdn Bhd - Key offerings
SWOT

15.10 First Alert Inc.

First Alert Inc. - Overview
First Alert Inc. - Product / Service
First Alert Inc. - Key offerings
SWOT

15.11 Kidde Global Solutions

Kidde Global Solutions - Overview
Kidde Global Solutions - Product / Service
Kidde Global Solutions - Key offerings
SWOT

15.12 MOBIAK S.A

MOBIAK S.A - Overview
MOBIAK S.A - Product / Service
MOBIAK S.A - Key offerings
SWOT

15.13 NAFFCO

NAFFCO - Overview
NAFFCO - Product / Service
NAFFCO - Key offerings
SWOT

15.14 Ogniochron S.A.

Ogniochron S.A. - Overview
Ogniochron S.A. - Product / Service
Ogniochron S.A. - Key offerings
SWOT

15.15 SFFECO Global

SFFECO Global - Overview
SFFECO Global - Product / Service
SFFECO Global - Key offerings
SWOT

15.16 Steel Recon Industries Sdn Bhd

Steel Recon Industries Sdn Bhd - Overview
Steel Recon Industries Sdn Bhd - Product / Service
Steel Recon Industries Sdn Bhd - Key offerings
SWOT

15.17 Strike First Corp.

Strike First Corp. - Overview
Strike First Corp. - Product / Service
Strike First Corp. - Key offerings
SWOT

15.18 Yamato Protec Corp.

Yamato Protec Corp. - Overview
Yamato Protec Corp. - Product / Service
Yamato Protec Corp. - Key offerings
SWOT

16. Appendix

16.1 Scope of the report

Market definition
Objectives
Notes and caveats

16.2 Inclusions and exclusions checklist

Inclusions checklist
Exclusions checklist

16.3 Currency conversion rates for US$

16.4 Research methodology

16.5 Data procurement

Information sources

16.6 Data validation

16.7 Validation techniques employed for market sizing

16.8 Data synthesis

16.9 360 degree market analysis

16.10 List of abbreviations

Research Methodology

Technavio presents a detailed picture of the market by way of study, synthesis, and summation of data from multiple sources. The analysts have presented the various facets of the market with a particular focus on identifying the key industry influencers. The data thus presented is comprehensive, reliable, and the result of extensive research, both primary and secondary.

INFORMATION SOURCES

Primary sources

  • Manufacturers and suppliers
  • Channel partners
  • Industry experts
  • Strategic decision makers

Secondary sources

  • Industry journals and periodicals
  • Government data
  • Financial reports of key industry players
  • Historical data
  • Press releases

DATA ANALYSIS

Data Synthesis

  • Collation of data
  • Estimation of key figures
  • Analysis of derived insights

Data Validation

  • Triangulation with data models
  • Reference against proprietary databases
  • Corroboration with industry experts

REPORT WRITING

Qualitative

  • Market drivers
  • Market challenges
  • Market trends
  • Five forces analysis

Quantitative

  • Market size and forecast
  • Market segmentation
  • Geographical insights
  • Competitive landscape

Interested in this report?

Get your sample now to see our research methodology and insights!

Download Now

Frequently Asked Questions

Portable Fire Extinguisher market growth will increase by USD 2249.4 million during 2026-2030.

The Portable Fire Extinguisher market is expected to grow at a CAGR of 7.6% during 2026-2030.

Portable Fire Extinguisher market is segmented by Distribution channel (Offline, Online) End-user (Residential, Commercial, Industrial) Product type (Dry powder, Carbon dioxide, Foam, Water, Others)

Amerex Corp., Badger Fire Protection, Bavaria Fire Fighting Solutions, Britannia Fire Ltd., Ceasefire Industries Pvt. Ltd., Eversafe Extinguisher Sdn Bhd, Feuerschutz Jockel GmbH, First Alert Inc., GLORIA GmbH, Hatsuta Seisakusho Co Ltd., Kanadia Fyr Fyter Pvt. Ltd., Kidde Global Solutions, MOBIAK S.A, NAFFCO, Ogniochron S.A., SFFECO Global, Steel Recon Industries Sdn Bhd, Strike First Corp., Yamato Protec Corp. are a few of the key vendors in the Portable Fire Extinguisher market.

North America will register the highest growth rate of 32.5% among the other regions. Therefore, the Portable Fire Extinguisher market in North America is expected to garner significant business opportunities for the vendors during the forecast period.

US, Canada, Mexico, China, Japan, India, South Korea, Australia, Indonesia, Germany, UK, France, Italy, Spain, The Netherlands, Brazil, Argentina, Chile, Saudi Arabia, UAE, South Africa, Israel, Turkey

  • Rapid growth in commercial real estate and industrialization is the driving factor this market.

The Portable Fire Extinguisher market vendors should focus on grabbing business opportunities from the Distribution channel segment as it accounted for the largest market share in the base year.
RIA - Research AI Assistant
Ask RIA
