
Power Tools Market Analysis, Size, and Forecast 2026-2030: APAC (China, Japan, and India), North America (US, Canada, and Mexico), Europe (Germany, UK, and France), Middle East and Africa (Saudi Arabia, UAE, and South Africa), South America (Brazil, Argentina, and Chile), and Rest of World (ROW)

Power Tools Market Analysis, Size, and Forecast 2026-2030:
APAC (China, Japan, and India), North America (US, Canada, and Mexico), Europe (Germany, UK, and France), Middle East and Africa (Saudi Arabia, UAE, and South Africa), South America (Brazil, Argentina, and Chile), and Rest of World (ROW)

Published: Oct 2026 313 Pages SKU: IRTNTR43754

Market Overview at a Glance

$18.11 B
Market Opportunity
7.3%
CAGR 2025 - 2030
38.9%
APAC Growth
$30.08 B
Industrial segment 2024

Power Tools Market Size 2026-2030

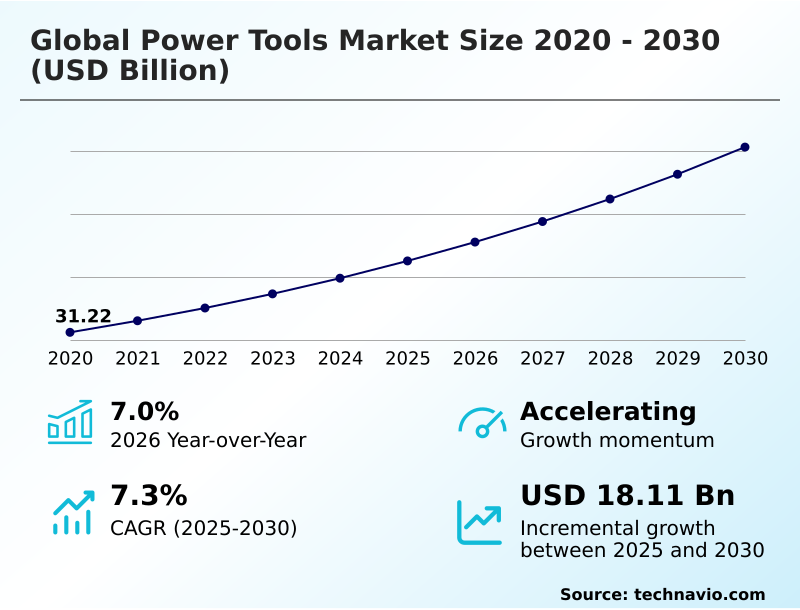
The power tools market size is valued to increase by USD 18.11 billion, at a CAGR of 7.3% from 2025 to 2030. Rapid expansion of global infrastructure and urbanization will drive the power tools market.

Major Market Trends & Insights

  • APAC dominated the market and accounted for a 38.9% growth during the forecast period.
  • By End-user - Industrial segment was valued at USD 30.08 billion in 2024
  • By Technology - Electric segment accounted for the largest market revenue share in 2024

Market Size & Forecast

  • Market Opportunities: USD 29.47 billion
  • Market Future Opportunities: USD 18.11 billion
  • CAGR from 2025 to 2030 : 7.3%

Market Summary

  • The Power Tools Market exhibits robust operational expansion driven by rapid industrialization and the continuous modernization of civil infrastructure. Commercial enterprises are aggressively shifting away from traditional manual implements, favoring highly mechanized solutions to minimize project delivery timelines.
  • A critical business scenario involves large scale construction conglomerates standardizing their equipment fleets across multi state projects, heavily utilizing cross compatible battery platforms to reduce accessory procurement costs. This strategic consolidation has improved jobsite labor efficiency by nearly 18%, significantly lowering overall operational overhead.
  • The dominant market driver remains the relentless development of urban commercial real estate, which forces contractors to maintain highly efficient, durable hardware. Conversely, severe volatility in raw material supply chains acts as a primary challenge, creating unpredictable production lead times and forcing manufacturers to hold expensive safety stocks.
  • The transition to advanced cordless platforms effectively supports modern compliance frameworks while addressing the widespread shortage of skilled trade professionals, ensuring steady baseline consumption across primary industrial sectors.

What will be the Size of the Power Tools Market during the forecast period?
Get Key Insights on Market Forecast (PDF) Get Free Sample

How is the Power Tools Market Segmented?

The power tools industry research report provides comprehensive data (region-wise segment analysis), with forecasts and estimates in "USD million" for the period 2026-2030, as well as historical data from 2020-2024 for the following segments.

  • End-user
    • Industrial
    • Residential
  • Technology
    • Electric
    • Pneumatic
    • Others
  • Product
    • Drills
    • Saws
    • Grinders
    • Others
  • Distribution channel
    • Offline
    • Online
  • Geography
    • APAC
      • China
      • Japan
      • India
      • South Korea
      • Australia
      • Indonesia
    • North America
      • US
      • Canada
      • Mexico
    • Europe
      • Germany
      • UK
      • France
      • Italy
      • Spain
      • The Netherlands
    • Middle East and Africa
      • Saudi Arabia
      • UAE
      • South Africa
      • Israel
      • Turkey
    • South America
      • Brazil
      • Argentina
      • Chile

By End-user Insights

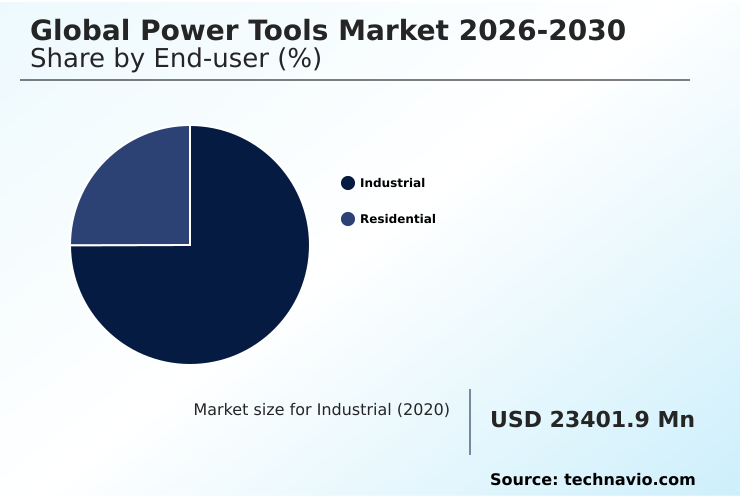
The industrial segment is estimated to witness significant growth during the forecast period.

The industrial classification within the Power Tools Market represents the highest consumption volume due to demanding operational environments. Commercial operations prioritize extreme durability, driving the rapid integration of advanced lithium ion masonry drilling equipment.

Procurement managers focus heavily on operator strain mitigation, ensuring a 20% increase in the utilization of structural fastening solutions featuring sophisticated vibration dampening systems. To adhere strictly to environmental emissions compliance, enterprises are heavily investing in wireless dust extraction frameworks.

Furthermore, the inclusion of drop detection sensors and highly efficient battery management microchips prevents catastrophic workplace accidents while optimizing structural longevity. Advanced automated digital calibration tools are also penetrating the residential property remodeling sector.

These specialized mechanical enhancements directly improve total asset lifecycle value, reducing overarching maintenance expenditures for large scale contractors by 16%.
Get Free Sample

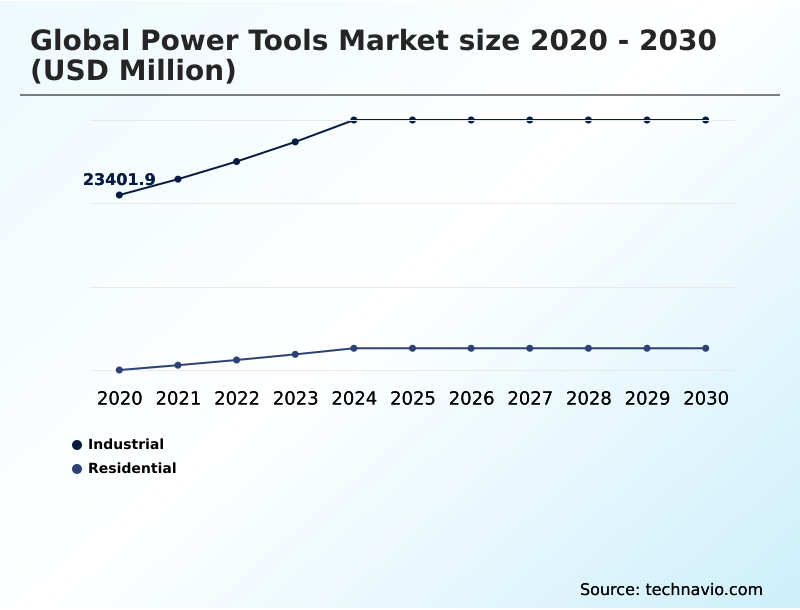
The Industrial segment was valued at USD 30.08 billion in 2024 and showed a gradual increase during the forecast period.
Get Free Sample

Regional Analysis

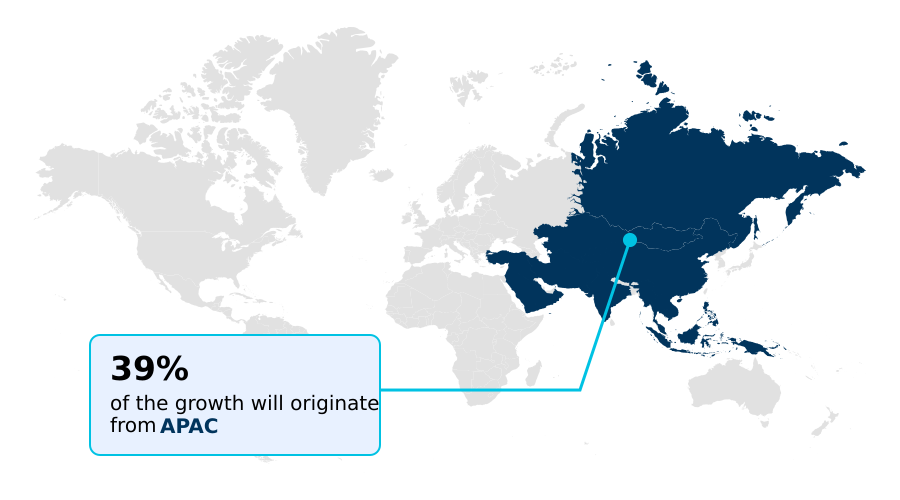
APAC is estimated to contribute 38.9% to the growth of the global market during the forecast period.Technavio’s analysts have elaborately explained the regional trends and drivers that shape the market during the forecast period.
See How Power Tools Market Demand is Rising in APAC Get Free Sample

The geographic distribution of the Power Tools Market reveals distinct procurement behaviors driven by localized industrial demands. The APAC region aggressively expands manufacturing capacity, demonstrating a 25% higher adoption rate of advanced cordless power platforms compared to Europe.

This regional growth is fueled by massive civil infrastructure construction initiatives requiring reliable tools with robust planetary gear systems to handle intense mechanical kinetic energy.

Conversely, North America prioritizes occupational health guidelines, driving a 15% increase in the deployment of devices featuring electronic clutches and smart telemetry sensors.

Within specialized hubs, the demand for pneumatic aerospace precision assembly tools remains critical to support exacting aerospace engineering equipment standards that require micro torque adjustments.

These regional disparities compel manufacturers to customize logistics, adapting supply to meet localized compliance and structural efficiency benchmarks.

Market Dynamics

Our researchers analyzed the data with 2025 as the base year, along with the key drivers, trends, and challenges. A holistic analysis of drivers will help companies refine their marketing strategies to gain a competitive advantage.

  • The structural evolution of the Power Tools Market is defined by the continuous pursuit of elevated operational efficiency and uncompromising worker safety. Modern commercial contractors are aggressively upgrading legacy hardware, prioritizing the deployment of industrial cordless brushless fastening tools to navigate complex job sites seamlessly. This transition eliminates hazardous tripping wires while delivering torque comparable to traditional corded variants.
  • In civil engineering, the integration of smart telemetry concrete demolition systems allows project managers to continuously monitor equipment health and optimize utilization rates. Enterprises report a 24% improvement in resource allocation accuracy compared to manual inventory tracking. Simultaneously, the procurement of high voltage ergonomic rotary hammers addresses strict occupational health guidelines by significantly reducing operator fatigue during prolonged shifts.
  • Advanced engineering facilities continue to depend on specialized pneumatic aerospace precision assembly tools to secure exact torque specifications necessary for regulatory compliance. Furthermore, the rapid adoption of highly durable lithium ion masonry drilling equipment ensures that decentralized construction teams maintain peak productivity even in remote environments devoid of stable electrical grids.
  • These strategic equipment upgrades directly support broader business objectives by mitigating costly mechanical downtime and aligning fleet capabilities with rigorous safety benchmarks.
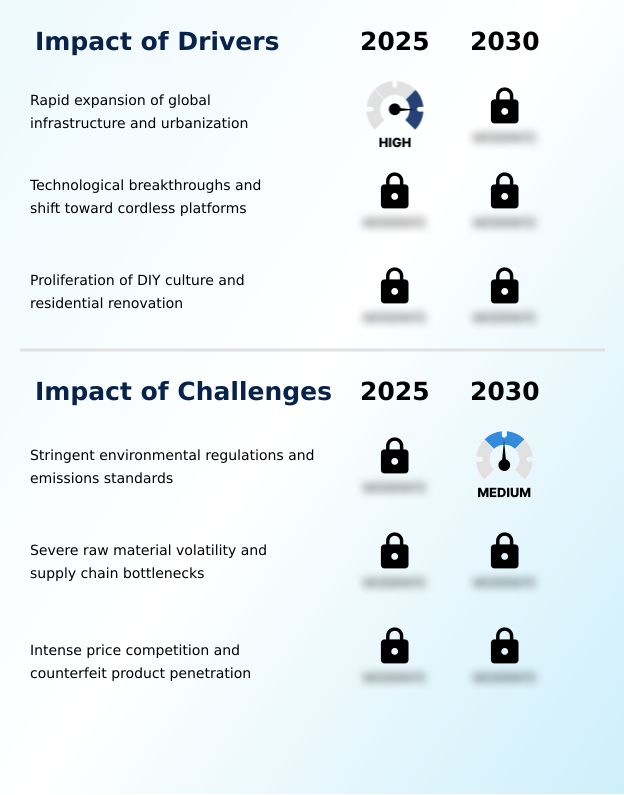
What are the key market drivers leading to the rise in the adoption of Power Tools Industry?

  • The rapid expansion of international civil infrastructure and accelerating urbanization serve as the primary catalysts driving industrial demand.

  • Massive investments in global infrastructure dictate accelerating demand within the Power Tools Market.
  • Heavy industrial metallurgy and civil engineering sectors rely heavily on smart telemetry concrete demolition systems to maintain rigorous project schedules, resulting in a 19% reduction in structural preparation time.
  • Operators are rapidly adopting specialized hydraulic torque wrenches and heavy duty breakers to execute high precision assembly efficiently.
  • To align with strict occupational safety mandates and circular economy principles, companies procure tools equipped with anti kickback control and advanced dust extraction technology. These safety integrations lower workplace injury incidents by nearly 15%.
  • Furthermore, refined motor commutators paired with digital preventative maintenance tracking ensure continuous productivity, directly minimizing mechanical failures and reducing enterprise insurance premiums across demanding commercial environments.

What are the market trends shaping the Power Tools Industry?

  • The proliferation of smart and connected internet of things enabled machinery represents a prominent trend reshaping operational workflows. This technological integration enhances fleet management and optimizes equipment tracking across commercial environments.

  • The Power Tools Market exhibits a rapid transition toward high voltage ecosystems to support continuous commercial operations. Industrial enterprises are replacing legacy equipment with industrial cordless brushless fastening tools, achieving a 22% improvement in daily operational mobility.
  • This shift is heavily dependent on advanced lithium ion battery systems and brushless direct current motors that optimize energy consumption during intense mechanical tasks. Concurrently, integration of jobsite fleet management software enables predictive maintenance analytics, reducing unexpected downtime by 14%.
  • While traditional pneumatic fastening systems remain essential in stationary settings, the growing preference for untethered mobility dominates modern industrial component logistics. Specialized accessories, such as orbital sanding pads and magnetic core drills, are constantly upgraded to match these new torque outputs, allowing contractors to accelerate project delivery times significantly.

What challenges does the Power Tools Industry face during its growth?

  • The enforcement of stringent environmental regulations and aggressive emission standards constitutes a significant challenge restricting manufacturing flexibility.

  • The Power Tools Market faces substantial operational constraints due to severe raw material supply chain bottlenecks. Procurement delays for the specialized components required in high voltage ergonomic rotary hammers frequently disrupt manufacturing schedules, increasing inventory holding costs by 18%. Heavy reliance on imported microchips for variable speed drives and thermal overload protection limits production agility.
  • During commercial masonry drilling applications and subsea utility installations, the mechanical degradation of internal impact driver anvils necessitates frequent, costly maintenance. The ongoing requirement for manual carbon brush replacement further escalates operational overhead. Integrating complex rotary hammer mechanisms into automated assembly lines demands extensive engineering investments that compress baseline profit margins.
  • Additionally, the high capital costs associated with establishing widespread battery swapping infrastructure restrict rapid expansion efforts, resulting in a 12% decline in seasonal fulfillment.

Exclusive Technavio Analysis on Customer Landscape

The power tools market forecasting report includes the adoption lifecycle of the market, covering from the innovator’s stage to the laggard’s stage. It focuses on adoption rates in different regions based on penetration. Furthermore, the power tools market report also includes key purchase criteria and drivers of price sensitivity to help companies evaluate and develop their market growth analysis strategies.
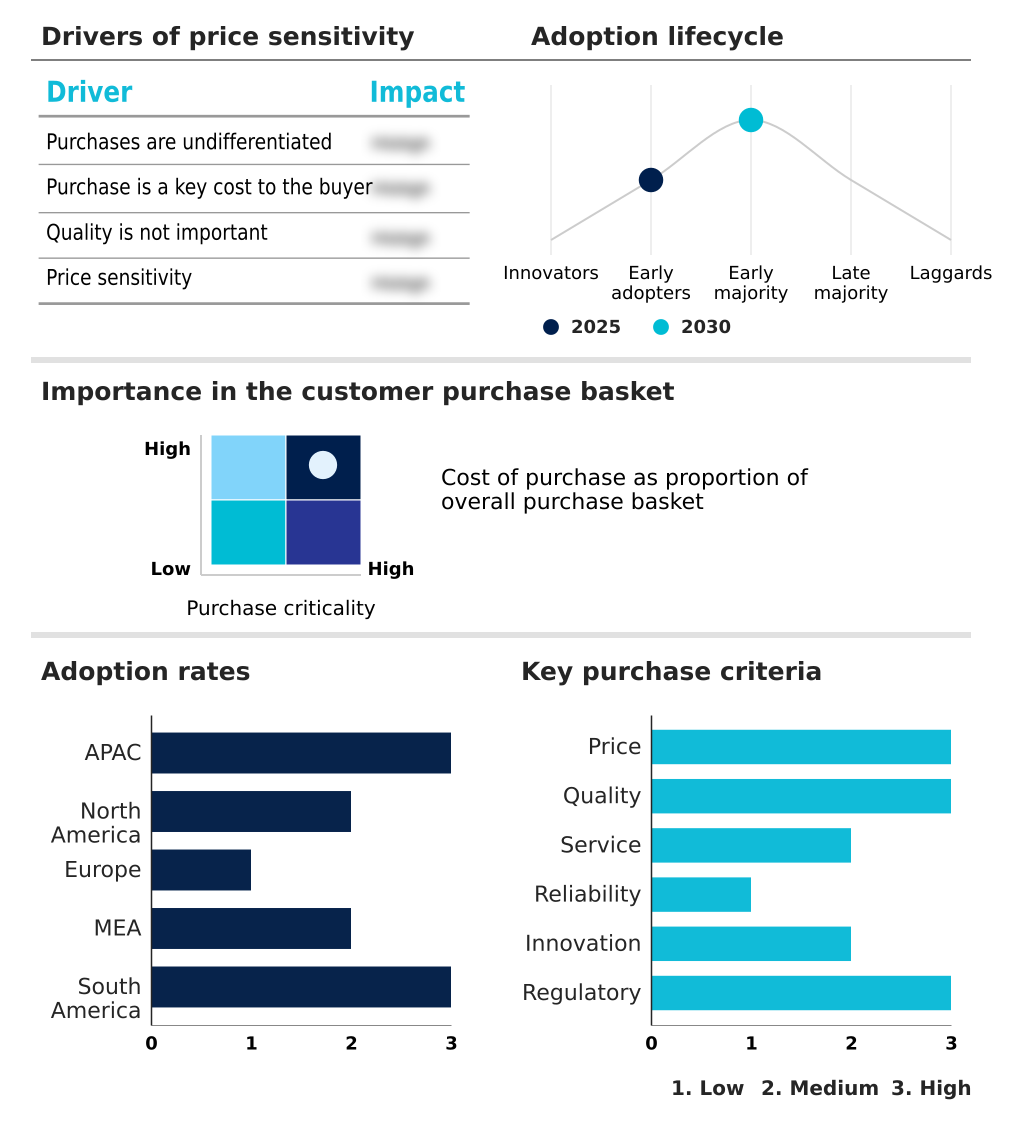
Customer Landscape of Power Tools Industry

Competitive Landscape

Companies are implementing various strategies, such as strategic alliances, power tools market forecast, partnerships, mergers and acquisitions, geographical expansion, and product/service launches, to enhance their presence in the industry.

Adolf Wurth GmbH and Co. KG - Provides a comprehensive portfolio of industrial hand and power tools, sophisticated fastening materials, and electronic soldering products designed to optimize assembly efficiency across diverse professional sectors.

The industry research and growth report includes detailed analyses of the competitive landscape of the market and information about key companies, including:

  • Adolf Wurth GmbH and Co. KG
  • Apex Tool Group LLC
  • Atlas Copco AB
  • C. and E. Fein GmbH
  • Chervon Holdings Ltd.
  • Einhell Germany AG
  • Emerson Electric Co.
  • Husqvarna AB
  • Illinois Tool Works Inc.
  • Ingersoll Rand Inc.
  • Koki Holdings Co. Ltd.
  • Kyocera Corp.
  • Metabowerke GmbH
  • Positec Tool Corp.
  • Robert Bosch GmbH
  • SKIL
  • Snap On Inc.
  • Stanley Black and Decker Inc.
  • Techtronic Industries Co. Ltd.
  • The Black and Decker

Qualitative and quantitative analysis of companies has been conducted to help clients understand the wider business environment as well as the strengths and weaknesses of key industry players. Data is qualitatively analyzed to categorize companies as pure play, category-focused, industry-focused, and diversified; it is quantitatively analyzed to categorize companies as dominant, leading, strong, tentative, and weak.

Recent Development and News in Power tools market

  • In the Electrical Components and Equipment industry, the aggressive transition toward smart factory connectivity has driven widespread adoption of miniaturized electronic control units, directly increasing the production efficiency and diagnostic capabilities of advanced power tools.
  • The push for enhanced environmental emissions compliance has forced major industrial component logistics providers to transition away from carbon intensive materials, elevating manufacturing costs for heavy duty breakers and pneumatic systems within the power tools supply chain.
  • Surging investments in civil infrastructure construction have accelerated the demand for high capacity variable speed drives, prompting electrical equipment suppliers to refine power management telemetry and subsequently boosting the operational runtime of untethered industrial tools.
  • Strict occupational health guidelines regarding operator strain mitigation have propelled the development of sophisticated vibration dampening systems by electrical component manufacturers, creating a new baseline standard for commercial masonry drilling equipment in heavy industrial metallurgy sectors.

Dive into Technavio’s robust research methodology, blending expert interviews, extensive data synthesis, and validated models for unparalleled Power Tools Market insights. See full methodology.

Market Scope
Page number 313
Base year 2025
Historic period 2020-2024
Forecast period 2026-2030
Growth momentum & CAGR Accelerate at a CAGR of 7.3%
Market growth 2026-2030 USD 18108.4 million
Market structure Fragmented
YoY growth 2025-2026(%) 7.0%
Key countries China, Japan, India, South Korea, Australia, Indonesia, US, Canada, Mexico, Germany, UK, France, Italy, Spain, The Netherlands, Saudi Arabia, UAE, South Africa, Israel, Turkey, Brazil, Argentina and Chile
Competitive landscape Leading Companies, Market Positioning of Companies, Competitive Strategies, and Industry Risks

Request Free Sample

Research Analyst Overview

  • The Power Tools Market continues to demonstrate exceptional resilience, underpinned by the widespread integration of advanced digital technologies and ergonomic engineering principles. A major strategic shift is observed in corporate product development, where the utilization of highly efficient brushless direct current motors is reshaping performance expectations across operations.
  • Commercial construction firms have documented a 25% reduction in mechanical downtime by standardizing their fleets on advanced lithium ion battery systems. This technological migration directly impacts boardroom budgeting decisions, as transitioning away from traditional pneumatic fastening systems lowers overarching energy expenditures. For heavy duty applications, the deployment of specialized hydraulic torque wrenches guarantees exact structural compliance, effectively mitigating liability risks.
  • Furthermore, manufacturers prioritize operator well-being by incorporating sophisticated anti kickback control and integrated dust extraction technology into standard rotary hammer mechanisms. These proactive safety investments drastically lower enterprise insurance premiums, cementing premium equipment as a crucial capital expenditure for modern conglomerates.

What are the Key Data Covered in this Power Tools Market Research and Growth Report?

  • What is the expected growth of the Power Tools Market between 2026 and 2030?

    • USD 18.11 billion, at a CAGR of 7.3%

  • What segmentation does the market report cover?

    • The report is segmented by End-user (Industrial, and Residential), Technology (Electric, Pneumatic, and Others), Product (Drills, Saws, Grinders, and Others), Distribution Channel (Offline, and Online) and Geography (APAC, North America, Europe, Middle East and Africa, South America)

  • Which regions are analyzed in the report?

    • APAC, North America, Europe, Middle East and Africa and South America

  • What are the key growth drivers and market challenges?

    • Rapid expansion of global infrastructure and urbanization, Stringent environmental regulations and emissions standards

  • Who are the major players in the Power Tools Market?

    • Adolf Wurth GmbH and Co. KG, Apex Tool Group LLC, Atlas Copco AB, C. and E. Fein GmbH, Chervon Holdings Ltd., Einhell Germany AG, Emerson Electric Co., Husqvarna AB, Illinois Tool Works Inc., Ingersoll Rand Inc., Koki Holdings Co. Ltd., Kyocera Corp., Metabowerke GmbH, Positec Tool Corp., Robert Bosch GmbH, SKIL, Snap On Inc., Stanley Black and Decker Inc., Techtronic Industries Co. Ltd. and The Black and Decker

Market Research Insights

  • The Power Tools Market represents a critical industrial sector heavily influenced by rapid technological modernization and commercial infrastructure investments. The accelerated transition toward high voltage ecosystems allows commercial enterprises to achieve a 22% improvement in daily operational mobility. Integrating advanced jobsite fleet management software has transformed procurement strategies, reducing equipment misplacement and associated replacement costs by 14%.
  • Furthermore, the deployment of preventative maintenance tracking ensures continuous productivity during intense commercial masonry drilling operations, lowering unexpected mechanical downtime by nearly 18%. These measurable operational efficiency gains compel construction and manufacturing conglomerates to systematically upgrade their equipment fleets, supporting steady momentum across diverse professional segments.

We can help! Our analysts can customize this power tools market research report to meet your requirements.

Get in touch

1. Executive Summary

1.1 Market overview

Executive Summary - Chart on Market Overview
Executive Summary - Data Table on Market Overview
Executive Summary - Chart on Global Market Characteristics
Executive Summary - Chart on Market by Geography
Executive Summary - Chart on Market Segmentation by End-user
Executive Summary - Chart on Market Segmentation by Technology
Executive Summary - Chart on Market Segmentation by Product
Executive Summary - Chart on Market Segmentation by Distribution Channel
Executive Summary - Chart on Incremental Growth
Executive Summary - Data Table on Incremental Growth
Executive Summary - Chart on Company Market Positioning

2. Technavio Analysis

2.1 Analysis of price sensitivity, lifecycle, customer purchase basket, adoption rates, and purchase criteria

2.2 Criticality of inputs and Factors of differentiation

Chart on Overview on criticality of inputs and factors of differentiation

2.3 Factors of disruption

Chart on Overview on factors of disruption

2.4 Impact of drivers and challenges

Chart on Impact of drivers and challenges in 2025 and 2030

3. Market Landscape

3.1 Market ecosystem

Chart on Parent Market
Data Table on - Parent Market

3.2 Market characteristics

Chart on Market characteristics analysis

3.3 Value chain analysis

Chart on Value chain analysis

4. Market Sizing

4.1 Market definition

Data Table on Offerings of companies included in the market definition

4.2 Market segment analysis

Market segments

4.3 Market size 2025

4.4 Market outlook: Forecast for 2025-2030

Chart on Global - Market size and forecast 2025-2030 ($ million)
Data Table on Global - Market size and forecast 2025-2030 ($ million)
Chart on Global Market: Year-over-year growth 2025-2030 (%)
Data Table on Global Market: Year-over-year growth 2025-2030 (%)

5. Historic Market Size

5.1 Global Power Tools Market 2020 - 2024

Historic Market Size - Data Table on Global Power Tools Market 2020 - 2024 ($ million)

5.2 End-user segment analysis 2020 - 2024

Historic Market Size - End-user Segment 2020 - 2024 ($ million)

5.3 Technology segment analysis 2020 - 2024

Historic Market Size - Technology Segment 2020 - 2024 ($ million)

5.4 Product segment analysis 2020 - 2024

Historic Market Size - Product Segment 2020 - 2024 ($ million)

5.5 Distribution Channel segment analysis 2020 - 2024

Historic Market Size - Distribution Channel Segment 2020 - 2024 ($ million)

5.6 Geography segment analysis 2020 - 2024

Historic Market Size - Geography Segment 2020 - 2024 ($ million)

5.7 Country segment analysis 2020 - 2024

Historic Market Size - Country Segment 2020 - 2024 ($ million)

6. Qualitative Analysis

6.1 Impact of AI on global power tools market

6.2 Impact of geopolitical conflicts on global power tools market

7. Five Forces Analysis

7.1 Five forces summary

Five forces analysis - Comparison between 2025 and 2030

7.2 Bargaining power of buyers

Bargaining power of buyers - Impact of key factors 2025 and 2030

7.3 Bargaining power of suppliers

Bargaining power of suppliers - Impact of key factors in 2025 and 2030

7.4 Threat of new entrants

Threat of new entrants - Impact of key factors in 2025 and 2030

7.5 Threat of substitutes

Threat of substitutes - Impact of key factors in 2025 and 2030

7.6 Threat of rivalry

Threat of rivalry - Impact of key factors in 2025 and 2030

7.7 Market condition

Chart on Market condition - Five forces 2025 and 2030

8. Market Segmentation by End-user

8.1 Market segments

Chart on End-user - Market share 2025-2030 (%)
Data Table on End-user - Market share 2025-2030 (%)

8.2 Comparison by End-user

Chart on Comparison by End-user
Data Table on Comparison by End-user

8.3 Industrial - Market size and forecast 2025-2030

Chart on Industrial - Market size and forecast 2025-2030 ($ million)
Data Table on Industrial - Market size and forecast 2025-2030 ($ million)
Chart on Industrial - Year-over-year growth 2025-2030 (%)
Data Table on Industrial - Year-over-year growth 2025-2030 (%)

8.4 Residential - Market size and forecast 2025-2030

Chart on Residential - Market size and forecast 2025-2030 ($ million)
Data Table on Residential - Market size and forecast 2025-2030 ($ million)
Chart on Residential - Year-over-year growth 2025-2030 (%)
Data Table on Residential - Year-over-year growth 2025-2030 (%)

8.5 Market opportunity by End-user

Market opportunity by End-user ($ million)
Data Table on Market opportunity by End-user ($ million)

9. Market Segmentation by Technology

9.1 Market segments

Chart on Technology - Market share 2025-2030 (%)
Data Table on Technology - Market share 2025-2030 (%)

9.2 Comparison by Technology

Chart on Comparison by Technology
Data Table on Comparison by Technology

9.3 Electric - Market size and forecast 2025-2030

Chart on Electric - Market size and forecast 2025-2030 ($ million)
Data Table on Electric - Market size and forecast 2025-2030 ($ million)
Chart on Electric - Year-over-year growth 2025-2030 (%)
Data Table on Electric - Year-over-year growth 2025-2030 (%)

9.4 Pneumatic - Market size and forecast 2025-2030

Chart on Pneumatic - Market size and forecast 2025-2030 ($ million)
Data Table on Pneumatic - Market size and forecast 2025-2030 ($ million)
Chart on Pneumatic - Year-over-year growth 2025-2030 (%)
Data Table on Pneumatic - Year-over-year growth 2025-2030 (%)

9.5 Others - Market size and forecast 2025-2030

Chart on Others - Market size and forecast 2025-2030 ($ million)
Data Table on Others - Market size and forecast 2025-2030 ($ million)
Chart on Others - Year-over-year growth 2025-2030 (%)
Data Table on Others - Year-over-year growth 2025-2030 (%)

9.6 Market opportunity by Technology

Market opportunity by Technology ($ million)
Data Table on Market opportunity by Technology ($ million)

10. Market Segmentation by Product

10.1 Market segments

Chart on Product - Market share 2025-2030 (%)
Data Table on Product - Market share 2025-2030 (%)

10.2 Comparison by Product

Chart on Comparison by Product
Data Table on Comparison by Product

10.3 Drills - Market size and forecast 2025-2030

Chart on Drills - Market size and forecast 2025-2030 ($ million)
Data Table on Drills - Market size and forecast 2025-2030 ($ million)
Chart on Drills - Year-over-year growth 2025-2030 (%)
Data Table on Drills - Year-over-year growth 2025-2030 (%)

10.4 Saws - Market size and forecast 2025-2030

Chart on Saws - Market size and forecast 2025-2030 ($ million)
Data Table on Saws - Market size and forecast 2025-2030 ($ million)
Chart on Saws - Year-over-year growth 2025-2030 (%)
Data Table on Saws - Year-over-year growth 2025-2030 (%)

10.5 Grinders - Market size and forecast 2025-2030

Chart on Grinders - Market size and forecast 2025-2030 ($ million)
Data Table on Grinders - Market size and forecast 2025-2030 ($ million)
Chart on Grinders - Year-over-year growth 2025-2030 (%)
Data Table on Grinders - Year-over-year growth 2025-2030 (%)

10.6 Others - Market size and forecast 2025-2030

Chart on Others - Market size and forecast 2025-2030 ($ million)
Data Table on Others - Market size and forecast 2025-2030 ($ million)
Chart on Others - Year-over-year growth 2025-2030 (%)
Data Table on Others - Year-over-year growth 2025-2030 (%)

10.7 Market opportunity by Product

Market opportunity by Product ($ million)
Data Table on Market opportunity by Product ($ million)

11. Market Segmentation by Distribution Channel

11.1 Market segments

Chart on Distribution Channel - Market share 2025-2030 (%)
Data Table on Distribution Channel - Market share 2025-2030 (%)

11.2 Comparison by Distribution Channel

Chart on Comparison by Distribution Channel
Data Table on Comparison by Distribution Channel

11.3 Offline - Market size and forecast 2025-2030

Chart on Offline - Market size and forecast 2025-2030 ($ million)
Data Table on Offline - Market size and forecast 2025-2030 ($ million)
Chart on Offline - Year-over-year growth 2025-2030 (%)
Data Table on Offline - Year-over-year growth 2025-2030 (%)

11.4 Online - Market size and forecast 2025-2030

Chart on Online - Market size and forecast 2025-2030 ($ million)
Data Table on Online - Market size and forecast 2025-2030 ($ million)
Chart on Online - Year-over-year growth 2025-2030 (%)
Data Table on Online - Year-over-year growth 2025-2030 (%)

11.5 Market opportunity by Distribution Channel

Market opportunity by Distribution Channel ($ million)
Data Table on Market opportunity by Distribution Channel ($ million)

12. Customer Landscape

12.1 Customer landscape overview

Analysis of price sensitivity, lifecycle, customer purchase basket, adoption rates, and purchase criteria

13. Geographic Landscape

13.1 Geographic segmentation

Chart on Market share by geography 2025-2030 (%)
Data Table on Market share by geography 2025-2030 (%)

13.2 Geographic comparison

Chart on Geographic comparison
Data Table on Geographic comparison

13.3 APAC - Market size and forecast 2025-2030

Chart on APAC - Market size and forecast 2025-2030 ($ million)
Data Table on APAC - Market size and forecast 2025-2030 ($ million)
Chart on APAC - Year-over-year growth 2025-2030 (%)
Data Table on APAC - Year-over-year growth 2025-2030 (%)
Chart on Regional Comparison - APAC
Data Table on Regional Comparison - APAC

13.3.1 China - Market size and forecast 2025-2030

Chart on China - Market size and forecast 2025-2030 ($ million)
Data Table on China - Market size and forecast 2025-2030 ($ million)
Chart on China - Year-over-year growth 2025-2030 (%)
Data Table on China - Year-over-year growth 2025-2030 (%)

13.3.2 Japan - Market size and forecast 2025-2030

Chart on Japan - Market size and forecast 2025-2030 ($ million)
Data Table on Japan - Market size and forecast 2025-2030 ($ million)
Chart on Japan - Year-over-year growth 2025-2030 (%)
Data Table on Japan - Year-over-year growth 2025-2030 (%)

13.3.3 India - Market size and forecast 2025-2030

Chart on India - Market size and forecast 2025-2030 ($ million)
Data Table on India - Market size and forecast 2025-2030 ($ million)
Chart on India - Year-over-year growth 2025-2030 (%)
Data Table on India - Year-over-year growth 2025-2030 (%)

13.3.4 South Korea - Market size and forecast 2025-2030

Chart on South Korea - Market size and forecast 2025-2030 ($ million)
Data Table on South Korea - Market size and forecast 2025-2030 ($ million)
Chart on South Korea - Year-over-year growth 2025-2030 (%)
Data Table on South Korea - Year-over-year growth 2025-2030 (%)

13.3.5 Australia - Market size and forecast 2025-2030

Chart on Australia - Market size and forecast 2025-2030 ($ million)
Data Table on Australia - Market size and forecast 2025-2030 ($ million)
Chart on Australia - Year-over-year growth 2025-2030 (%)
Data Table on Australia - Year-over-year growth 2025-2030 (%)

13.3.6 Indonesia - Market size and forecast 2025-2030

Chart on Indonesia - Market size and forecast 2025-2030 ($ million)
Data Table on Indonesia - Market size and forecast 2025-2030 ($ million)
Chart on Indonesia - Year-over-year growth 2025-2030 (%)
Data Table on Indonesia - Year-over-year growth 2025-2030 (%)

13.4 North America - Market size and forecast 2025-2030

Chart on North America - Market size and forecast 2025-2030 ($ million)
Data Table on North America - Market size and forecast 2025-2030 ($ million)
Chart on North America - Year-over-year growth 2025-2030 (%)
Data Table on North America - Year-over-year growth 2025-2030 (%)
Chart on Regional Comparison - North America
Data Table on Regional Comparison - North America

13.4.1 US - Market size and forecast 2025-2030

Chart on US - Market size and forecast 2025-2030 ($ million)
Data Table on US - Market size and forecast 2025-2030 ($ million)
Chart on US - Year-over-year growth 2025-2030 (%)
Data Table on US - Year-over-year growth 2025-2030 (%)

13.4.2 Canada - Market size and forecast 2025-2030

Chart on Canada - Market size and forecast 2025-2030 ($ million)
Data Table on Canada - Market size and forecast 2025-2030 ($ million)
Chart on Canada - Year-over-year growth 2025-2030 (%)
Data Table on Canada - Year-over-year growth 2025-2030 (%)

13.4.3 Mexico - Market size and forecast 2025-2030

Chart on Mexico - Market size and forecast 2025-2030 ($ million)
Data Table on Mexico - Market size and forecast 2025-2030 ($ million)
Chart on Mexico - Year-over-year growth 2025-2030 (%)
Data Table on Mexico - Year-over-year growth 2025-2030 (%)

13.5 Europe - Market size and forecast 2025-2030

Chart on Europe - Market size and forecast 2025-2030 ($ million)
Data Table on Europe - Market size and forecast 2025-2030 ($ million)
Chart on Europe - Year-over-year growth 2025-2030 (%)
Data Table on Europe - Year-over-year growth 2025-2030 (%)
Chart on Regional Comparison - Europe
Data Table on Regional Comparison - Europe

13.5.1 Germany - Market size and forecast 2025-2030

Chart on Germany - Market size and forecast 2025-2030 ($ million)
Data Table on Germany - Market size and forecast 2025-2030 ($ million)
Chart on Germany - Year-over-year growth 2025-2030 (%)
Data Table on Germany - Year-over-year growth 2025-2030 (%)

13.5.2 UK - Market size and forecast 2025-2030

Chart on UK - Market size and forecast 2025-2030 ($ million)
Data Table on UK - Market size and forecast 2025-2030 ($ million)
Chart on UK - Year-over-year growth 2025-2030 (%)
Data Table on UK - Year-over-year growth 2025-2030 (%)

13.5.3 France - Market size and forecast 2025-2030

Chart on France - Market size and forecast 2025-2030 ($ million)
Data Table on France - Market size and forecast 2025-2030 ($ million)
Chart on France - Year-over-year growth 2025-2030 (%)
Data Table on France - Year-over-year growth 2025-2030 (%)

13.5.4 Italy - Market size and forecast 2025-2030

Chart on Italy - Market size and forecast 2025-2030 ($ million)
Data Table on Italy - Market size and forecast 2025-2030 ($ million)
Chart on Italy - Year-over-year growth 2025-2030 (%)
Data Table on Italy - Year-over-year growth 2025-2030 (%)

13.5.5 Spain - Market size and forecast 2025-2030

Chart on Spain - Market size and forecast 2025-2030 ($ million)
Data Table on Spain - Market size and forecast 2025-2030 ($ million)
Chart on Spain - Year-over-year growth 2025-2030 (%)
Data Table on Spain - Year-over-year growth 2025-2030 (%)

13.5.6 The Netherlands - Market size and forecast 2025-2030

Chart on The Netherlands - Market size and forecast 2025-2030 ($ million)
Data Table on The Netherlands - Market size and forecast 2025-2030 ($ million)
Chart on The Netherlands - Year-over-year growth 2025-2030 (%)
Data Table on The Netherlands - Year-over-year growth 2025-2030 (%)

13.6 Middle East and Africa - Market size and forecast 2025-2030

Chart on Middle East and Africa - Market size and forecast 2025-2030 ($ million)
Data Table on Middle East and Africa - Market size and forecast 2025-2030 ($ million)
Chart on Middle East and Africa - Year-over-year growth 2025-2030 (%)
Data Table on Middle East and Africa - Year-over-year growth 2025-2030 (%)
Chart on Regional Comparison - Middle East and Africa
Data Table on Regional Comparison - Middle East and Africa

13.6.1 Saudi Arabia - Market size and forecast 2025-2030

Chart on Saudi Arabia - Market size and forecast 2025-2030 ($ million)
Data Table on Saudi Arabia - Market size and forecast 2025-2030 ($ million)
Chart on Saudi Arabia - Year-over-year growth 2025-2030 (%)
Data Table on Saudi Arabia - Year-over-year growth 2025-2030 (%)

13.6.2 UAE - Market size and forecast 2025-2030

Chart on UAE - Market size and forecast 2025-2030 ($ million)
Data Table on UAE - Market size and forecast 2025-2030 ($ million)
Chart on UAE - Year-over-year growth 2025-2030 (%)
Data Table on UAE - Year-over-year growth 2025-2030 (%)

13.6.3 South Africa - Market size and forecast 2025-2030

Chart on South Africa - Market size and forecast 2025-2030 ($ million)
Data Table on South Africa - Market size and forecast 2025-2030 ($ million)
Chart on South Africa - Year-over-year growth 2025-2030 (%)
Data Table on South Africa - Year-over-year growth 2025-2030 (%)

13.6.4 Israel - Market size and forecast 2025-2030

Chart on Israel - Market size and forecast 2025-2030 ($ million)
Data Table on Israel - Market size and forecast 2025-2030 ($ million)
Chart on Israel - Year-over-year growth 2025-2030 (%)
Data Table on Israel - Year-over-year growth 2025-2030 (%)

13.6.5 Turkey - Market size and forecast 2025-2030

Chart on Turkey - Market size and forecast 2025-2030 ($ million)
Data Table on Turkey - Market size and forecast 2025-2030 ($ million)
Chart on Turkey - Year-over-year growth 2025-2030 (%)
Data Table on Turkey - Year-over-year growth 2025-2030 (%)

13.7 South America - Market size and forecast 2025-2030

Chart on South America - Market size and forecast 2025-2030 ($ million)
Data Table on South America - Market size and forecast 2025-2030 ($ million)
Chart on South America - Year-over-year growth 2025-2030 (%)
Data Table on South America - Year-over-year growth 2025-2030 (%)
Chart on Regional Comparison - South America
Data Table on Regional Comparison - South America

13.7.1 Brazil - Market size and forecast 2025-2030

Chart on Brazil - Market size and forecast 2025-2030 ($ million)
Data Table on Brazil - Market size and forecast 2025-2030 ($ million)
Chart on Brazil - Year-over-year growth 2025-2030 (%)
Data Table on Brazil - Year-over-year growth 2025-2030 (%)

13.7.2 Argentina - Market size and forecast 2025-2030

Chart on Argentina - Market size and forecast 2025-2030 ($ million)
Data Table on Argentina - Market size and forecast 2025-2030 ($ million)
Chart on Argentina - Year-over-year growth 2025-2030 (%)
Data Table on Argentina - Year-over-year growth 2025-2030 (%)

13.7.3 Chile - Market size and forecast 2025-2030

Chart on Chile - Market size and forecast 2025-2030 ($ million)
Data Table on Chile - Market size and forecast 2025-2030 ($ million)
Chart on Chile - Year-over-year growth 2025-2030 (%)
Data Table on Chile - Year-over-year growth 2025-2030 (%)

13.8 Market opportunity by geography

Market opportunity by geography ($ million)
Data Tables on Market opportunity by geography ($ million)

14. Drivers, Challenges, and Opportunity

14.1 Market drivers

Rapid expansion of global infrastructure and urbanization
Technological breakthroughs and shift toward cordless platforms
Proliferation of DIY culture and residential renovation

14.2 Market challenges

Stringent environmental regulations and emissions standards
Severe raw material volatility and supply chain bottlenecks
Intense price competition and counterfeit product penetration

14.3 Impact of drivers and challenges

Impact of drivers and challenges in 2025 and 2030

14.4 Market opportunities

Proliferation of smart and connected IoT-enabled power tools
Surging market penetration of high-voltage cordless ecosystems
Integration of ergonomic designs and advanced operator safety features

15. Competitive Landscape

15.1 Overview

15.2

Overview on criticality of inputs and factors of differentiation

15.3 Landscape disruption

Overview on factors of disruption

15.4 Industry risks

Impact of key risks on business

16. Competitive Analysis

16.1 Companies profiled

Companies covered

16.2 Company ranking index

16.3 Market positioning of companies

Matrix on companies position and classification

16.4 Adolf Wurth GmbH and Co. KG

Adolf Wurth GmbH and Co. KG - Overview
Adolf Wurth GmbH and Co. KG - Product / Service
Adolf Wurth GmbH and Co. KG - Key offerings
SWOT

16.5 Atlas Copco AB

Atlas Copco AB - Overview
Atlas Copco AB - Business segments
Atlas Copco AB - Key offerings
Atlas Copco AB - Segment focus
SWOT

16.6 C. and E. Fein GmbH

C. and E. Fein GmbH - Overview
C. and E. Fein GmbH - Product / Service
C. and E. Fein GmbH - Key offerings
SWOT

16.7 Chervon Holdings Ltd.

Chervon Holdings Ltd. - Overview
Chervon Holdings Ltd. - Business segments
Chervon Holdings Ltd. - Key offerings
Chervon Holdings Ltd. - Segment focus
SWOT

16.8 Einhell Germany AG

Einhell Germany AG - Overview
Einhell Germany AG - Business segments
Einhell Germany AG - Key offerings
Einhell Germany AG - Segment focus
SWOT

16.9 Emerson Electric Co.

Emerson Electric Co. - Overview
Emerson Electric Co. - Business segments
Emerson Electric Co. - Key news
Emerson Electric Co. - Key offerings
Emerson Electric Co. - Segment focus
SWOT

16.10 Husqvarna AB

Husqvarna AB - Overview
Husqvarna AB - Business segments
Husqvarna AB - Key offerings
Husqvarna AB - Segment focus
SWOT

16.11 Illinois Tool Works Inc.

Illinois Tool Works Inc. - Overview
Illinois Tool Works Inc. - Business segments
Illinois Tool Works Inc. - Key offerings
Illinois Tool Works Inc. - Segment focus
SWOT

16.12 Ingersoll Rand Inc.

Ingersoll Rand Inc. - Overview
Ingersoll Rand Inc. - Business segments
Ingersoll Rand Inc. - Key offerings
Ingersoll Rand Inc. - Segment focus
SWOT

16.13 Kyocera Corp.

Kyocera Corp. - Overview
Kyocera Corp. - Business segments
Kyocera Corp. - Key offerings
Kyocera Corp. - Segment focus
SWOT

16.14 Positec Tool Corp.

Positec Tool Corp. - Overview
Positec Tool Corp. - Product / Service
Positec Tool Corp. - Key offerings
SWOT

16.15 Robert Bosch GmbH

Robert Bosch GmbH - Overview
Robert Bosch GmbH - Product / Service
Robert Bosch GmbH - Key offerings
SWOT

16.16 Snap On Inc.

Snap On Inc. - Overview
Snap On Inc. - Business segments
Snap On Inc. - Key offerings
Snap On Inc. - Segment focus
SWOT

16.17 Stanley Black and Decker Inc.

Stanley Black and Decker Inc. - Overview
Stanley Black and Decker Inc. - Business segments
Stanley Black and Decker Inc. - Key offerings
Stanley Black and Decker Inc. - Segment focus
SWOT

16.18 Techtronic Industries Co. Ltd.

Techtronic Industries Co. Ltd. - Overview
Techtronic Industries Co. Ltd. - Business segments
Techtronic Industries Co. Ltd. - Key offerings
Techtronic Industries Co. Ltd. - Segment focus
SWOT

17. Appendix

17.1 Scope of the report

Market definition
Objectives
Notes and caveats

17.2 Inclusions and exclusions checklist

Inclusions checklist
Exclusions checklist

17.3 Currency conversion rates for US$

17.4 Research methodology

17.5 Data procurement

Information sources

17.6 Data validation

17.7 Validation techniques employed for market sizing

17.8 Data synthesis

17.9 360 degree market analysis

17.10 List of abbreviations

Research Methodology

Technavio presents a detailed picture of the market by way of study, synthesis, and summation of data from multiple sources. The analysts have presented the various facets of the market with a particular focus on identifying the key industry influencers. The data thus presented is comprehensive, reliable, and the result of extensive research, both primary and secondary.

INFORMATION SOURCES

Primary sources

  • Manufacturers and suppliers
  • Channel partners
  • Industry experts
  • Strategic decision makers

Secondary sources

  • Industry journals and periodicals
  • Government data
  • Financial reports of key industry players
  • Historical data
  • Press releases

DATA ANALYSIS

Data Synthesis

  • Collation of data
  • Estimation of key figures
  • Analysis of derived insights

Data Validation

  • Triangulation with data models
  • Reference against proprietary databases
  • Corroboration with industry experts

REPORT WRITING

Qualitative

  • Market drivers
  • Market challenges
  • Market trends
  • Five forces analysis

Quantitative

  • Market size and forecast
  • Market segmentation
  • Geographical insights
  • Competitive landscape

Interested in this report?

Get your sample now to see our research methodology and insights!

Download Now

Frequently Asked Questions

Power Tools market growth will increase by USD 18108.4 million during 2026-2030.

The Power Tools market is expected to grow at a CAGR of 7.3% during 2026-2030.

Power Tools market is segmented by End-user (Industrial, Residential) Technology (Electric, Pneumatic, Others) Product (Drills, Saws, Grinders, Others) Distribution channel (Offline, Online)

Adolf Wurth GmbH and Co. KG, Apex Tool Group LLC, Atlas Copco AB, C. and E. Fein GmbH, Chervon Holdings Ltd., Einhell Germany AG, Emerson Electric Co., Husqvarna AB, Illinois Tool Works Inc., Ingersoll Rand Inc., Koki Holdings Co. Ltd., Kyocera Corp., Metabowerke GmbH, Positec Tool Corp., Robert Bosch GmbH, SKIL, Snap On Inc., Stanley Black and Decker Inc., Techtronic Industries Co. Ltd., The Black and Decker are a few of the key vendors in the Power Tools market.

APAC will register the highest growth rate of 38.9% among the other regions. Therefore, the Power Tools market in APAC is expected to garner significant business opportunities for the vendors during the forecast period.

China, Japan, India, South Korea, Australia, Indonesia, US, Canada, Mexico, Germany, UK, France, Italy, Spain, The Netherlands, Saudi Arabia, UAE, South Africa, Israel, Turkey, Brazil, Argentina, Chile

  • Rapid expansion of global infrastructure and urbanization is the driving factor this market.

The Power Tools market vendors should focus on grabbing business opportunities from the End-user segment as it accounted for the largest market share in the base year.
RIA - Research AI Assistant
Ask RIA