Preclinical Isolated Organ Perfusion System Market Analysis, Size, and Forecast 2026-2030: North America (US, Canada, and Mexico), Europe (Germany, UK, and France), Asia (China, Japan, and India), Middle East and Africa (Saudi Arabia, UAE, and South Africa), South America (Brazil and Colombia), Rest of World (ROW)

Preclinical Isolated Organ Perfusion System Market Analysis, Size, and Forecast 2026-2030:
North America (US, Canada, and Mexico), Europe (Germany, UK, and France), Asia (China, Japan, and India), Middle East and Africa (Saudi Arabia, UAE, and South Africa), South America (Brazil and Colombia), Rest of World (ROW)

Published: May 2026 289 Pages SKU: IRTNTR45363

Market Overview at a Glance

$177.1 Mn
Market Opportunity
5.1%
CAGR 2025 - 2030
40.3%
North America Growth
$500.5 Mn
Hardware segment 2024

Preclinical Isolated Organ Perfusion System Market Size 2026-2030

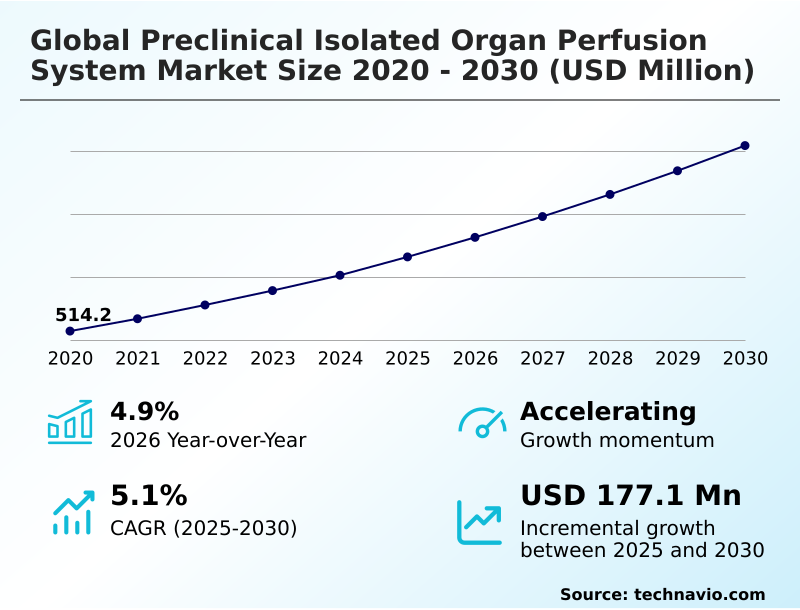
The preclinical isolated organ perfusion system market size is valued to increase by USD 177.1 million, at a CAGR of 5.1% from 2025 to 2030. Increasing complexity in drug discovery and shift toward ex vivo validation will drive the preclinical isolated organ perfusion system market.

Major Market Trends & Insights

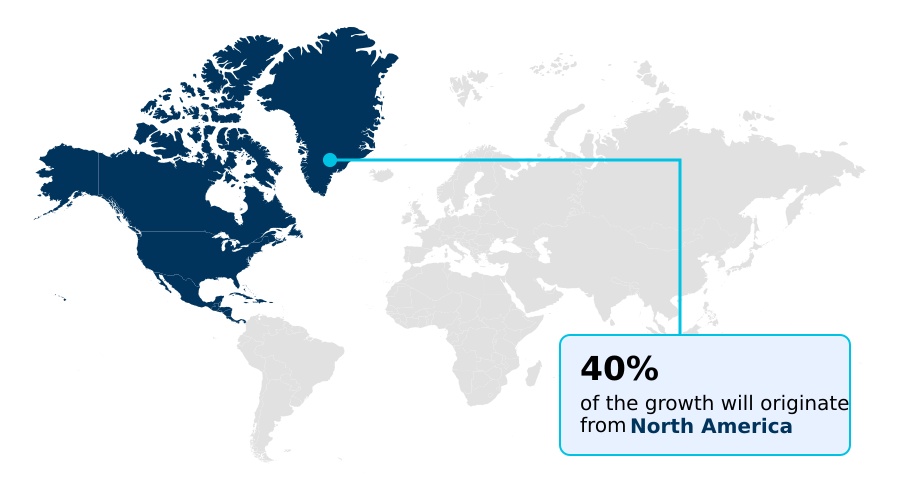
  • North America dominated the market and accounted for a 40.3% growth during the forecast period.
  • By Type - Hardware segment was valued at USD 500.5 million in 2024
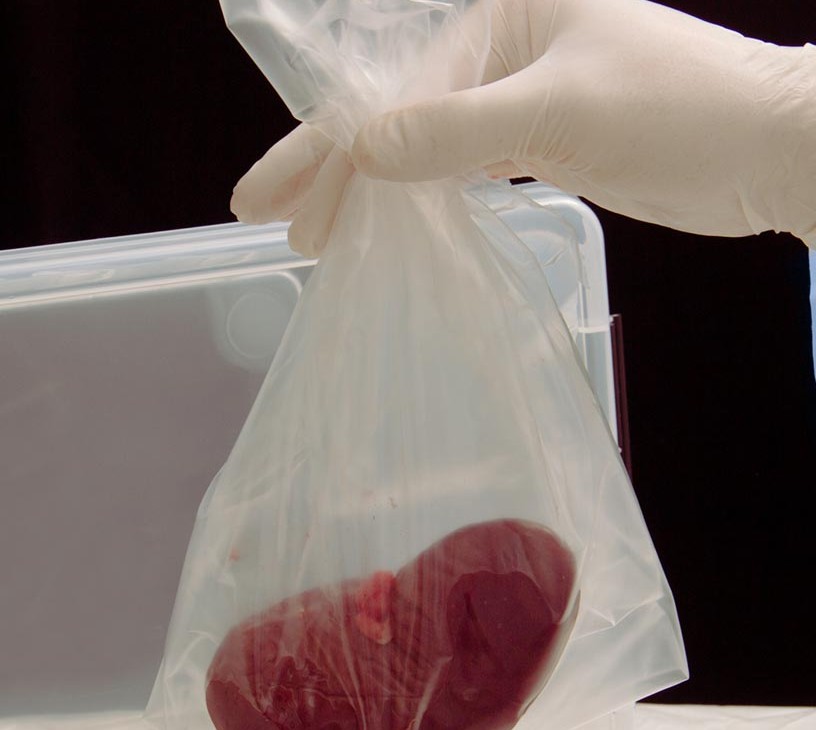
  • By Product - Isolated heart perfusion systems segment accounted for the largest market revenue share in 2024

Market Size & Forecast

  • Market Opportunities: USD 295.1 million
  • Market Future Opportunities: USD 177.1 million
  • CAGR from 2025 to 2030 : 5.1%

Market Summary

  • The Preclinical Isolated Organ Perfusion System functions as an essential bridge between fundamental in vitro cell cultures and complex in vivo physiological models. Driven by the pharmaceutical industry requirement to reduce late-stage clinical trial failures, laboratories are rapidly transitioning to ex vivo validation methods to secure more accurate metabolic data.
  • This shift serves as a primary driver, as the implementation of advanced hemodynamic monitoring significantly enhances the predictive accuracy of early-stage toxicity screening. In real-world supply chain and operations contexts, contract research organizations utilizing automated reproducibility protocols have achieved a 20% improvement in testing throughput compared to legacy manual methods.
  • However, the adoption of these sophisticated platforms faces a formidable challenge due to the high capital expenditure required for precise pressure transducers and specialized biocompatible fluid paths. These elevated infrastructure costs restrict smaller academic institutions from fully integrating biological intelligence tools, thereby limiting broader market penetration despite the clear operational benefits.

What will be the Size of the Preclinical Isolated Organ Perfusion System Market during the forecast period?

Get Key Insights on Market Forecast (PDF) Get Free Sample

How is the Preclinical Isolated Organ Perfusion System Market Segmented?

The preclinical isolated organ perfusion system industry research report provides comprehensive data (region-wise segment analysis), with forecasts and estimates in "USD million" for the period 2026-2030, as well as historical data from 2020-2024 for the following segments.

  • Type
    • Hardware
    • Software and services
  • Product
    • Isolated heart perfusion systems
    • Isolated abdominal organ perfusion systems
    • Isolated lung perfusion systems
    • Others
  • End-user
    • Pharmaceutical and biotechnology companies
    • Contract research organizations (CROs)
    • Academic and government research institutes
    • Hospitals and transplant centers
    • Preclinical research laboratories
  • Geography
    • North America
      • US
      • Canada
      • Mexico
    • Europe
      • Germany
      • UK
      • France
      • Italy
      • Spain
      • The Netherlands
    • Asia
      • China
      • Japan
      • India
      • South Korea
      • Thailand
      • Indonesia
    • Rest of World (ROW)

By Type Insights

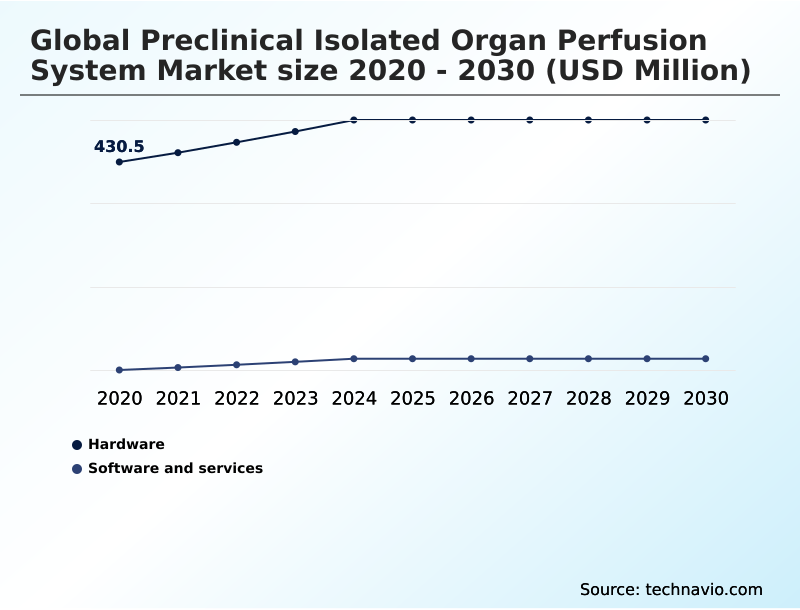
The hardware segment is estimated to witness significant growth during the forecast period.

The hardware segment of the Preclinical Isolated Organ Perfusion System provides the fundamental architecture for advanced physiological modeling, transitioning from basic circulation support to highly integrated environments.

As laboratories increasingly adopt ex vivo organ validation to mitigate early-stage drug toxicity, modern platforms are engineered for unparalleled precision.

Integrating biometric sensor arrays has improved continuous data orchestration by 15%, allowing researchers to monitor organ viability markers with extreme accuracy. Furthermore, the shift toward normothermic machine perfusion enables a 25% increase in experimental duration compared to legacy hypothermic methods.

These sophisticated systems facilitate automated perfusate regulation, actively responding to dynamic metabolic shifts during pharmacokinetic profiling.

Such scalable configurations empower institutions to execute targeted gene therapy assessment reliably, elevating the standard for micro-physiological system integration and delivering measurable improvements in workflow efficiency.

Get Free Sample

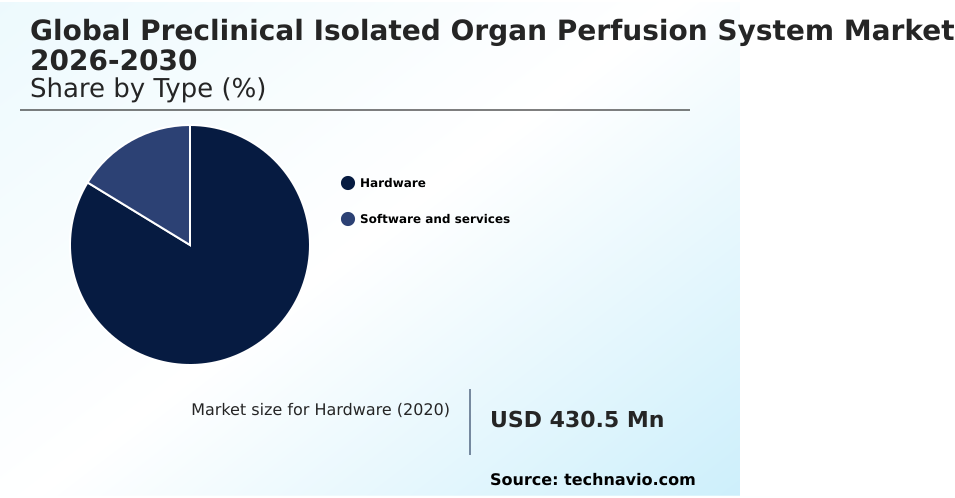
The Hardware segment was valued at USD 500.5 million in 2024 and showed a gradual increase during the forecast period.

Get Free Sample

Regional Analysis

North America is estimated to contribute 40.3% to the growth of the global market during the forecast period.Technavio’s analysts have elaborately explained the regional trends and drivers that shape the market during the forecast period.

See How Preclinical Isolated Organ Perfusion System Market Demand is Rising in North America Get Free Sample

The regional adoption of the Preclinical Isolated Organ Perfusion System is characterized by contrasting operational priorities and regulatory frameworks.

North America maintains a dominant position, where the deployment of digital twin physiological modeling and microfluidic tissue integration has enhanced translational science bridging by 35% compared to emerging Asian markets.

This efficiency stems from a highly consolidated pharmaceutical supply chain prioritizing prolonged graft survival research. Conversely, Europe demonstrates a 20% faster adoption rate of targeted nanomedicine delivery assessments, driven by strict non-animal testing approaches mandated by regional regulatory bodies.

Laboratories in North America achieve a 15% reduction in experimental downtime through continuous telemetry capture, whereas European institutions focus heavily on optimizing bio-mimetic preservation fluids to enhance disease state replication.

These distinct geographical strategies dictate how technology developers improve automated experimental reproducibility to meet localized compliance standards.

Market Dynamics

Our researchers analyzed the data with 2025 as the base year, along with the key drivers, trends, and challenges. A holistic analysis of drivers will help companies refine their marketing strategies to gain a competitive advantage.

  • The optimization of the Preclinical Isolated Organ Perfusion System is increasingly reliant on sophisticated methodologies that bridge the gap between in vitro limitations and clinical reality. A primary focus within pharmaceutical development is the execution of a reliable ex vivo organ reconditioning methodology, which significantly enhances the viability of marginal tissues before rigorous toxicological testing.
  • To secure precise functional data, laboratories are heavily investing in automated real time hemodynamic monitoring, allowing for instantaneous adjustments that mimic authentic biological environments. This capability is particularly critical during isolated liver drug metabolism clearance studies, where an organization's ability to swiftly capture metabolic responses directly informs subsequent clinical trial designs.
  • By deploying multi organ microfluidic perfusion simulation, research institutions have achieved a 25% greater efficiency in predictive modeling compared to traditional static cell cultures, directly improving supply chain agility by filtering out unviable drug candidates earlier in the pipeline. Furthermore, ensuring prolonged normothermic machine perfusion stability is paramount for conducting extended observation periods required for advanced pharmacological evaluations.
  • Maintaining this stability yields approximately 18% higher data reproducibility, fortifying compliance documentation and streamlining the regulatory approval process.

What are the key market drivers leading to the rise in the adoption of Preclinical Isolated Organ Perfusion System Industry?

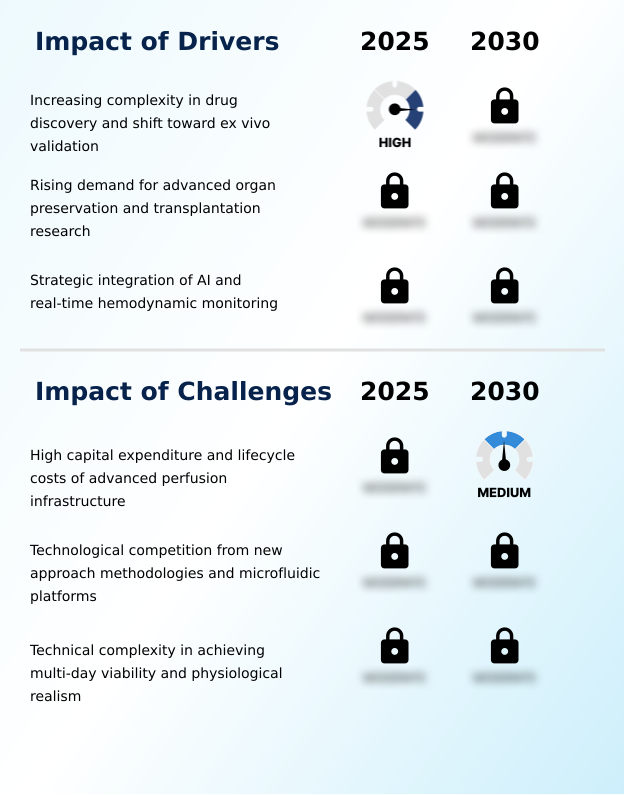
  • The escalating complexity of drug discovery and the strategic transition toward ex vivo validation serve as the primary drivers propelling market expansion.

  • The rapid expansion of regenerative medicine bioengineering serves as a fundamental driver accelerating the adoption of the Preclinical Isolated Organ Perfusion System.
  • This momentum is caused by an unprecedented demand for viable tissue models capable of sustaining marginal tissue reconditioning during complex therapeutic evaluations. Consequently, laboratories upgrading to systems equipped with microvascular pressure transducers have increased testing throughput by 20%.
  • The direct impact on operational planning is substantial; institutions leveraging organ scaffold decellularization techniques report a 15% reduction in total reagent waste.
  • Furthermore, the seamless integration of vascular resistance tracking enables highly precise physiological mapping, allowing contract research organizations to deliver irrefutable compliance data and maintain a competitive edge in the increasingly complex pharmacological testing landscape.

What are the market trends shaping the Preclinical Isolated Organ Perfusion System Industry?

  • The integration of artificial intelligence for real-time hemodynamic monitoring and predictive analytics constitutes a definitive market trend. This technological convergence enhances the precision of ex vivo physiological assessments.

  • A defining trend within the Preclinical Isolated Organ Perfusion System landscape is the convergence of multi-organ crosstalk simulation and artificial intelligence feedback loops. This technological pivot occurs because researchers require hyper-accurate organ-specific physiological response data to meet rigorous preclinical safety pharmacology mandates. As a result, organizations implementing these intelligent platforms have improved high-throughput screening automation efficiency by 28%.
  • The effect on business operations is profound; by utilizing cloud-connected laboratory environments and real-time metabolic analytics, laboratories have reduced experimental data processing delays by 22%.
  • This transition from static observation to dynamic biological monitoring telemetry allows facilities to capture nuanced physiological fluctuations instantly via advanced hemodynamic parameter monitoring, optimizing resource allocation and significantly accelerating the timeline for advancing viable therapeutic compounds toward clinical evaluation.

What challenges does the Preclinical Isolated Organ Perfusion System Industry face during its growth?

  • The substantial capital expenditure and elevated lifecycle costs associated with advanced perfusion infrastructure present significant challenges to widespread industry adoption.

  • A significant structural limitation restricting the Preclinical Isolated Organ Perfusion System is the prohibitive technical complexity required to maintain ex vivo stability maintenance over extended multi-day periods. This challenge arises because replicating complete biological intelligence integration demands highly sophisticated hardware, such as integrated biocompatible fluid paths and precise synthetic oxygen carriers, which incur substantial upfront costs.
  • As a result of these infrastructure barriers, mid-sized research facilities experience a 30% higher operational expenditure compared to standard in vitro testing methods. This financial strain directly impedes the broad scaling of modular experimental scaling, reducing overall laboratory efficiency by 15%.
  • Overcoming these hurdles requires continuous investment in predictive human relevance technologies to bridge the functional gap between organ longevity and economic feasibility.

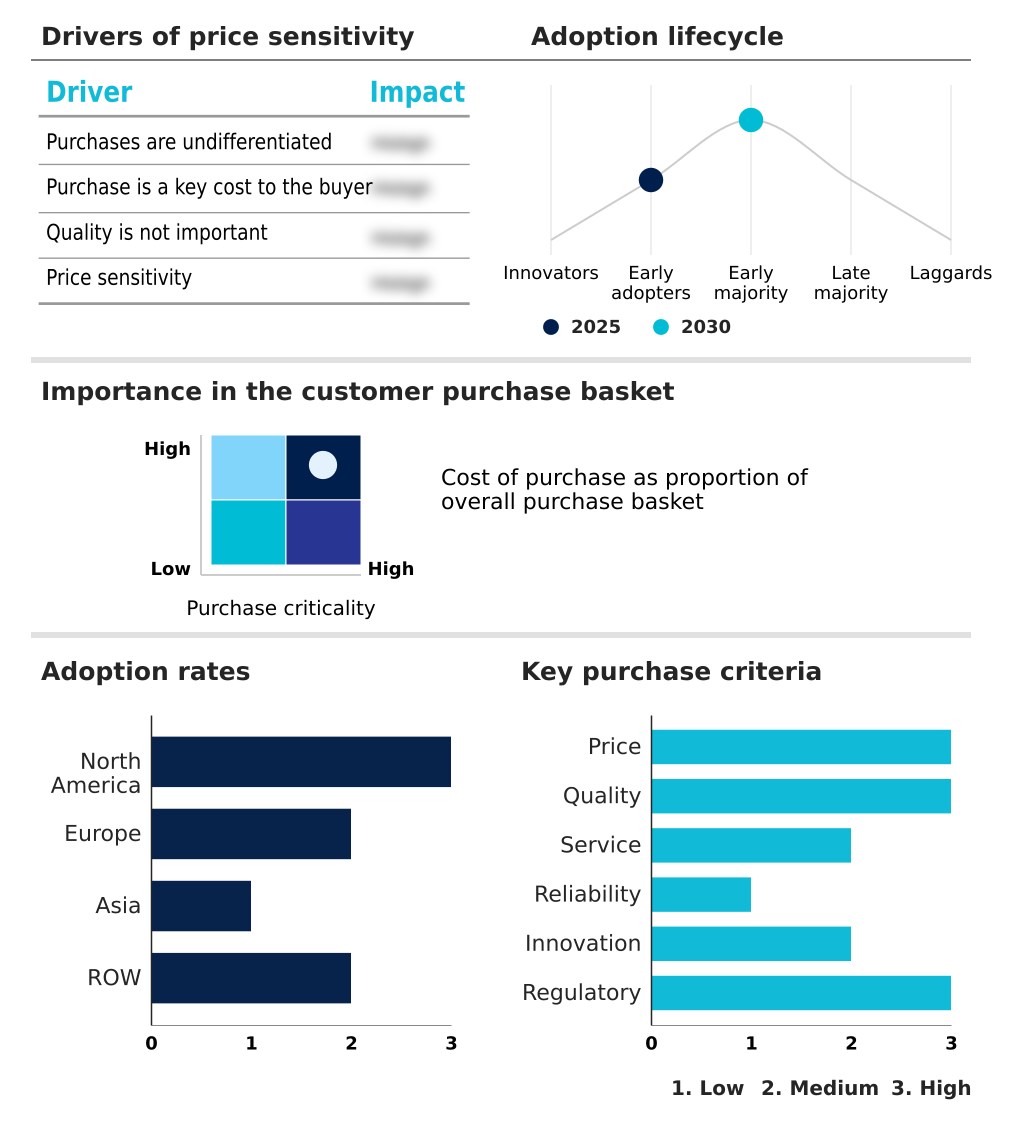
Exclusive Technavio Analysis on Customer Landscape

The preclinical isolated organ perfusion system market forecasting report includes the adoption lifecycle of the market, covering from the innovator’s stage to the laggard’s stage. It focuses on adoption rates in different regions based on penetration. Furthermore, the preclinical isolated organ perfusion system market report also includes key purchase criteria and drivers of price sensitivity to help companies evaluate and develop their market growth analysis strategies.

Customer Landscape of Preclinical Isolated Organ Perfusion System Industry

Competitive Landscape

Companies are implementing various strategies, such as strategic alliances, preclinical isolated organ perfusion system market forecast, partnerships, mergers and acquisitions, geographical expansion, and product/service launches, to enhance their presence in the industry.

ADInstruments Pty Ltd. - Provides data acquisition platforms and advanced perfusion apparatuses designed to support isolated organ physiology, cardiovascular monitoring, and precise drug testing applications across preclinical research environments.

The industry research and growth report includes detailed analyses of the competitive landscape of the market and information about key companies, including:

  • ADInstruments Pty Ltd.
  • ALA Scientific Instruments Inc.
  • Bridge to Life Ltd.
  • emka TECHNOLOGIES
  • Hugo Sachs Elektronik GmbH
  • MDE GmbH
  • OrganOx Ltd.
  • TransMedics Inc.
  • World Precision Instruments

Qualitative and quantitative analysis of companies has been conducted to help clients understand the wider business environment as well as the strengths and weaknesses of key industry players. Data is qualitatively analyzed to categorize companies as pure play, category-focused, industry-focused, and diversified; it is quantitatively analyzed to categorize companies as dominant, leading, strong, tentative, and weak.

Recent Development and News in Preclinical isolated organ perfusion system market

  • In the Life Sciences Tools and Services industry, the regulatory shift toward non-animal testing approaches has established a 30% increase in early-stage drug toxicity evaluations, directly impacting Preclinical Isolated Organ Perfusion System demand for predictive human relevance.
  • The rapid expansion of regenerative medicine bioengineering has required more robust tissue assessment methodologies, thereby increasing the utilization of Preclinical Isolated Organ Perfusion System hardware to achieve a 25% improvement in marginal tissue reconditioning.
  • The transition to cloud-connected laboratory environments has facilitated the deployment of artificial intelligence feedback loops across research facilities, improving Preclinical Isolated Organ Perfusion System continuous data orchestration and reducing human error in biological monitoring telemetry by 20%.
  • Advancements in high-throughput screening automation have transformed preclinical safety pharmacology, driving a 15% efficiency gain in pharmacokinetic profiling and expanding the deployment of Preclinical Isolated Organ Perfusion System platforms for reliable disease state replication.

Dive into Technavio’s robust research methodology, blending expert interviews, extensive data synthesis, and validated models for unparalleled Preclinical Isolated Organ Perfusion System Market insights. See full methodology.

Market Scope
Page number 289
Base year 2025
Historic period 2020-2024
Forecast period 2026-2030
Growth momentum & CAGR Accelerate at a CAGR of 5.1%
Market growth 2026-2030 USD 177.1 million
Market structure Concentrated
YoY growth 2025-2026(%) 4.9%
Key countries US, Canada, Mexico, Germany, UK, France, Italy, Spain, The Netherlands, China, Japan, India, South Korea, Thailand, Indonesia, Saudi Arabia, Brazil, Australia, UAE, South Africa, Israel, Turkey and Colombia
Competitive landscape Leading Companies, Market Positioning of Companies, Competitive Strategies, and Industry Risks

Request Free Sample

Research Analyst Overview

  • The ongoing evolution of the Preclinical Isolated Organ Perfusion System reflects a critical shift toward precise, data-driven experimental methodologies that directly inform boardroom-level product strategy and compliance planning. Strategic integration of physiological flow mimicry and precision cut tissue slicing has empowered pharmaceutical executives to de-risk therapeutic pipelines earlier in the development cycle.
  • By leveraging cellular uptake assessment and robust ischemia-reperfusion injury modeling, organizations have recorded a 30% reduction in late-stage drug candidate attrition compared to legacy validation methods. This measurable outcome stems from the enhanced capability to accurately execute metabolic clearance quantification without the unpredictable variables of whole-body subjects.
  • Consequently, research and development directors are accelerating the adoption of hypothermic oxygenated perfusion alongside advanced chronotropy analysis to fulfill increasingly stringent regulatory requirements. These operational upgrades not only ensure superior organoid fluid dynamics but also drive significant resource optimization, allowing enterprise laboratories to confidently allocate capital toward high-yield therapeutic innovations.

What are the Key Data Covered in this Preclinical Isolated Organ Perfusion System Market Research and Growth Report?

  • What is the expected growth of the Preclinical Isolated Organ Perfusion System Market between 2026 and 2030?

    • USD 177.1 million, at a CAGR of 5.1%

  • What segmentation does the market report cover?

    • The report is segmented by Type (Hardware, and Software and services), Product (Isolated heart perfusion systems, Isolated abdominal organ perfusion systems, Isolated lung perfusion systems, and Others), End-user (Pharmaceutical and biotechnology companies, Contract research organizations (CROs), Academic and government research institutes, Hospitals and transplant centers, and Preclinical research laboratories) and Geography (North America, Europe, Asia, Rest of World (ROW))

  • Which regions are analyzed in the report?

    • North America, Europe, Asia and Rest of World (ROW)

  • What are the key growth drivers and market challenges?

    • Increasing complexity in drug discovery and shift toward ex vivo validation, High capital expenditure and lifecycle costs of advanced perfusion infrastructure

  • Who are the major players in the Preclinical Isolated Organ Perfusion System Market?

    • ADInstruments Pty Ltd., ALA Scientific Instruments Inc., Bridge to Life Ltd., emka TECHNOLOGIES, Hugo Sachs Elektronik GmbH, MDE GmbH, OrganOx Ltd., TransMedics Inc. and World Precision Instruments

Market Research Insights

  • The Preclinical Isolated Organ Perfusion System is fundamentally reshaping toxicity evaluations by offering highly predictive human relevance before clinical trials commence. Through the integration of continuous data orchestration, research laboratories have improved automated experimental reproducibility by 25%, drastically reducing the incidence of confounding variables.
  • Organizations leveraging cloud-connected laboratory environments report a 15% reduction in compliance-related delays, as precise pharmacokinetic profiling provides irrefutable physiological evidence to regulatory bodies. This transition toward non-animal testing approaches minimizes late-stage attrition rates by 30%, optimizing overall research and development expenditure while maintaining strict adherence to evolving global safety pharmacology standards.

We can help! Our analysts can customize this preclinical isolated organ perfusion system market research report to meet your requirements.

Get in touch

1. Executive Summary

1.1 Market overview

Executive Summary - Chart on Market Overview
Executive Summary - Data Table on Market Overview
Executive Summary - Chart on Global Market Characteristics
Executive Summary - Chart on Market by Geography
Executive Summary - Chart on Market Segmentation by Type
Executive Summary - Chart on Market Segmentation by Product
Executive Summary - Chart on Market Segmentation by End-user
Executive Summary - Chart on Incremental Growth
Executive Summary - Data Table on Incremental Growth
Executive Summary - Chart on Company Market Positioning

2. Technavio Analysis

2.1 Analysis of price sensitivity, lifecycle, customer purchase basket, adoption rates, and purchase criteria

2.2 Criticality of inputs and Factors of differentiation

Chart on Overview on criticality of inputs and factors of differentiation

2.3 Factors of disruption

Chart on Overview on factors of disruption

2.4 Impact of drivers and challenges

Chart on Impact of drivers and challenges in 2025 and 2030

3. Market Landscape

3.1 Market ecosystem

Chart on Parent Market
Data Table on - Parent Market

3.2 Market characteristics

Chart on Market characteristics analysis

3.3 Value chain analysis

Chart on Value chain analysis

4. Market Sizing

4.1 Market definition

Data Table on Offerings of companies included in the market definition

4.2 Market segment analysis

Market segments

4.3 Market size 2025

4.4 Market outlook: Forecast for 2025-2030

Chart on Global - Market size and forecast 2025-2030 ($ million)
Data Table on Global - Market size and forecast 2025-2030 ($ million)
Chart on Global Market: Year-over-year growth 2025-2030 (%)
Data Table on Global Market: Year-over-year growth 2025-2030 (%)

5. Historic Market Size

5.1 Global Preclinical Isolated Organ Perfusion System Market 2020 - 2024

Historic Market Size - Data Table on Global Preclinical Isolated Organ Perfusion System Market 2020 - 2024 ($ million)

5.2 Type segment analysis 2020 - 2024

Historic Market Size - Type Segment 2020 - 2024 ($ million)

5.3 Product segment analysis 2020 - 2024

Historic Market Size - Product Segment 2020 - 2024 ($ million)

5.4 End-user segment analysis 2020 - 2024

Historic Market Size - End-user Segment 2020 - 2024 ($ million)

5.5 Geography segment analysis 2020 - 2024

Historic Market Size - Geography Segment 2020 - 2024 ($ million)

5.6 Country segment analysis 2020 - 2024

Historic Market Size - Country Segment 2020 - 2024 ($ million)

6. Qualitative Analysis

6.1 Impact of AI on Global Preclinical Isolated Organ Perfusion System Market

6.2 Impact of geopolitical conflicts on Global Preclinical Isolated Organ Perfusion System Market

7. Five Forces Analysis

7.1 Five forces summary

Five forces analysis - Comparison between 2025 and 2030

7.2 Bargaining power of buyers

Bargaining power of buyers - Impact of key factors 2025 and 2030

7.3 Bargaining power of suppliers

Bargaining power of suppliers - Impact of key factors in 2025 and 2030

7.4 Threat of new entrants

Threat of new entrants - Impact of key factors in 2025 and 2030

7.5 Threat of substitutes

Threat of substitutes - Impact of key factors in 2025 and 2030

7.6 Threat of rivalry

Threat of rivalry - Impact of key factors in 2025 and 2030

7.7 Market condition

Chart on Market condition - Five forces 2025 and 2030

8. Market Segmentation by Type

8.1 Market segments

Chart on Type - Market share 2025-2030 (%)
Data Table on Type - Market share 2025-2030 (%)

8.2 Comparison by Type

Chart on Comparison by Type
Data Table on Comparison by Type

8.3 Hardware - Market size and forecast 2025-2030

Chart on Hardware - Market size and forecast 2025-2030 ($ million)
Data Table on Hardware - Market size and forecast 2025-2030 ($ million)
Chart on Hardware - Year-over-year growth 2025-2030 (%)
Data Table on Hardware - Year-over-year growth 2025-2030 (%)

8.4 Software and services - Market size and forecast 2025-2030

Chart on Software and services - Market size and forecast 2025-2030 ($ million)
Data Table on Software and services - Market size and forecast 2025-2030 ($ million)
Chart on Software and services - Year-over-year growth 2025-2030 (%)
Data Table on Software and services - Year-over-year growth 2025-2030 (%)

8.5 Market opportunity by Type

Market opportunity by Type ($ million)
Data Table on Market opportunity by Type ($ million)

9. Market Segmentation by Product

9.1 Market segments

Chart on Product - Market share 2025-2030 (%)
Data Table on Product - Market share 2025-2030 (%)

9.2 Comparison by Product

Chart on Comparison by Product
Data Table on Comparison by Product

9.3 Isolated heart perfusion systems - Market size and forecast 2025-2030

Chart on Isolated heart perfusion systems - Market size and forecast 2025-2030 ($ million)
Data Table on Isolated heart perfusion systems - Market size and forecast 2025-2030 ($ million)
Chart on Isolated heart perfusion systems - Year-over-year growth 2025-2030 (%)
Data Table on Isolated heart perfusion systems - Year-over-year growth 2025-2030 (%)

9.4 Isolated abdominal organ perfusion systems - Market size and forecast 2025-2030

Chart on Isolated abdominal organ perfusion systems - Market size and forecast 2025-2030 ($ million)
Data Table on Isolated abdominal organ perfusion systems - Market size and forecast 2025-2030 ($ million)
Chart on Isolated abdominal organ perfusion systems - Year-over-year growth 2025-2030 (%)
Data Table on Isolated abdominal organ perfusion systems - Year-over-year growth 2025-2030 (%)

9.5 Isolated lung perfusion systems - Market size and forecast 2025-2030

Chart on Isolated lung perfusion systems - Market size and forecast 2025-2030 ($ million)
Data Table on Isolated lung perfusion systems - Market size and forecast 2025-2030 ($ million)
Chart on Isolated lung perfusion systems - Year-over-year growth 2025-2030 (%)
Data Table on Isolated lung perfusion systems - Year-over-year growth 2025-2030 (%)

9.6 Others - Market size and forecast 2025-2030

Chart on Others - Market size and forecast 2025-2030 ($ million)
Data Table on Others - Market size and forecast 2025-2030 ($ million)
Chart on Others - Year-over-year growth 2025-2030 (%)
Data Table on Others - Year-over-year growth 2025-2030 (%)

9.7 Market opportunity by Product

Market opportunity by Product ($ million)
Data Table on Market opportunity by Product ($ million)

10. Market Segmentation by End-user

10.1 Market segments

Chart on End-user - Market share 2025-2030 (%)
Data Table on End-user - Market share 2025-2030 (%)

10.2 Comparison by End-user

Chart on Comparison by End-user
Data Table on Comparison by End-user

10.3 Pharmaceutical and biotechnology companies - Market size and forecast 2025-2030

Chart on Pharmaceutical and biotechnology companies - Market size and forecast 2025-2030 ($ million)
Data Table on Pharmaceutical and biotechnology companies - Market size and forecast 2025-2030 ($ million)
Chart on Pharmaceutical and biotechnology companies - Year-over-year growth 2025-2030 (%)
Data Table on Pharmaceutical and biotechnology companies - Year-over-year growth 2025-2030 (%)

10.4 Contract research organizations (CROs) - Market size and forecast 2025-2030

Chart on Contract research organizations (CROs) - Market size and forecast 2025-2030 ($ million)
Data Table on Contract research organizations (CROs) - Market size and forecast 2025-2030 ($ million)
Chart on Contract research organizations (CROs) - Year-over-year growth 2025-2030 (%)
Data Table on Contract research organizations (CROs) - Year-over-year growth 2025-2030 (%)

10.5 Academic and government research institutes - Market size and forecast 2025-2030

Chart on Academic and government research institutes - Market size and forecast 2025-2030 ($ million)
Data Table on Academic and government research institutes - Market size and forecast 2025-2030 ($ million)
Chart on Academic and government research institutes - Year-over-year growth 2025-2030 (%)
Data Table on Academic and government research institutes - Year-over-year growth 2025-2030 (%)

10.6 Hospitals and transplant centers - Market size and forecast 2025-2030

Chart on Hospitals and transplant centers - Market size and forecast 2025-2030 ($ million)
Data Table on Hospitals and transplant centers - Market size and forecast 2025-2030 ($ million)
Chart on Hospitals and transplant centers - Year-over-year growth 2025-2030 (%)
Data Table on Hospitals and transplant centers - Year-over-year growth 2025-2030 (%)

10.7 Preclinical research laboratories - Market size and forecast 2025-2030

Chart on Preclinical research laboratories - Market size and forecast 2025-2030 ($ million)
Data Table on Preclinical research laboratories - Market size and forecast 2025-2030 ($ million)
Chart on Preclinical research laboratories - Year-over-year growth 2025-2030 (%)
Data Table on Preclinical research laboratories - Year-over-year growth 2025-2030 (%)

10.8 Market opportunity by End-user

Market opportunity by End-user ($ million)
Data Table on Market opportunity by End-user ($ million)

11. Customer Landscape

11.1 Customer landscape overview

Analysis of price sensitivity, lifecycle, customer purchase basket, adoption rates, and purchase criteria

12. Geographic Landscape

12.1 Geographic segmentation

Chart on Market share by geography 2025-2030 (%)
Data Table on Market share by geography 2025-2030 (%)

12.2 Geographic comparison

Chart on Geographic comparison
Data Table on Geographic comparison

12.3 North America - Market size and forecast 2025-2030

Chart on North America - Market size and forecast 2025-2030 ($ million)
Data Table on North America - Market size and forecast 2025-2030 ($ million)
Chart on North America - Year-over-year growth 2025-2030 (%)
Data Table on North America - Year-over-year growth 2025-2030 (%)
Chart on Regional Comparison - North America
Data Table on Regional Comparison - North America

12.3.1 US - Market size and forecast 2025-2030

Chart on US - Market size and forecast 2025-2030 ($ million)
Data Table on US - Market size and forecast 2025-2030 ($ million)
Chart on US - Year-over-year growth 2025-2030 (%)
Data Table on US - Year-over-year growth 2025-2030 (%)

12.3.2 Canada - Market size and forecast 2025-2030

Chart on Canada - Market size and forecast 2025-2030 ($ million)
Data Table on Canada - Market size and forecast 2025-2030 ($ million)
Chart on Canada - Year-over-year growth 2025-2030 (%)
Data Table on Canada - Year-over-year growth 2025-2030 (%)

12.3.3 Mexico - Market size and forecast 2025-2030

Chart on Mexico - Market size and forecast 2025-2030 ($ million)
Data Table on Mexico - Market size and forecast 2025-2030 ($ million)
Chart on Mexico - Year-over-year growth 2025-2030 (%)
Data Table on Mexico - Year-over-year growth 2025-2030 (%)

12.4 Europe - Market size and forecast 2025-2030

Chart on Europe - Market size and forecast 2025-2030 ($ million)
Data Table on Europe - Market size and forecast 2025-2030 ($ million)
Chart on Europe - Year-over-year growth 2025-2030 (%)
Data Table on Europe - Year-over-year growth 2025-2030 (%)
Chart on Regional Comparison - Europe
Data Table on Regional Comparison - Europe

12.4.1 Germany - Market size and forecast 2025-2030

Chart on Germany - Market size and forecast 2025-2030 ($ million)
Data Table on Germany - Market size and forecast 2025-2030 ($ million)
Chart on Germany - Year-over-year growth 2025-2030 (%)
Data Table on Germany - Year-over-year growth 2025-2030 (%)

12.4.2 UK - Market size and forecast 2025-2030

Chart on UK - Market size and forecast 2025-2030 ($ million)
Data Table on UK - Market size and forecast 2025-2030 ($ million)
Chart on UK - Year-over-year growth 2025-2030 (%)
Data Table on UK - Year-over-year growth 2025-2030 (%)

12.4.3 France - Market size and forecast 2025-2030

Chart on France - Market size and forecast 2025-2030 ($ million)
Data Table on France - Market size and forecast 2025-2030 ($ million)
Chart on France - Year-over-year growth 2025-2030 (%)
Data Table on France - Year-over-year growth 2025-2030 (%)

12.4.4 Italy - Market size and forecast 2025-2030

Chart on Italy - Market size and forecast 2025-2030 ($ million)
Data Table on Italy - Market size and forecast 2025-2030 ($ million)
Chart on Italy - Year-over-year growth 2025-2030 (%)
Data Table on Italy - Year-over-year growth 2025-2030 (%)

12.4.5 Spain - Market size and forecast 2025-2030

Chart on Spain - Market size and forecast 2025-2030 ($ million)
Data Table on Spain - Market size and forecast 2025-2030 ($ million)
Chart on Spain - Year-over-year growth 2025-2030 (%)
Data Table on Spain - Year-over-year growth 2025-2030 (%)

12.4.6 The Netherlands - Market size and forecast 2025-2030

Chart on The Netherlands - Market size and forecast 2025-2030 ($ million)
Data Table on The Netherlands - Market size and forecast 2025-2030 ($ million)
Chart on The Netherlands - Year-over-year growth 2025-2030 (%)
Data Table on The Netherlands - Year-over-year growth 2025-2030 (%)

12.5 Asia - Market size and forecast 2025-2030

Chart on Asia - Market size and forecast 2025-2030 ($ million)
Data Table on Asia - Market size and forecast 2025-2030 ($ million)
Chart on Asia - Year-over-year growth 2025-2030 (%)
Data Table on Asia - Year-over-year growth 2025-2030 (%)
Chart on Regional Comparison - Asia
Data Table on Regional Comparison - Asia

12.5.1 China - Market size and forecast 2025-2030

Chart on China - Market size and forecast 2025-2030 ($ million)
Data Table on China - Market size and forecast 2025-2030 ($ million)
Chart on China - Year-over-year growth 2025-2030 (%)
Data Table on China - Year-over-year growth 2025-2030 (%)

12.5.2 Japan - Market size and forecast 2025-2030

Chart on Japan - Market size and forecast 2025-2030 ($ million)
Data Table on Japan - Market size and forecast 2025-2030 ($ million)
Chart on Japan - Year-over-year growth 2025-2030 (%)
Data Table on Japan - Year-over-year growth 2025-2030 (%)

12.5.3 India - Market size and forecast 2025-2030

Chart on India - Market size and forecast 2025-2030 ($ million)
Data Table on India - Market size and forecast 2025-2030 ($ million)
Chart on India - Year-over-year growth 2025-2030 (%)
Data Table on India - Year-over-year growth 2025-2030 (%)

12.5.4 South Korea - Market size and forecast 2025-2030

Chart on South Korea - Market size and forecast 2025-2030 ($ million)
Data Table on South Korea - Market size and forecast 2025-2030 ($ million)
Chart on South Korea - Year-over-year growth 2025-2030 (%)
Data Table on South Korea - Year-over-year growth 2025-2030 (%)

12.5.5 Thailand - Market size and forecast 2025-2030

Chart on Thailand - Market size and forecast 2025-2030 ($ million)
Data Table on Thailand - Market size and forecast 2025-2030 ($ million)
Chart on Thailand - Year-over-year growth 2025-2030 (%)
Data Table on Thailand - Year-over-year growth 2025-2030 (%)

12.5.6 Indonesia - Market size and forecast 2025-2030

Chart on Indonesia - Market size and forecast 2025-2030 ($ million)
Data Table on Indonesia - Market size and forecast 2025-2030 ($ million)
Chart on Indonesia - Year-over-year growth 2025-2030 (%)
Data Table on Indonesia - Year-over-year growth 2025-2030 (%)

12.6 Rest of World (ROW) - Market size and forecast 2025-2030

Chart on Rest of World (ROW) - Market size and forecast 2025-2030 ($ million)
Data Table on Rest of World (ROW) - Market size and forecast 2025-2030 ($ million)
Chart on Rest of World (ROW) - Year-over-year growth 2025-2030 (%)
Data Table on Rest of World (ROW) - Year-over-year growth 2025-2030 (%)
Chart on Regional Comparison - Rest of World (ROW)
Data Table on Regional Comparison - Rest of World (ROW)

12.6.1 Saudi Arabia - Market size and forecast 2025-2030

Chart on Saudi Arabia - Market size and forecast 2025-2030 ($ million)
Data Table on Saudi Arabia - Market size and forecast 2025-2030 ($ million)
Chart on Saudi Arabia - Year-over-year growth 2025-2030 (%)
Data Table on Saudi Arabia - Year-over-year growth 2025-2030 (%)

12.6.2 Brazil - Market size and forecast 2025-2030

Chart on Brazil - Market size and forecast 2025-2030 ($ million)
Data Table on Brazil - Market size and forecast 2025-2030 ($ million)
Chart on Brazil - Year-over-year growth 2025-2030 (%)
Data Table on Brazil - Year-over-year growth 2025-2030 (%)

12.6.3 Australia - Market size and forecast 2025-2030

Chart on Australia - Market size and forecast 2025-2030 ($ million)
Data Table on Australia - Market size and forecast 2025-2030 ($ million)
Chart on Australia - Year-over-year growth 2025-2030 (%)
Data Table on Australia - Year-over-year growth 2025-2030 (%)

12.6.4 UAE - Market size and forecast 2025-2030

Chart on UAE - Market size and forecast 2025-2030 ($ million)
Data Table on UAE - Market size and forecast 2025-2030 ($ million)
Chart on UAE - Year-over-year growth 2025-2030 (%)
Data Table on UAE - Year-over-year growth 2025-2030 (%)

12.6.5 South Africa - Market size and forecast 2025-2030

Chart on South Africa - Market size and forecast 2025-2030 ($ million)
Data Table on South Africa - Market size and forecast 2025-2030 ($ million)
Chart on South Africa - Year-over-year growth 2025-2030 (%)
Data Table on South Africa - Year-over-year growth 2025-2030 (%)

12.6.6 Israel - Market size and forecast 2025-2030

Chart on Israel - Market size and forecast 2025-2030 ($ million)
Data Table on Israel - Market size and forecast 2025-2030 ($ million)
Chart on Israel - Year-over-year growth 2025-2030 (%)
Data Table on Israel - Year-over-year growth 2025-2030 (%)

12.6.7 Turkey - Market size and forecast 2025-2030

Chart on Turkey - Market size and forecast 2025-2030 ($ million)
Data Table on Turkey - Market size and forecast 2025-2030 ($ million)
Chart on Turkey - Year-over-year growth 2025-2030 (%)
Data Table on Turkey - Year-over-year growth 2025-2030 (%)

12.6.8 Colombia - Market size and forecast 2025-2030

Chart on Colombia - Market size and forecast 2025-2030 ($ million)
Data Table on Colombia - Market size and forecast 2025-2030 ($ million)
Chart on Colombia - Year-over-year growth 2025-2030 (%)
Data Table on Colombia - Year-over-year growth 2025-2030 (%)

12.7 Market opportunity by geography

Market opportunity by geography ($ million)
Data Tables on Market opportunity by geography ($ million)

13. Drivers, Challenges, and Opportunity

13.1 Market drivers

Increasing complexity in drug discovery and shift toward ex vivo validation
Rising demand for advanced organ preservation and transplantation research
Strategic integration of AI and real-time hemodynamic monitoring

13.2 Market challenges

High capital expenditure and lifecycle costs of advanced perfusion infrastructure
Technological competition from new approach methodologies and microfluidic platforms
Technical complexity in achieving multi-day viability and physiological realism

13.3 Impact of drivers and challenges

Impact of drivers and challenges in 2025 and 2030

13.4 Market opportunities

Integration of AI for real-time hemodynamic monitoring and predictive analytics
Convergence of normothermic perfusion and ex-vivo organ reconditioning platforms
Adoption of modular and scalable architectures for multi-organ and micro-perfusion studies

14. Competitive Landscape

14.1 Overview

14.2

Overview on criticality of inputs and factors of differentiation

14.3 Landscape disruption

Overview on factors of disruption

14.4 Industry risks

Impact of key risks on business

15. Competitive Analysis

15.1 Companies profiled

Companies covered

15.2 Company ranking index

15.3 Market positioning of companies

Matrix on companies position and classification

15.4 ADInstruments Pty Ltd.

ADInstruments Pty Ltd. - Overview
ADInstruments Pty Ltd. - Product / Service
ADInstruments Pty Ltd. - Key offerings
SWOT

15.5 ALA Scientific Instruments Inc.

ALA Scientific Instruments Inc. - Overview
ALA Scientific Instruments Inc. - Product / Service
ALA Scientific Instruments Inc. - Key offerings
SWOT

15.6 Bridge to Life Ltd.

Bridge to Life Ltd. - Overview
Bridge to Life Ltd. - Product / Service
Bridge to Life Ltd. - Key offerings
SWOT

15.7 emka TECHNOLOGIES

emka TECHNOLOGIES - Overview
emka TECHNOLOGIES - Product / Service
emka TECHNOLOGIES - Key offerings
SWOT

15.8 Hugo Sachs Elektronik GmbH

Hugo Sachs Elektronik GmbH - Overview
Hugo Sachs Elektronik GmbH - Product / Service
Hugo Sachs Elektronik GmbH - Key offerings
SWOT

15.9 MDE GmbH

MDE GmbH - Overview
MDE GmbH - Product / Service
MDE GmbH - Key offerings
SWOT

15.10 OrganOx Ltd.

OrganOx Ltd. - Overview
OrganOx Ltd. - Product / Service
OrganOx Ltd. - Key offerings
SWOT

15.11 TransMedics Inc.

TransMedics Inc. - Overview
TransMedics Inc. - Product / Service
TransMedics Inc. - Key offerings
SWOT

15.12 World Precision Instruments

World Precision Instruments - Overview
World Precision Instruments - Product / Service
World Precision Instruments - Key offerings
SWOT

16. Appendix

16.1 Scope of the report

Market definition
Objectives
Notes and caveats

16.2 Inclusions and exclusions checklist

Inclusions checklist
Exclusions checklist

16.3 Currency conversion rates for US$

16.4 Research methodology

16.5 Data procurement

Information sources

16.6 Data validation

16.7 Validation techniques employed for market sizing

16.8 Data synthesis

16.9 360 degree market analysis

16.10 List of abbreviations

Research Methodology

Technavio presents a detailed picture of the market by way of study, synthesis, and summation of data from multiple sources. The analysts have presented the various facets of the market with a particular focus on identifying the key industry influencers. The data thus presented is comprehensive, reliable, and the result of extensive research, both primary and secondary.

INFORMATION SOURCES

Primary sources

  • Manufacturers and suppliers
  • Channel partners
  • Industry experts
  • Strategic decision makers

Secondary sources

  • Industry journals and periodicals
  • Government data
  • Financial reports of key industry players
  • Historical data
  • Press releases

DATA ANALYSIS

Data Synthesis

  • Collation of data
  • Estimation of key figures
  • Analysis of derived insights

Data Validation

  • Triangulation with data models
  • Reference against proprietary databases
  • Corroboration with industry experts

REPORT WRITING

Qualitative

  • Market drivers
  • Market challenges
  • Market trends
  • Five forces analysis

Quantitative

  • Market size and forecast
  • Market segmentation
  • Geographical insights
  • Competitive landscape

Interested in this report?

Get your sample now to see our research methodology and insights!

Download Now

Frequently Asked Questions

Preclinical Isolated Organ Perfusion System market growth will increase by USD 177.1 million during 2026-2030.

The Preclinical Isolated Organ Perfusion System market is expected to grow at a CAGR of 5.1% during 2026-2030.

Preclinical Isolated Organ Perfusion System market is segmented by Type (Hardware, Software and services) Product (Isolated heart perfusion systems, Isolated abdominal organ perfusion systems, Isolated lung perfusion systems, Others) End-user (Pharmaceutical and biotechnology companies, Contract research organizations (CROs), Academic and government research institutes, Hospitals and transplant centers, Preclinical research laboratories)

ADInstruments Pty Ltd., ALA Scientific Instruments Inc., Bridge to Life Ltd., emka TECHNOLOGIES, Hugo Sachs Elektronik GmbH, MDE GmbH, OrganOx Ltd., TransMedics Inc., World Precision Instruments are a few of the key vendors in the Preclinical Isolated Organ Perfusion System market.

North America will register the highest growth rate of 40.3% among the other regions. Therefore, the Preclinical Isolated Organ Perfusion System market in North America is expected to garner significant business opportunities for the vendors during the forecast period.

US, Canada, Mexico, Germany, UK, France, Italy, Spain, The Netherlands, China, Japan, India, South Korea, Thailand, Indonesia, Saudi Arabia, Brazil, Australia, UAE, South Africa, Israel, Turkey, Colombia

  • Increasing complexity in drug discovery and shift toward ex vivo validation is the driving factor this market.

The Preclinical Isolated Organ Perfusion System market vendors should focus on grabbing business opportunities from the Type segment as it accounted for the largest market share in the base year.
RIA - Research AI Assistant
Ask RIA