Pressure Infusion Bags Market Analysis, Size, and Forecast 2026-2030: North America (US, Canada, and Mexico), APAC (China, India, and Japan), Europe (Germany, UK, and France), South America (Brazil, Argentina, and Colombia), Middle East and Africa (Saudi Arabia, UAE, and Turkey), Asia, Rest of World (ROW)

Pressure Infusion Bags Market Analysis, Size, and Forecast 2026-2030:
North America (US, Canada, and Mexico), APAC (China, India, and Japan), Europe (Germany, UK, and France), South America (Brazil, Argentina, and Colombia), Middle East and Africa (Saudi Arabia, UAE, and Turkey), Asia, Rest of World (ROW)

Published: Mar 2026 285 Pages SKU: IRTNTR71599

Market Overview at a Glance

$4.10 B
Market Opportunity
7.2%
CAGR 2025 - 2030
39%
Asia Growth
$8.69 B
Disposable segment 2024

Pressure Infusion Bags Market Size 2026-2030

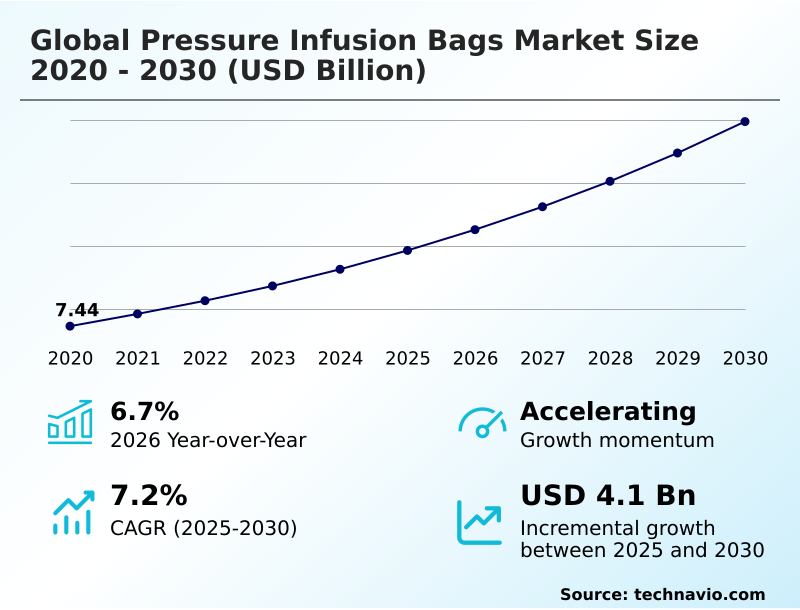
The pressure infusion bags market size is valued to increase by USD 4.10 billion, at a CAGR of 7.2% from 2025 to 2030. Escalation of surgical volumes and emergency trauma interventions will drive the pressure infusion bags market.

Major Market Trends & Insights

  • Asia dominated the market and accounted for a 39% growth during the forecast period.
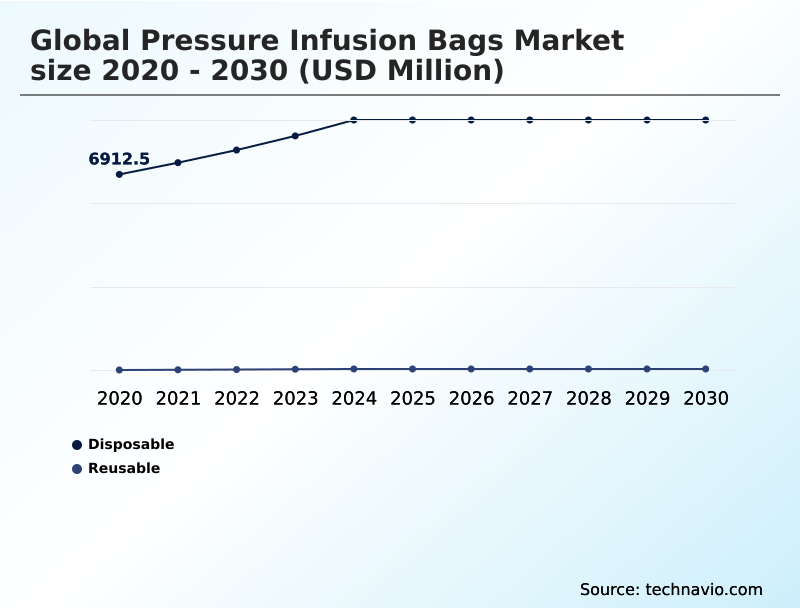
  • By Type - Disposable segment was valued at USD 8.69 billion in 2024
  • By Material - Nylon segment accounted for the largest market revenue share in 2024

Market Size & Forecast

  • Market Opportunities: USD 6.51 billion
  • Market Future Opportunities: USD 4.10 billion
  • CAGR from 2025 to 2030 : 7.2%

Market Summary

  • The pressure infusion bags market is defined by its critical role in emergency and perioperative care, where devices enabling rapid fluid resuscitation are essential. Growth is propelled by increasing surgical volumes and the need for hemodynamic stability in high-acuity settings.
  • A significant trend is the institutionalization of single-use medical devices and smart infusion systems to enhance infection control protocols and provide automated pressure monitoring. For instance, a hospital system implementing IoT-enabled sensors and rfid-enabled tracking can achieve better digital traceability and inventory management, optimizing the supply of disposable pressure infusion bags and cuffs for trauma resuscitation.
  • However, the industry faces challenges from supply chain fragility for biocompatible polymers like medical-grade nylon and polyurethane resins, alongside the complexities of regulatory compliance management. The evolution toward connected infusion systems and data-driven fluid delivery is reshaping the landscape, pushing for greater technical interoperability and integration with electronic health records.

What will be the Size of the Pressure Infusion Bags Market during the forecast period?

Get Key Insights on Market Forecast (PDF) Request Free Sample

How is the Pressure Infusion Bags Market Segmented?

The pressure infusion bags industry research report provides comprehensive data (region-wise segment analysis), with forecasts and estimates in "USD million" for the period 2026-2030, as well as historical data from 2020-2024 for the following segments.

  • Type
    • Disposable
    • Reusable
  • Material
    • Nylon
    • Polyurethane
    • Latex
    • Others
  • End-user
    • Hospitals
    • Clinics
    • Others
  • Geography
    • North America
      • US
      • Canada
      • Mexico
    • Asia
    • Europe
      • Germany
      • UK
      • France
    • Rest of World (ROW)

By Type Insights

The disposable segment is estimated to witness significant growth during the forecast period.

The disposable segment is crucial for rapid fluid administration, shaped by a focus on mitigating cross-contamination and strict infection control protocols. These single-use medical devices, made from materials like medical-grade nylon, are discarded after one use to prevent hospital-acquired infections.

In high-turnover settings like ambulatory surgical centers, disposable systems support immediate deployment without sterilization overhead, a shift underscored by a thirty-seven percent funding increase for trauma care modernization in some regions.

This transition favors ready-to-use, sterile solutions featuring pvc-free polymers that streamline clinical workflow optimization.

The institutionalization of these systems, including pressure infusion cuffs and bags, reflects a move toward enhanced safety and efficiency in both emergency medicine applications and routine intravenous fluid delivery.

Request Free Sample

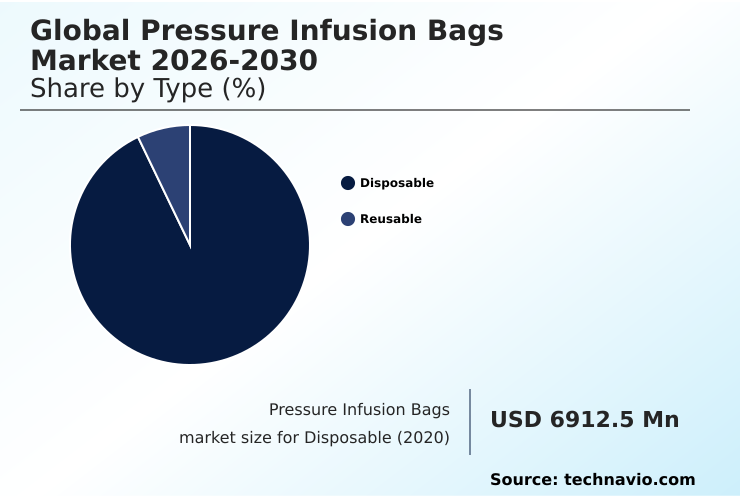
The Disposable segment was valued at USD 8.69 billion in 2024 and showed a gradual increase during the forecast period.

Request Free Sample

Regional Analysis

Asia is estimated to contribute 39% to the growth of the global market during the forecast period.Technavio’s analysts have elaborately explained the regional trends and drivers that shape the market during the forecast period.

See How Pressure Infusion Bags Market Demand is Rising in Asia Request Free Sample

The global landscape is diverse, with North America focusing on high-tech, smart infusion systems and data-driven fluid delivery.

The region's growth is steady, while Asia is set to contribute 39% of the market's incremental growth, driven by infrastructure development and rising healthcare standards that demand better emergency medicine applications.

Europe, with a more mature market, shows moderate growth but leads in adopting sustainable, pvc-free polymers and circular economy principles. This geographic variance creates a complex environment where a one-size-fits-all strategy is ineffective.

Providers must navigate different regulatory frameworks and demands, from North America's focus on technical interoperability to Asia’s volume-driven needs for both disposable pressure infusion bags and reusable systems.

Market Dynamics

Our researchers analyzed the data with 2025 as the base year, along with the key drivers, trends, and challenges. A holistic analysis of drivers will help companies refine their marketing strategies to gain a competitive advantage.

  • Strategic decision-making in the market is increasingly complex, influenced by competing priorities of cost, safety, and technological advancement. Understanding disposable pressure infusion bag benefits is crucial for hospitals aiming to improve infection control, while others analyze reusable pressure infusion cuff sterilization for long-term cost savings.
  • The debate over nylon vs polyurethane infusion bags continues, with material science dictating performance in trauma care. Smart pressure infusion system advantages, particularly the integration of IoT sensors in infusion therapy, are becoming a key differentiator. These systems are vital for preventing air embolism with pressure bags.
  • The focus on infection control with single-use infusers is a major driver, especially for pressure bags for rapid blood transfusion. Clinics weigh the cost-effectiveness of disposable infusion systems against capital investments. Automating fluid delivery in ICUs is a primary goal, pushing manufacturers to navigate stringent regulatory standards for infusion devices.
  • Concurrently, supply chain challenges for medical polymers and the need for integrating infusion data with EHRs are significant hurdles. As the market expands to include pressure infusion bags for home care and biodegradable materials for medical bags, choosing pressure bags for ambulatory centers requires careful evaluation of advances in real-time infusion analytics and best practices for pressure bag usage.
  • The growth contribution from developing regions is over twice that of established markets, highlighting a significant shift in resource allocation.

What are the key market drivers leading to the rise in the adoption of Pressure Infusion Bags Industry?

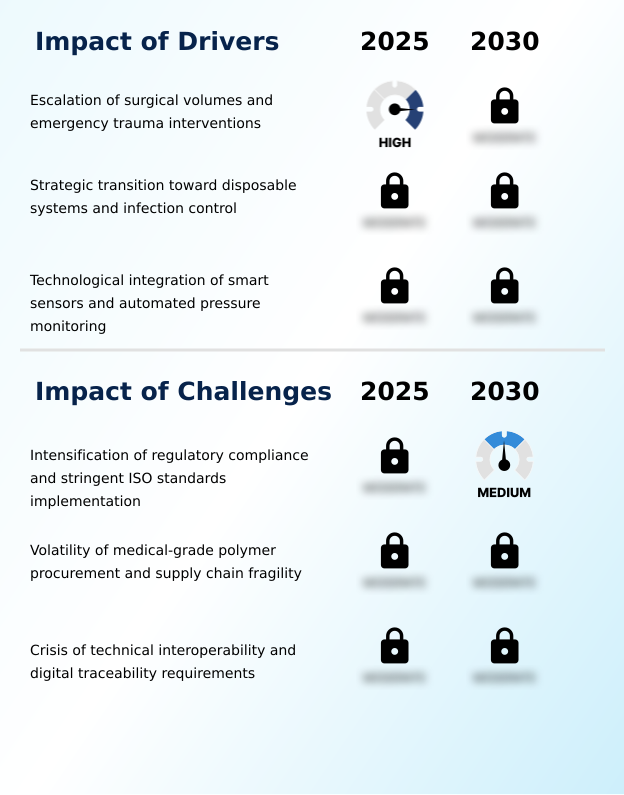
  • The escalation of surgical volumes and a rising number of emergency trauma interventions are key drivers for the market.

  • The market is propelled by the need for rapid fluid resuscitation and enhanced hemodynamic stability in critical care. Escalating surgical volumes and trauma interventions necessitate effective blood product administration and intravenous fluid delivery.
  • This demand is particularly acute in emergency medicine applications and perioperative care, where controlled flow rate is vital. The strategic transition to single-use medical devices, driven by stringent infection control protocols, further fuels growth.
  • A significant funding increase of 37% for trauma services in some emerging economies highlights the global push to modernize care.
  • Moreover, with nearly one-fourth of the population in some developed nations projected to be over 60, the demand for procedures requiring such devices is set to rise.

What are the market trends shaping the Pressure Infusion Bags Industry?

  • The inclusion of IoT-enabled smart monitoring is an emerging market trend, coupled with the deployment of real-time infusion analytics for enhanced clinical oversight.

  • A primary trend is the move toward connected infusion systems and telemetry-capable equipment, enabling real-time infusion analytics. This data-driven fluid delivery approach enhances patient safety and supports clinical workflow optimization in settings like smart ward technologies. The adoption of high-performance polyolefin blends and other pvc-free iv bags aligns with sustainability goals and stringent regulations.
  • This shift has improved biocompatibility in infusion solutions. As a result of these technological and material advancements, some facilities report enhanced tracking capabilities and a notable reduction in medication errors, contributing to better overall patient outcomes and operational efficiencies in surgical theater devices and intensive care unit equipment.

What challenges does the Pressure Infusion Bags Industry face during its growth?

  • The intensification of regulatory compliance requirements and the stringent implementation of ISO standards present a key challenge to industry growth.

  • The market faces significant hurdles from supply chain fragility and regulatory compliance management. The volatility in procuring specialized polyurethane resins and reinforced nylon construction materials has led to lead times increasing by over 20%, disrupting production. This instability directly impacts the availability of both disposable and reusable pressure infusion systems.
  • Furthermore, achieving technical interoperability and digital traceability for smart infusion systems presents a major challenge, hindering seamless electronic health record integration. The economic landscape, marked by growth contracting to 2.6% in 2024, tightens healthcare budgets, intensifying price pressures and affecting investment in new technologies like automated fluid management and advanced home healthcare infusion solutions.

Exclusive Technavio Analysis on Customer Landscape

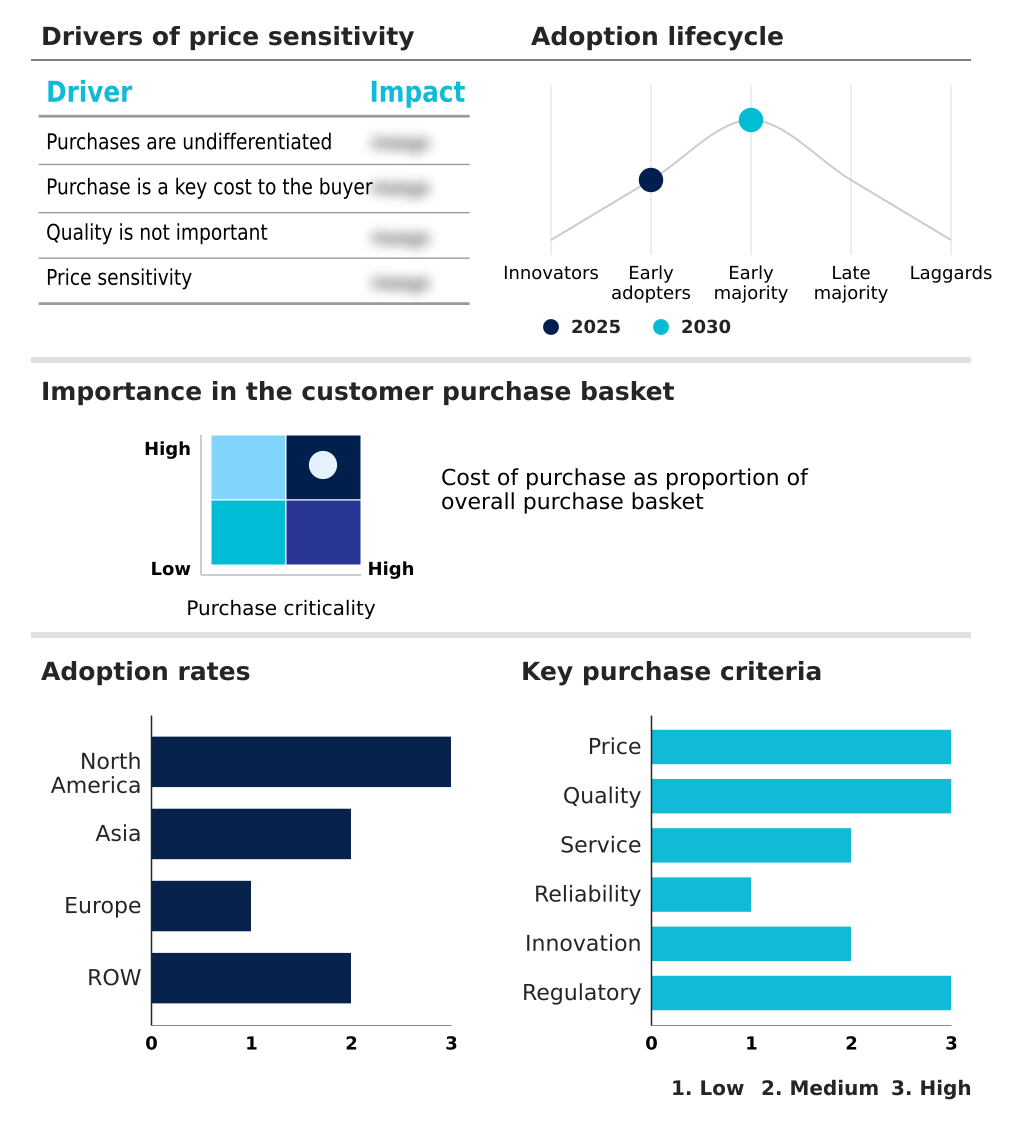
The pressure infusion bags market forecasting report includes the adoption lifecycle of the market, covering from the innovator’s stage to the laggard’s stage. It focuses on adoption rates in different regions based on penetration. Furthermore, the pressure infusion bags market report also includes key purchase criteria and drivers of price sensitivity to help companies evaluate and develop their market growth analysis strategies.

Customer Landscape of Pressure Infusion Bags Industry

Competitive Landscape

Companies are implementing various strategies, such as strategic alliances, pressure infusion bags market forecast, partnerships, mergers and acquisitions, geographical expansion, and product/service launches, to enhance their presence in the industry.

ASP Global LLC - Provides disposable and reusable pressure infusion systems, enabling rapid fluid administration for critical care applications and enhancing patient safety through controlled delivery.

The industry research and growth report includes detailed analyses of the competitive landscape of the market and information about key companies, including:

  • ASP Global LLC
  • B.Braun SE
  • Baxter International Inc.
  • Bosch Sohn GmbH u. Co. KG
  • Cardinal Health Inc.
  • Demax Medical Technology Co.
  • DeRoyal Industries Inc.
  • Friedrich Bosch GmbH and Co. KG
  • ICU Medical Inc.
  • Jorgensen Laboratories Inc.
  • Medline Inc.
  • Mercury Medical
  • Metko Medical
  • NovaMed USA
  • Poly Medicure Ltd.
  • Premier Inc.
  • Romsons Group
  • Rudolf Riester GmbH
  • SunMed LLC
  • Teleflex Inc.

Qualitative and quantitative analysis of companies has been conducted to help clients understand the wider business environment as well as the strengths and weaknesses of key industry players. Data is qualitatively analyzed to categorize companies as pure play, category-focused, industry-focused, and diversified; it is quantitatively analyzed to categorize companies as dominant, leading, strong, tentative, and weak.

Recent Development and News in Pressure infusion bags market

  • In February 2025, OSAA Innovation highlighted that its latest mechanical infusion pump innovations are strictly composed of non-latex components to support mobile, pole-free care without compromising safety for allergic individuals.
  • In March 2025, CareFusion Technologies launched its next-generation smart pressure infusion system, which utilizes IoT-enabled sensors and artificial intelligence-based algorithms to provide clinicians with automated alerts regarding pressure dynamics.
  • In May 2025, Intuitive Surgical received updated regulatory clearance for its advanced surgical systems in the United States, a development that signifies the broader regional trend toward minimally invasive procedures which often require precise fluid management.
  • In February 2026, the United States Food and Drug Administration finalized the transition of its Quality System Regulation to the Quality Management System Regulation (QMSR), aligning domestic requirements with the international ISO 13485:2016 standard.

Dive into Technavio’s robust research methodology, blending expert interviews, extensive data synthesis, and validated models for unparalleled Pressure Infusion Bags Market insights. See full methodology.

Market Scope
Page number 285
Base year 2025
Historic period 2020-2024
Forecast period 2026-2030
Growth momentum & CAGR Accelerate at a CAGR of 7.2%
Market growth 2026-2030 USD 4103.6 million
Market structure Fragmented
YoY growth 2025-2026(%) 6.7%
Key countries US, Canada, Mexico, China, India, Japan, South Korea, Thailand, Indonesia, Germany, UK, France, Italy, Spain, The Netherlands, Brazil, Saudi Arabia, UAE, Turkey, South Africa, Israel, Argentina and Colombia
Competitive landscape Leading Companies, Market Positioning of Companies, Competitive Strategies, and Industry Risks

Request Free Sample

Research Analyst Overview

  • The pressure infusion bags market is advancing beyond simple mechanical devices, driven by demands for enhanced safety and efficiency in critical care. The core of this evolution lies in the material science of biocompatible polymers and high-tensile materials, such as medical-grade nylon and polyurethane resins, which are essential for creating durable, puncture-resistant films.
  • A key focus is on integrated pressure gauges and over-inflation relief valves to ensure patient safety during rapid fluid resuscitation and blood product administration. The shift toward single-use medical devices is accelerating to meet stringent infection control protocols and mitigate cross-contamination, especially in ambulatory surgical centers.
  • Simultaneously, the development of smart infusion systems with IoT-enabled sensors and automated pressure monitoring is transforming perioperative care. These systems, featuring rfid-enabled tracking, are crucial for achieving digital traceability and electronic health record integration.
  • However, this progress is constrained by supply chain issues, with lead times for key components increasing by over 20%, impacting the availability of both disposable pressure infusion bags and reusable pressure infusion systems. The market is also adapting to home infusion therapies and the need for invasive pressure monitoring solutions, reflecting a broader trend toward decentralized care.

What are the Key Data Covered in this Pressure Infusion Bags Market Research and Growth Report?

  • What is the expected growth of the Pressure Infusion Bags Market between 2026 and 2030?

    • USD 4.10 billion, at a CAGR of 7.2%

  • What segmentation does the market report cover?

    • The report is segmented by Type (Disposable, and Reusable), Material (Nylon, Polyurethane, Latex, and Others), End-user (Hospitals, Clinics, and Others) and Geography (North America, Asia, Europe, Rest of World (ROW))

  • Which regions are analyzed in the report?

    • North America, Asia, Europe and Rest of World (ROW)

  • What are the key growth drivers and market challenges?

    • Escalation of surgical volumes and emergency trauma interventions, Intensification of regulatory compliance and stringent ISO standards implementation

  • Who are the major players in the Pressure Infusion Bags Market?

    • ASP Global LLC, B.Braun SE, Baxter International Inc., Bosch Sohn GmbH u. Co. KG, Cardinal Health Inc., Demax Medical Technology Co., DeRoyal Industries Inc., Friedrich Bosch GmbH and Co. KG, ICU Medical Inc., Jorgensen Laboratories Inc., Medline Inc., Mercury Medical, Metko Medical, NovaMed USA, Poly Medicure Ltd., Premier Inc., Romsons Group, Rudolf Riester GmbH, SunMed LLC and Teleflex Inc.

Market Research Insights

  • The market is influenced by a dynamic interplay of efficiency and safety imperatives. Healthcare providers prioritize clinical workflow optimization, leading to higher adoption of systems that improve outcomes. For example, the move toward disposable systems aims to reduce hospital-acquired infection rates, while the integration of smart technologies is improving precision.
  • This drive for advancement is tempered by economic realities; supply chain fragility for key components has increased lead times by over 20%, impacting operational planning.
  • Concurrently, government initiatives, such as a 37% increase in funding for trauma services in some developing nations, create new avenues for growth and modernization, accelerating the adoption of advanced solutions for data-driven fluid delivery and real-time infusion analytics.

We can help! Our analysts can customize this pressure infusion bags market research report to meet your requirements.

Get in touch

1. Executive Summary

1.1 Market overview

Executive Summary - Chart on Market Overview
Executive Summary - Data Table on Market Overview
Executive Summary - Chart on Global Market Characteristics
Executive Summary - Chart on Market by Geography
Executive Summary - Chart on Market Segmentation by Type
Executive Summary - Chart on Market Segmentation by Material
Executive Summary - Chart on Market Segmentation by End-user
Executive Summary - Chart on Incremental Growth
Executive Summary - Data Table on Incremental Growth
Executive Summary - Chart on Company Market Positioning

2. Technavio Analysis

2.1 Analysis of price sensitivity, lifecycle, customer purchase basket, adoption rates, and purchase criteria

2.2 Criticality of inputs and Factors of differentiation

Chart on Overview on criticality of inputs and factors of differentiation

2.3 Factors of disruption

Chart on Overview on factors of disruption

2.4 Impact of drivers and challenges

Chart on Impact of drivers and challenges in 2025 and 2030

3. Market Landscape

3.1 Market ecosystem

Chart on Parent Market
Data Table on - Parent Market

3.2 Market characteristics

Chart on Market characteristics analysis

3.3 Value chain analysis

Chart on Value chain analysis

4. Market Sizing

4.1 Market definition

Data Table on Offerings of companies included in the market definition

4.2 Market segment analysis

Market segments

4.3 Market size 2025

4.4 Market outlook: Forecast for 2025-2030

Chart on Global - Market size and forecast 2025-2030 ($ million)
Data Table on Global - Market size and forecast 2025-2030 ($ million)
Chart on Global Market: Year-over-year growth 2025-2030 (%)
Data Table on Global Market: Year-over-year growth 2025-2030 (%)

5. Historic Market Size

5.1 Global Pressure Infusion Bags Market 2020 - 2024

Historic Market Size - Data Table on Global Pressure Infusion Bags Market 2020 - 2024 ($ million)

5.2 Type segment analysis 2020 - 2024

Historic Market Size - Type Segment 2020 - 2024 ($ million)

5.3 Material segment analysis 2020 - 2024

Historic Market Size - Material Segment 2020 - 2024 ($ million)

5.4 End-user segment analysis 2020 - 2024

Historic Market Size - End-user Segment 2020 - 2024 ($ million)

5.5 Geography segment analysis 2020 - 2024

Historic Market Size - Geography Segment 2020 - 2024 ($ million)

5.6 Country segment analysis 2020 - 2024

Historic Market Size - Country Segment 2020 - 2024 ($ million)

6. Qualitative Analysis

6.1 Impact of AI in global pressure infusion bags market

6.2 Impact of geopolitical conflict for global pressure infusion bags market

7. Five Forces Analysis

7.1 Five forces summary

Five forces analysis - Comparison between 2025 and 2030

7.2 Bargaining power of buyers

Bargaining power of buyers - Impact of key factors 2025 and 2030

7.3 Bargaining power of suppliers

Bargaining power of suppliers - Impact of key factors in 2025 and 2030

7.4 Threat of new entrants

Threat of new entrants - Impact of key factors in 2025 and 2030

7.5 Threat of substitutes

Threat of substitutes - Impact of key factors in 2025 and 2030

7.6 Threat of rivalry

Threat of rivalry - Impact of key factors in 2025 and 2030

7.7 Market condition

Chart on Market condition - Five forces 2025 and 2030

8. Market Segmentation by Type

8.1 Market segments

Chart on Type - Market share 2025-2030 (%)
Data Table on Type - Market share 2025-2030 (%)

8.2 Comparison by Type

Chart on Comparison by Type
Data Table on Comparison by Type

8.3 Disposable - Market size and forecast 2025-2030

Chart on Disposable - Market size and forecast 2025-2030 ($ million)
Data Table on Disposable - Market size and forecast 2025-2030 ($ million)
Chart on Disposable - Year-over-year growth 2025-2030 (%)
Data Table on Disposable - Year-over-year growth 2025-2030 (%)

8.4 Reusable - Market size and forecast 2025-2030

Chart on Reusable - Market size and forecast 2025-2030 ($ million)
Data Table on Reusable - Market size and forecast 2025-2030 ($ million)
Chart on Reusable - Year-over-year growth 2025-2030 (%)
Data Table on Reusable - Year-over-year growth 2025-2030 (%)

8.5 Market opportunity by Type

Market opportunity by Type ($ million)
Data Table on Market opportunity by Type ($ million)

9. Market Segmentation by Material

9.1 Market segments

Chart on Material - Market share 2025-2030 (%)
Data Table on Material - Market share 2025-2030 (%)

9.2 Comparison by Material

Chart on Comparison by Material
Data Table on Comparison by Material

9.3 Nylon - Market size and forecast 2025-2030

Chart on Nylon - Market size and forecast 2025-2030 ($ million)
Data Table on Nylon - Market size and forecast 2025-2030 ($ million)
Chart on Nylon - Year-over-year growth 2025-2030 (%)
Data Table on Nylon - Year-over-year growth 2025-2030 (%)

9.4 Polyurethane - Market size and forecast 2025-2030

Chart on Polyurethane - Market size and forecast 2025-2030 ($ million)
Data Table on Polyurethane - Market size and forecast 2025-2030 ($ million)
Chart on Polyurethane - Year-over-year growth 2025-2030 (%)
Data Table on Polyurethane - Year-over-year growth 2025-2030 (%)

9.5 Latex - Market size and forecast 2025-2030

Chart on Latex - Market size and forecast 2025-2030 ($ million)
Data Table on Latex - Market size and forecast 2025-2030 ($ million)
Chart on Latex - Year-over-year growth 2025-2030 (%)
Data Table on Latex - Year-over-year growth 2025-2030 (%)

9.6 Others - Market size and forecast 2025-2030

Chart on Others - Market size and forecast 2025-2030 ($ million)
Data Table on Others - Market size and forecast 2025-2030 ($ million)
Chart on Others - Year-over-year growth 2025-2030 (%)
Data Table on Others - Year-over-year growth 2025-2030 (%)

9.7 Market opportunity by Material

Market opportunity by Material ($ million)
Data Table on Market opportunity by Material ($ million)

10. Market Segmentation by End-user

10.1 Market segments

Chart on End-user - Market share 2025-2030 (%)
Data Table on End-user - Market share 2025-2030 (%)

10.2 Comparison by End-user

Chart on Comparison by End-user
Data Table on Comparison by End-user

10.3 Hospitals - Market size and forecast 2025-2030

Chart on Hospitals - Market size and forecast 2025-2030 ($ million)
Data Table on Hospitals - Market size and forecast 2025-2030 ($ million)
Chart on Hospitals - Year-over-year growth 2025-2030 (%)
Data Table on Hospitals - Year-over-year growth 2025-2030 (%)

10.4 Clinics - Market size and forecast 2025-2030

Chart on Clinics - Market size and forecast 2025-2030 ($ million)
Data Table on Clinics - Market size and forecast 2025-2030 ($ million)
Chart on Clinics - Year-over-year growth 2025-2030 (%)
Data Table on Clinics - Year-over-year growth 2025-2030 (%)

10.5 Others - Market size and forecast 2025-2030

Chart on Others - Market size and forecast 2025-2030 ($ million)
Data Table on Others - Market size and forecast 2025-2030 ($ million)
Chart on Others - Year-over-year growth 2025-2030 (%)
Data Table on Others - Year-over-year growth 2025-2030 (%)

10.6 Market opportunity by End-user

Market opportunity by End-user ($ million)
Data Table on Market opportunity by End-user ($ million)

11. Customer Landscape

11.1 Customer landscape overview

Analysis of price sensitivity, lifecycle, customer purchase basket, adoption rates, and purchase criteria

12. Geographic Landscape

12.1 Geographic segmentation

Chart on Market share by geography 2025-2030 (%)
Data Table on Market share by geography 2025-2030 (%)

12.2 Geographic comparison

Chart on Geographic comparison
Data Table on Geographic comparison

12.3 North America - Market size and forecast 2025-2030

Chart on North America - Market size and forecast 2025-2030 ($ million)
Data Table on North America - Market size and forecast 2025-2030 ($ million)
Chart on North America - Year-over-year growth 2025-2030 (%)
Data Table on North America - Year-over-year growth 2025-2030 (%)
Chart on Regional Comparison - North America
Data Table on Regional Comparison - North America

12.3.1 US - Market size and forecast 2025-2030

Chart on US - Market size and forecast 2025-2030 ($ million)
Data Table on US - Market size and forecast 2025-2030 ($ million)
Chart on US - Year-over-year growth 2025-2030 (%)
Data Table on US - Year-over-year growth 2025-2030 (%)

12.3.2 Canada - Market size and forecast 2025-2030

Chart on Canada - Market size and forecast 2025-2030 ($ million)
Data Table on Canada - Market size and forecast 2025-2030 ($ million)
Chart on Canada - Year-over-year growth 2025-2030 (%)
Data Table on Canada - Year-over-year growth 2025-2030 (%)

12.3.3 Mexico - Market size and forecast 2025-2030

Chart on Mexico - Market size and forecast 2025-2030 ($ million)
Data Table on Mexico - Market size and forecast 2025-2030 ($ million)
Chart on Mexico - Year-over-year growth 2025-2030 (%)
Data Table on Mexico - Year-over-year growth 2025-2030 (%)

12.4 Asia - Market size and forecast 2025-2030

Chart on Asia - Market size and forecast 2025-2030 ($ million)
Data Table on Asia - Market size and forecast 2025-2030 ($ million)
Chart on Asia - Year-over-year growth 2025-2030 (%)
Data Table on Asia - Year-over-year growth 2025-2030 (%)
Chart on Regional Comparison - Asia
Data Table on Regional Comparison - Asia

12.4.1 China - Market size and forecast 2025-2030

Chart on China - Market size and forecast 2025-2030 ($ million)
Data Table on China - Market size and forecast 2025-2030 ($ million)
Chart on China - Year-over-year growth 2025-2030 (%)
Data Table on China - Year-over-year growth 2025-2030 (%)

12.4.2 India - Market size and forecast 2025-2030

Chart on India - Market size and forecast 2025-2030 ($ million)
Data Table on India - Market size and forecast 2025-2030 ($ million)
Chart on India - Year-over-year growth 2025-2030 (%)
Data Table on India - Year-over-year growth 2025-2030 (%)

12.4.3 Japan - Market size and forecast 2025-2030

Chart on Japan - Market size and forecast 2025-2030 ($ million)
Data Table on Japan - Market size and forecast 2025-2030 ($ million)
Chart on Japan - Year-over-year growth 2025-2030 (%)
Data Table on Japan - Year-over-year growth 2025-2030 (%)

12.4.4 South Korea - Market size and forecast 2025-2030

Chart on South Korea - Market size and forecast 2025-2030 ($ million)
Data Table on South Korea - Market size and forecast 2025-2030 ($ million)
Chart on South Korea - Year-over-year growth 2025-2030 (%)
Data Table on South Korea - Year-over-year growth 2025-2030 (%)

12.4.5 Thailand - Market size and forecast 2025-2030

Chart on Thailand - Market size and forecast 2025-2030 ($ million)
Data Table on Thailand - Market size and forecast 2025-2030 ($ million)
Chart on Thailand - Year-over-year growth 2025-2030 (%)
Data Table on Thailand - Year-over-year growth 2025-2030 (%)

12.4.6 Indonesia - Market size and forecast 2025-2030

Chart on Indonesia - Market size and forecast 2025-2030 ($ million)
Data Table on Indonesia - Market size and forecast 2025-2030 ($ million)
Chart on Indonesia - Year-over-year growth 2025-2030 (%)
Data Table on Indonesia - Year-over-year growth 2025-2030 (%)

12.5 Europe - Market size and forecast 2025-2030

Chart on Europe - Market size and forecast 2025-2030 ($ million)
Data Table on Europe - Market size and forecast 2025-2030 ($ million)
Chart on Europe - Year-over-year growth 2025-2030 (%)
Data Table on Europe - Year-over-year growth 2025-2030 (%)
Chart on Regional Comparison - Europe
Data Table on Regional Comparison - Europe

12.5.1 Germany - Market size and forecast 2025-2030

Chart on Germany - Market size and forecast 2025-2030 ($ million)
Data Table on Germany - Market size and forecast 2025-2030 ($ million)
Chart on Germany - Year-over-year growth 2025-2030 (%)
Data Table on Germany - Year-over-year growth 2025-2030 (%)

12.5.2 UK - Market size and forecast 2025-2030

Chart on UK - Market size and forecast 2025-2030 ($ million)
Data Table on UK - Market size and forecast 2025-2030 ($ million)
Chart on UK - Year-over-year growth 2025-2030 (%)
Data Table on UK - Year-over-year growth 2025-2030 (%)

12.5.3 France - Market size and forecast 2025-2030

Chart on France - Market size and forecast 2025-2030 ($ million)
Data Table on France - Market size and forecast 2025-2030 ($ million)
Chart on France - Year-over-year growth 2025-2030 (%)
Data Table on France - Year-over-year growth 2025-2030 (%)

12.5.4 Italy - Market size and forecast 2025-2030

Chart on Italy - Market size and forecast 2025-2030 ($ million)
Data Table on Italy - Market size and forecast 2025-2030 ($ million)
Chart on Italy - Year-over-year growth 2025-2030 (%)
Data Table on Italy - Year-over-year growth 2025-2030 (%)

12.5.5 Spain - Market size and forecast 2025-2030

Chart on Spain - Market size and forecast 2025-2030 ($ million)
Data Table on Spain - Market size and forecast 2025-2030 ($ million)
Chart on Spain - Year-over-year growth 2025-2030 (%)
Data Table on Spain - Year-over-year growth 2025-2030 (%)

12.5.6 The Netherlands - Market size and forecast 2025-2030

Chart on The Netherlands - Market size and forecast 2025-2030 ($ million)
Data Table on The Netherlands - Market size and forecast 2025-2030 ($ million)
Chart on The Netherlands - Year-over-year growth 2025-2030 (%)
Data Table on The Netherlands - Year-over-year growth 2025-2030 (%)

12.6 Rest of World (ROW) - Market size and forecast 2025-2030

Chart on Rest of World (ROW) - Market size and forecast 2025-2030 ($ million)
Data Table on Rest of World (ROW) - Market size and forecast 2025-2030 ($ million)
Chart on Rest of World (ROW) - Year-over-year growth 2025-2030 (%)
Data Table on Rest of World (ROW) - Year-over-year growth 2025-2030 (%)
Chart on Regional Comparison - Rest of World (ROW)
Data Table on Regional Comparison - Rest of World (ROW)

12.6.1 Brazil - Market size and forecast 2025-2030

Chart on Brazil - Market size and forecast 2025-2030 ($ million)
Data Table on Brazil - Market size and forecast 2025-2030 ($ million)
Chart on Brazil - Year-over-year growth 2025-2030 (%)
Data Table on Brazil - Year-over-year growth 2025-2030 (%)

12.6.2 Saudi Arabia - Market size and forecast 2025-2030

Chart on Saudi Arabia - Market size and forecast 2025-2030 ($ million)
Data Table on Saudi Arabia - Market size and forecast 2025-2030 ($ million)
Chart on Saudi Arabia - Year-over-year growth 2025-2030 (%)
Data Table on Saudi Arabia - Year-over-year growth 2025-2030 (%)

12.6.3 UAE - Market size and forecast 2025-2030

Chart on UAE - Market size and forecast 2025-2030 ($ million)
Data Table on UAE - Market size and forecast 2025-2030 ($ million)
Chart on UAE - Year-over-year growth 2025-2030 (%)
Data Table on UAE - Year-over-year growth 2025-2030 (%)

12.6.4 Turkey - Market size and forecast 2025-2030

Chart on Turkey - Market size and forecast 2025-2030 ($ million)
Data Table on Turkey - Market size and forecast 2025-2030 ($ million)
Chart on Turkey - Year-over-year growth 2025-2030 (%)
Data Table on Turkey - Year-over-year growth 2025-2030 (%)

12.6.5 South Africa - Market size and forecast 2025-2030

Chart on South Africa - Market size and forecast 2025-2030 ($ million)
Data Table on South Africa - Market size and forecast 2025-2030 ($ million)
Chart on South Africa - Year-over-year growth 2025-2030 (%)
Data Table on South Africa - Year-over-year growth 2025-2030 (%)

12.6.6 Israel - Market size and forecast 2025-2030

Chart on Israel - Market size and forecast 2025-2030 ($ million)
Data Table on Israel - Market size and forecast 2025-2030 ($ million)
Chart on Israel - Year-over-year growth 2025-2030 (%)
Data Table on Israel - Year-over-year growth 2025-2030 (%)

12.6.7 Argentina - Market size and forecast 2025-2030

Chart on Argentina - Market size and forecast 2025-2030 ($ million)
Data Table on Argentina - Market size and forecast 2025-2030 ($ million)
Chart on Argentina - Year-over-year growth 2025-2030 (%)
Data Table on Argentina - Year-over-year growth 2025-2030 (%)

12.6.8 Colombia - Market size and forecast 2025-2030

Chart on Colombia - Market size and forecast 2025-2030 ($ million)
Data Table on Colombia - Market size and forecast 2025-2030 ($ million)
Chart on Colombia - Year-over-year growth 2025-2030 (%)
Data Table on Colombia - Year-over-year growth 2025-2030 (%)

12.7 Market opportunity by geography

Market opportunity by geography ($ million)
Data Tables on Market opportunity by geography ($ million)

13. Drivers, Challenges, and Opportunity

13.1 Market drivers

Escalation of surgical volumes and emergency trauma interventions
Strategic transition toward disposable systems and infection control
Technological integration of smart sensors and automated pressure monitoring

13.2 Market challenges

Intensification of regulatory compliance and stringent ISO standards implementation
Volatility of medical-grade polymer procurement and supply chain fragility
Crisis of technical interoperability and digital traceability requirements

13.3 Impact of drivers and challenges

Impact of drivers and challenges in 2025 and 2030

13.4 Market opportunities

Inclusion of IoT-enabled smart monitoring and real-time infusion analytics
Growth of high-performance polyolefin blends and PVC-free material
Expansion of sustainable PVC-free materials and bio-based polymers

14. Competitive Landscape

14.1 Overview

14.2

Overview on criticality of inputs and factors of differentiation

14.3 Landscape disruption

Overview on factors of disruption

14.4 Industry risks

Impact of key risks on business

15. Competitive Analysis

15.1 Companies profiled

Companies covered

15.2 Company ranking index

15.3 Market positioning of companies

Matrix on companies position and classification

15.4 ASP Global LLC

ASP Global LLC - Overview
ASP Global LLC - Product / Service
ASP Global LLC - Key offerings
SWOT

15.5 B.Braun SE

B.Braun SE - Overview
B.Braun SE - Product / Service
B.Braun SE - Key offerings
SWOT

15.6 Baxter International Inc.

Baxter International Inc. - Overview
Baxter International Inc. - Business segments
Baxter International Inc. - Key offerings
Baxter International Inc. - Segment focus
SWOT

15.7 Bosch Sohn GmbH u. Co. KG

Bosch Sohn GmbH u. Co. KG - Overview
Bosch Sohn GmbH u. Co. KG - Product / Service
Bosch Sohn GmbH u. Co. KG - Key offerings
SWOT

15.8 Cardinal Health Inc.

Cardinal Health Inc. - Overview
Cardinal Health Inc. - Business segments
Cardinal Health Inc. - Key offerings
Cardinal Health Inc. - Segment focus
SWOT

15.9 Demax Medical Technology Co.

Demax Medical Technology Co. - Overview
Demax Medical Technology Co. - Product / Service
Demax Medical Technology Co. - Key offerings
SWOT

15.10 DeRoyal Industries Inc.

DeRoyal Industries Inc. - Overview
DeRoyal Industries Inc. - Product / Service
DeRoyal Industries Inc. - Key offerings
SWOT

15.11 Friedrich Bosch GmbH and Co. KG

Friedrich Bosch GmbH and Co. KG - Overview
Friedrich Bosch GmbH and Co. KG - Product / Service
Friedrich Bosch GmbH and Co. KG - Key offerings
SWOT

15.12 ICU Medical Inc.

ICU Medical Inc. - Overview
ICU Medical Inc. - Product / Service
ICU Medical Inc. - Key offerings
SWOT

15.13 Jorgensen Laboratories Inc.

Jorgensen Laboratories Inc. - Overview
Jorgensen Laboratories Inc. - Product / Service
Jorgensen Laboratories Inc. - Key offerings
SWOT

15.14 Medline Inc.

Medline Inc. - Overview
Medline Inc. - Product / Service
Medline Inc. - Key offerings
SWOT

15.15 Premier Inc.

Premier Inc. - Overview
Premier Inc. - Product / Service
Premier Inc. - Key offerings
SWOT

15.16 Romsons Group

Romsons Group - Overview
Romsons Group - Product / Service
Romsons Group - Key offerings
SWOT

15.17 Rudolf Riester GmbH

Rudolf Riester GmbH - Overview
Rudolf Riester GmbH - Product / Service
Rudolf Riester GmbH - Key offerings
SWOT

15.18 Teleflex Inc.

Teleflex Inc. - Overview
Teleflex Inc. - Business segments
Teleflex Inc. - Key news
Teleflex Inc. - Key offerings
Teleflex Inc. - Segment focus
SWOT

16. Appendix

16.1 Scope of the report

Market definition
Objectives
Notes and caveats

16.2 Inclusions and exclusions checklist

Inclusions checklist
Exclusions checklist

16.3 Currency conversion rates for US$

16.4 Research methodology

16.5 Data procurement

Information sources

16.6 Data validation

16.7 Validation techniques employed for market sizing

16.8 Data synthesis

16.9 360 degree market analysis

16.10 List of abbreviations

Research Methodology

Technavio presents a detailed picture of the market by way of study, synthesis, and summation of data from multiple sources. The analysts have presented the various facets of the market with a particular focus on identifying the key industry influencers. The data thus presented is comprehensive, reliable, and the result of extensive research, both primary and secondary.

INFORMATION SOURCES

Primary sources

  • Manufacturers and suppliers
  • Channel partners
  • Industry experts
  • Strategic decision makers

Secondary sources

  • Industry journals and periodicals
  • Government data
  • Financial reports of key industry players
  • Historical data
  • Press releases

DATA ANALYSIS

Data Synthesis

  • Collation of data
  • Estimation of key figures
  • Analysis of derived insights

Data Validation

  • Triangulation with data models
  • Reference against proprietary databases
  • Corroboration with industry experts

REPORT WRITING

Qualitative

  • Market drivers
  • Market challenges
  • Market trends
  • Five forces analysis

Quantitative

  • Market size and forecast
  • Market segmentation
  • Geographical insights
  • Competitive landscape

Interested in this report?

Get your sample now to see our research methodology and insights!

Download Now

Frequently Asked Questions

Pressure Infusion Bags market growth will increase by USD 4103.6 million during 2026-2030.

The Pressure Infusion Bags market is expected to grow at a CAGR of 7.2% during 2026-2030.

Pressure Infusion Bags market is segmented by Type (Disposable, Reusable) Material (Nylon, Polyurethane, Latex, Others) End-user (Hospitals, Clinics, Others)

ASP Global LLC, B.Braun SE, Baxter International Inc., Bosch Sohn GmbH u. Co. KG, Cardinal Health Inc., Demax Medical Technology Co., DeRoyal Industries Inc., Friedrich Bosch GmbH and Co. KG, ICU Medical Inc., Jorgensen Laboratories Inc., Medline Inc., Mercury Medical, Metko Medical, NovaMed USA, Poly Medicure Ltd., Premier Inc., Romsons Group, Rudolf Riester GmbH, SunMed LLC, Teleflex Inc. are a few of the key vendors in the Pressure Infusion Bags market.

Asia will register the highest growth rate of 39% among the other regions. Therefore, the Pressure Infusion Bags market in Asia is expected to garner significant business opportunities for the vendors during the forecast period.

US, Canada, Mexico, China, India, Japan, South Korea, Thailand, Indonesia, Germany, UK, France, Italy, Spain, The Netherlands, Brazil, Saudi Arabia, UAE, Turkey, South Africa, Israel, Argentina, Colombia

  • Escalation of surgical volumes and emergency trauma interventions is the driving factor this market.

The Pressure Infusion Bags market vendors should focus on grabbing business opportunities from the Type segment as it accounted for the largest market share in the base year.
RIA - Research AI Assistant
Ask RIA