Process Automation and Instrumentation Market Analysis APAC, North America, Europe, South America, Middle East and Africa - US, Canada, China, India, UK - Size and Forecast 2024-2028

Process Automation and Instrumentation Market Analysis APAC, North America, Europe, South America, Middle East and Africa - US, Canada, China, India, UK - Size and Forecast 2024-2028

Published: Nov 2023 187 Pages SKU: IRTNTR74354

Market Overview at a Glance

$30.26 B
Market Opportunity
5.95%
CAGR
5.58
YoY growth 2023-2024(%)

Process Automation and Instrumentation Market Size 2024-2028

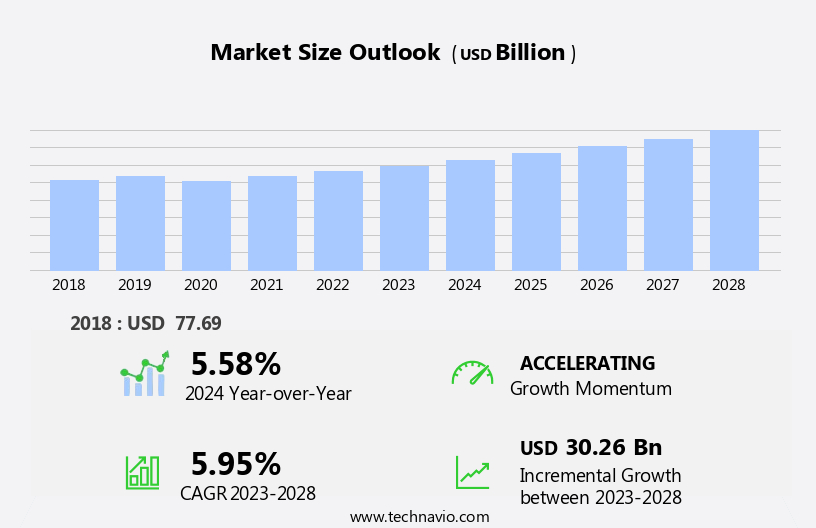
The process automation and instrumentation market size is forecast to increase by USD 30.26 billion, at a CAGR of 5.95% between 2023 and 2028.

  • The market is experiencing significant growth, driven by the increasing demand for manufacturing simplification through automation. Companies are recognizing the benefits of streamlined operations and cost savings, leading to increased investment in automation technologies. Another key trend is the shift from on-premises to cloud-based systems, enabling real-time data access and remote monitoring, which is becoming increasingly essential in today's business environment. However, this market is not without challenges. Cybersecurity threats pose a significant risk to the adoption of automation and instrumentation systems, with potential vulnerabilities in cloud-based systems and the increasing use of IoT devices.
  • Companies must prioritize robust security measures to mitigate these risks and protect their data and operations. To capitalize on market opportunities and navigate challenges effectively, organizations should focus on implementing advanced security protocols, investing in automation technologies, and embracing cloud-based solutions.

What will be the Size of the Process Automation and Instrumentation Market during the forecast period?

Process Automation and Instrumentation Market Size

Explore in-depth regional segment analysis with market size data - historical 2018-2022 and forecasts 2024-2028 - in the full report.  
Request Free Sample

The market continues to evolve, driven by the increasing demand for enhanced process control, product quality, and operational efficiency across various sectors. Digital twins, process analyzers, and validation techniques are increasingly being integrated into systems to optimize processes and ensure data integrity. Energy efficiency and performance monitoring are key focus areas, with smart manufacturing and data acquisition systems playing crucial roles. Control strategies such as PID control and SCADA systems are being augmented with advanced process control and machine learning algorithms to improve predictive analytics and real-time monitoring. Remote diagnostics and wireless communication enable cost reduction and efficient field services.

Process safety remains a top priority, with emergency shutdown systems and safety instrumented systems ensuring process reliability and compliance. Industrial IoT and cloud computing facilitate remote monitoring and data visualization, enabling process improvement and operational efficiency. Temperature sensors, ph meters, conductivity meters, pressure transmitters, and flow meters are essential components of process control systems, providing critical data for process optimization and quality control. Calibration services ensure accuracy and reliability of these sensors, while artificial intelligence and big data analytics enhance process understanding and optimization. Overall, the market is characterized by continuous innovation and integration of advanced technologies to address evolving market dynamics and customer requirements.

How is this Process Automation and Instrumentation Industry segmented?

The process automation and instrumentation industry research report provides comprehensive data (region-wise segment analysis), with forecasts and estimates in "USD billion" for the period 2024-2028, as well as historical data from 2018-2022 for the following segments.

  • End-user
    • Oil and gas
    • Chemical
    • Food and beverages
    • Energy and power
    • Others
  • Type
    • Process automation
    • Process instrumentation
  • Geography
    • North America
      • US
      • Canada
    • Europe
      • UK
    • APAC
      • China
      • India
    • Rest of World (ROW)

    By End-user Insights

    The oil and gas segment is estimated to witness significant growth during the forecast period.

    The market is experiencing notable growth, particularly in the oil and gas sector. Factors driving this expansion include the increasing energy demand, ongoing exploration efforts, and industry-wide emphasis on operational efficiency and safety. Government initiatives also play a significant role. For instance, the US Department of Energy invests in advanced process automation technologies to enhance the sustainability and productivity of oil and gas operations. Similarly, Saudi Arabia's Vision 2030 plan aims to promote automation and digitization within the oil and gas industry while diversifying the economy. Predictive analytics and process control solutions, such as control valves and PLC controllers, are integral to optimizing product quality and reducing costs.

    Data visualization tools facilitate real-time monitoring and process optimization, while cloud computing enables remote access and collaboration. Emergency shutdown systems ensure process safety, and industrial IoT, flow meters, and remote monitoring systems enhance operational efficiency. Control algorithms, DCS systems, and SCADA systems facilitate process improvement and safety instrumented systems. Advanced process control strategies, maintenance services, and industrial automation solutions optimize performance and energy efficiency. Analytical instruments, including temperature sensors, pressure transmitters, and conductivity meters, provide valuable data for process validation and calibration services. Artificial intelligence and machine learning enable process analyzers to identify trends and anomalies, while digital twins offer immersive, harmonious simulations for process optimization.

    Wireless communication technologies, such as industrial ethernet and fieldbus communication, facilitate seamless integration and data acquisition. Instrumentation engineering expertise is essential for implementing these solutions effectively. Energy efficiency, performance monitoring, quality control, and smart manufacturing are key concerns for the industry. Data integrity is crucial for maintaining regulatory compliance and ensuring accurate decision-making. Overall, the market is evolving to meet the demands of modern industry, with a focus on enhancing operational efficiency, improving safety, and reducing costs.

    Process Automation and Instrumentation Market Size

    Request Free Sample

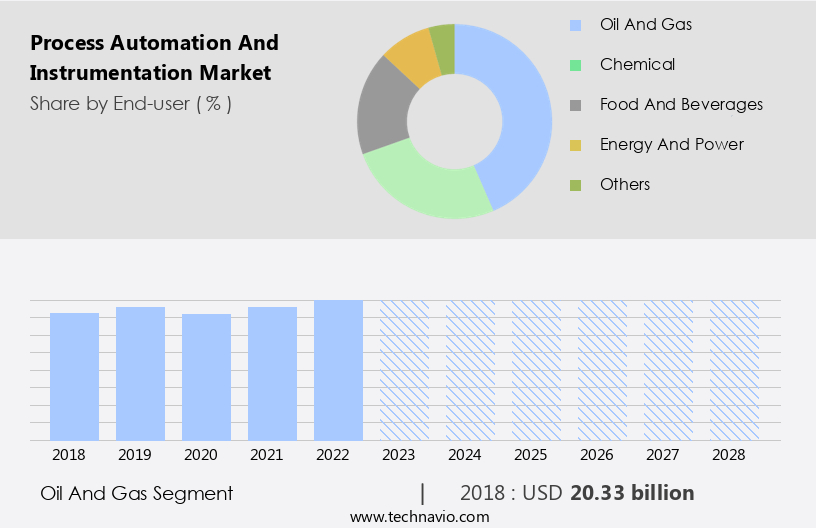
    The Oil and gas segment was valued at USD 20.33 billion in 2018 and showed a gradual increase during the forecast period.

    Regional Analysis

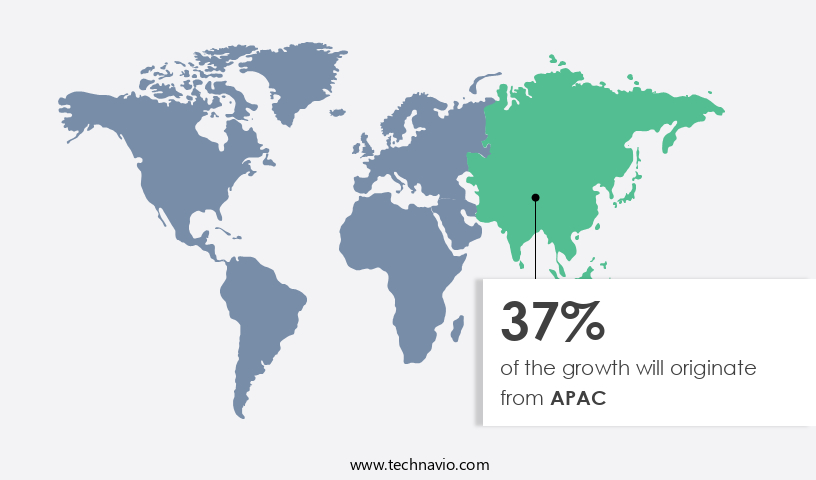
    APAC is estimated to contribute 37% to the growth of the global market during the forecast period.Technavio’s analysts have elaborately explained the regional trends and drivers that shape the market during the forecast period.

    Process Automation and Instrumentation Market Share by Geography

     Request Free Sample

    The market in APAC is projected to expand during the forecast period due to the region's ongoing industrial development and the pursuit of enhanced industry efficiency. However, the market's growth has been influenced by the presence of cost-effective industries, which may have financial constraints. Additionally, the availability of a large workforce at relatively low costs has been another factor hindering the adoption of process automation and instrumentation solutions in APAC. Despite these challenges, there is a growing awareness of the benefits of automation, including process optimization, product quality improvement, and cost reduction. Cloud computing and Industrial IoT technologies are increasingly being adopted for remote monitoring, diagnostics, and control.

    Advanced process control strategies, such as PID control and digital twins, are gaining traction to enhance operational efficiency and improve process safety. Data visualization and big data analytics are essential tools for real-time performance monitoring and process improvement. Furthermore, the integration of automation systems with wireless communication technologies and safety instrumented systems is a significant trend in the market. Calibration services, machine learning, and artificial intelligence are also being employed to ensure data integrity and improve overall system performance. Instrumentation engineering plays a crucial role in the design, installation, and maintenance of process automation and instrumentation systems. The market also encompasses various components, including control valves, PLC controllers, conductivity meters, level sensors, temperature sensors, ph meters, pressure transmitters, flow meters, and process analyzers.

    DCS systems, SCADA systems, and analytical instruments are integral to the market, with industrial ethernet and fieldbus communication facilitating seamless connectivity and data acquisition. Process validation, energy efficiency, and smart manufacturing are essential aspects of the market, with a focus on continuous process improvement and safety.

    Market Dynamics

    Our researchers analyzed the data with 2023 as the base year, along with the key drivers, trends, and challenges. A holistic analysis of drivers will help companies refine their marketing strategies to gain a competitive advantage.

    What are the key market drivers leading to the rise in the adoption of Process Automation and Instrumentation Industry?

    • The significant simplification of manufacturing processes achieved through automation serves as the primary market catalyst. 

    • Process automation and instrumentation have become essential components of modern manufacturing, particularly in industries with complex product development methods and stringent quality requirements. Predictive analytics, a key aspect of process automation, enables real-time monitoring and analysis of production data to optimize processes, reduce costs, and enhance product quality. Control systems, such as programmable logic controllers (PLCs) and control valves, play a crucial role in process automation. These systems facilitate process optimization by maintaining consistent process parameters and ensuring efficient production. Data visualization tools provide operators with real-time insights into the manufacturing process, enabling them to identify and address issues promptly.
    • Advancements in technology, including industrial IoT, cloud computing, and remote diagnostics, have further enhanced process automation capabilities. For instance, IoT sensors enable real-time monitoring of critical process parameters, while cloud computing facilitates remote access to data and analytics tools. Remote diagnostics enable predictive maintenance, reducing downtime and maintenance costs. Moreover, automation has led to cost reduction by eliminating routine work, improving work safety, and reducing lead times. Conductivity meters and other advanced sensors provide real-time process data, enabling manufacturers to maintain optimal process conditions and prevent product defects. Emergency shutdown systems ensure process safety and minimize potential damage to equipment and the environment.
    • In conclusion, process automation and instrumentation have become essential for manufacturing industries seeking to improve productivity, reduce costs, and enhance product quality. Predictive analytics, process control systems, data visualization, and advanced sensors are key technologies driving the adoption of process automation and instrumentation.

    What are the market trends shaping the Process Automation and Instrumentation Industry?

    • The transition from on-premises to cloud-based systems is an emerging market trend. It is essential for organizations to consider adopting cloud solutions to remain competitive and efficient in today's business landscape.

    • The market: Shifting Towards Cloud-Based Solutions for Enhanced Flexibility and Functionality Industrial operators are increasingly recognizing the value of service-based technology architecture in process automation and instrumentation. This trend is driving a shift from cloud-first to cloud-only models, compelling companies to invest more in public cloud services. Cloud-based systems offer several advantages, including high security, disaster recovery, and cost savings. However, small and medium-sized enterprises (SMEs) in process and discrete industries face budget constraints, making the initial investment for automation control systems like MES and DCS a challenge. Flow meters, level sensors, and other process instrumentation devices are crucial components of automation systems.
    • Control strategies, such as PID control, and DCS systems, facilitate real-time monitoring and optimization of industrial processes. Wireless communication and big data analytics enable remote monitoring and predictive maintenance, further enhancing operational efficiency. Control algorithms and field services ensure seamless integration and maintenance of these systems. In the ever-evolving industrial landscape, staying updated with the latest automation technologies is essential. Cloud-based automation systems provide a cost-effective and efficient solution for SMEs, enabling them to compete effectively with larger enterprises. By embracing these technologies, organizations can optimize their processes, improve safety, and enhance overall productivity.

    What challenges does the Process Automation and Instrumentation Industry face during its growth?

    • Cybersecurity threats pose a significant challenge to the growth of various industries by jeopardizing data security and confidentiality, leading to potential financial losses, reputational damage, and legal consequences. 

    • Process automation and instrumentation are transforming traditional industries by integrating advanced technologies such as digital twins, process analyzers, and data acquisition systems. These solutions enhance process validation, energy efficiency, performance monitoring, and quality control in manufacturing processes. Digital twins create immersive, harmonious simulations of physical processes, enabling real-time analysis and predictive maintenance. Process analyzers, including temperature sensors and pH meters, provide accurate data for process optimization and compliance. Calibration services ensure data integrity and maintain the accuracy of these instruments. Smart manufacturing, powered by artificial intelligence, streamlines operations and improves overall productivity. However, these technologies introduce new challenges, particularly in the area of cybersecurity.
    • Hackers can exploit vulnerabilities in industrial control systems, leading to operational downtime, manipulation of product development procedures, and theft of sensitive information. To mitigate these risks, organizations must prioritize data security and implement robust cybersecurity measures. By doing so, they can reap the benefits of automation and instrumentation while minimizing potential threats.

    Exclusive Customer Landscape

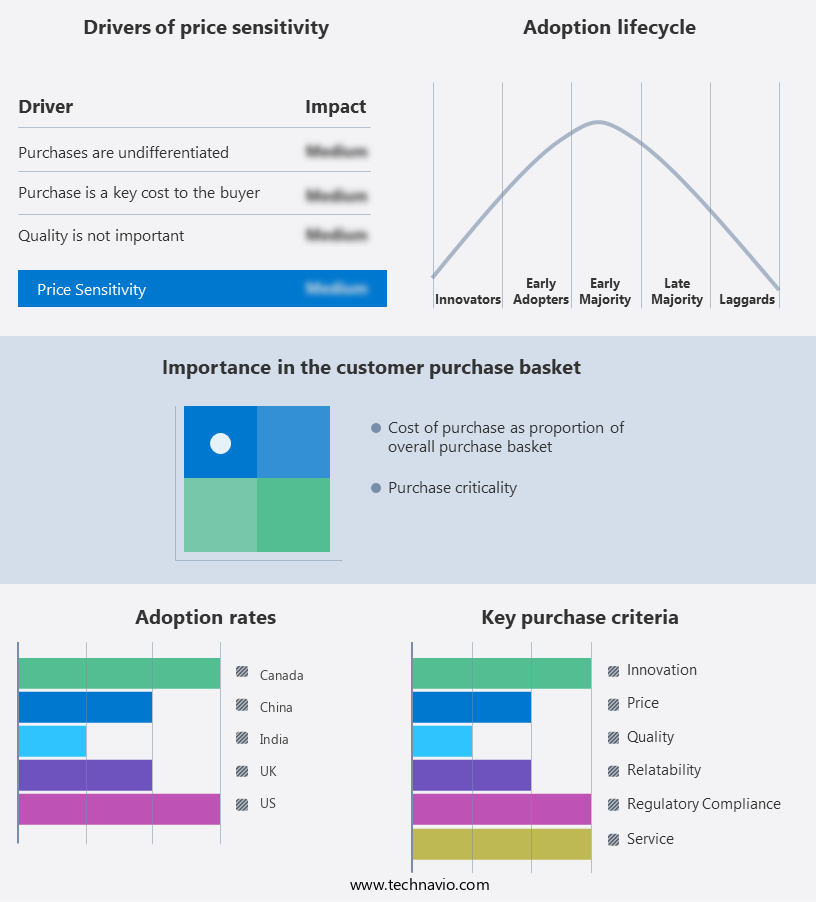
    The process automation and instrumentation market forecasting report includes the adoption lifecycle of the market, covering from the innovator’s stage to the laggard’s stage. It focuses on adoption rates in different regions based on penetration. Furthermore, the process automation and instrumentation market report also includes key purchase criteria and drivers of price sensitivity to help companies evaluate and develop their market growth analysis strategies.

    Process Automation and Instrumentation Market Share by Geography

     Customer Landscape

    Key Companies & Market Insights

    Companies are implementing various strategies, such as strategic alliances, process automation and instrumentation market forecast, partnerships, mergers and acquisitions, geographical expansion, and product/service launches, to enhance their presence in the industry.

    ABB Ltd. - This company specializes in providing process automation offerings, encompassing Control systems, Control Room Solutions, and Measurement Products. These solutions streamline operations for various industries, enhancing efficiency and accuracy.

    The industry research and growth report includes detailed analyses of the competitive landscape of the market and information about key companies, including:

    • ABB Ltd.
    • Delta Electronics Inc.
    • Emerson Electric Co.
    • Endress Hauser Group Services AG
    • Fuji Electric Co. Ltd.
    • General Electric Co.
    • Hitachi Ltd.
    • Honeywell International Inc.
    • KROHNE Messtechnik GmbH
    • Metso Outotec Corp.
    • Mitsubishi Electric Corp.
    • OMRON Corp.
    • Pepperl and Fuchs SE
    • Rockwell Automation Inc.
    • Schlumberger Ltd.
    • Schneider Electric SE
    • Siemens AG
    • Teledyne Technologies Inc.
    • Titan Co. Ltd.
    • Yokogawa Electric Corp.

    Qualitative and quantitative analysis of companies has been conducted to help clients understand the wider business environment as well as the strengths and weaknesses of key industry players. Data is qualitatively analyzed to categorize companies as pure play, category-focused, industry-focused, and diversified; it is quantitatively analyzed to categorize companies as dominant, leading, strong, tentative, and weak.

    Recent Development and News in Process Automation And Instrumentation Market

    • In January 2024, ABB, a leading technology provider, announced the launch of its new digital process automation solution, ABB Ability™ Process Automation 800XA, designed to optimize manufacturing processes and improve efficiency for various industries (ABB Press Release, 2024). In March 2024, Honeywell International and Microsoft Corporation announced a strategic partnership to integrate Honeywell's process automation solutions with Microsoft Azure to enhance industrial digital transformation (Microsoft News Center, 2024).
    • In April 2024, Emerson Electric Company completed the acquisition of Aventics, a leading global manufacturer of industrial valves and pneumatic components, expanding its automation solutions portfolio (Emerson Press Release, 2024). In May 2025, Schneider Electric, a major player in energy management and automation, received approval from the European Commission for its acquisition of AVEVA Group plc, a global leader in industrial software, to strengthen its digital transformation offering (European Commission Press Release, 2025).

    Research Analyst Overview

    • The markets witness dynamic growth, driven by the increasing demand for efficient and reliable industrial processes. Process historians and modelers facilitate data analysis, while calibration standards ensure instrument accuracy. Pressure regulators, level controllers, flow controllers, and temperature controllers maintain optimal process conditions. Preventive maintenance and validation services prolong equipment life, reducing downtime. Human-machine interfaces and alarm management improve operator efficiency. Remote access and cybersecurity solutions enhance system security. Process simulation software and edge computing enable predictive maintenance, optimizing performance. Industrial communication protocols facilitate seamless data exchange between devices. Data analytics software and batch control systems provide real-time insights for continuous improvement.
    • Calibration standards, diagnostic tools, and regulatory compliance services ensure industrial instrumentation solutions meet quality and safety requirements. Spare parts management, report generation, and asset management software optimize inventory and maintenance operations. Fault detection and corrective maintenance minimize production losses. Continuous control systems and distributed control systems enable real-time process adjustments. Wireless sensor networks and programmable logic controllers provide real-time data and automation capabilities. Industrial networks and industrial security safeguard against cyber threats. Cloud-based automation solutions offer flexible and cost-effective alternatives to traditional systems. Process automation solutions and valve positioners streamline operations and improve overall process efficiency.

    Dive into Technavio’s robust research methodology, blending expert interviews, extensive data synthesis, and validated models for unparalleled Process Automation and Instrumentation Market insights. See full methodology.

    Market Scope

    Report Coverage

    Details

    Page number

    187

    Base year

    2023

    Historic period

    2018-2022

    Forecast period

    2024-2028

    Growth momentum & CAGR

    Accelerate at a CAGR of 5.95%

    Market growth 2024-2028

    USD 30.26 billion

    Market structure

    Fragmented

    YoY growth 2023-2024(%)

    5.58

    Key countries

    US, Canada, China, India, and UK

    Competitive landscape

    Leading Companies, Market Positioning of Companies, Competitive Strategies, and Industry Risks

    Request Free Sample

    What are the Key Data Covered in this Process Automation and Instrumentation Market Research and Growth Report?

    • CAGR of the Process Automation and Instrumentation industry during the forecast period
    • Detailed information on factors that will drive the growth and forecasting between 2024 and 2028
    • Precise estimation of the size of the market and its contribution of the industry in focus to the parent market
    • Accurate predictions about upcoming growth and trends and changes in consumer behaviour
    • Growth of the market across APAC, North America, Europe, South America, and Middle East and Africa
    • Thorough analysis of the market’s competitive landscape and detailed information about companies
    • Comprehensive analysis of factors that will challenge the process automation and instrumentation market growth of industry companies

    We can help! Our analysts can customize this process automation and instrumentation market research report to meet your requirements.

    Get in touch


    1 Executive Summary

    • 1.1 Market overview
      • Exhibit 01: Executive Summary – Chart on Market Overview
      • Exhibit 02: Executive Summary – Data Table on Market Overview
      • Exhibit 03: Executive Summary – Chart on Global Market Characteristics
      • Exhibit 04: Executive Summary – Chart on Market by Geography
      • Exhibit 05: Executive Summary – Chart on Market Segmentation by End-user
      • Exhibit 06: Executive Summary – Chart on Market Segmentation by Type
      • Exhibit 07: Executive Summary – Chart on Incremental Growth
      • Exhibit 08: Executive Summary – Data Table on Incremental Growth
      • Exhibit 09: Executive Summary – Chart on Vendor Market Positioning

    2 Market Landscape

    • 2.1 Market ecosystem
      • Exhibit 10: Parent market
      • Exhibit 11: Market Characteristics

    3 Market Sizing

    • 3.1 Market definition
      • Exhibit 12: Offerings of vendors included in the market definition
    • 3.2 Market segment analysis
      • Exhibit 13: Market segments
    • 3.3 Market size 2023
      • 3.4 Market outlook: Forecast for 2023-2028
        • Exhibit 14: Chart on Global - Market size and forecast 2023-2028 ($ billion)
        • Exhibit 15: Data Table on Global - Market size and forecast 2023-2028 ($ billion)
        • Exhibit 16: Chart on Global Market: Year-over-year growth 2023-2028 (%)
        • Exhibit 17: Data Table on Global Market: Year-over-year growth 2023-2028 (%)

      4 Historic Market Size

      • 4.1 Global process automation and instrumentation market 2018 - 2022
        • Exhibit 18: Historic Market Size – Data Table on global process automation and instrumentation market 2018 - 2022 ($ billion)
      • 4.2 End-user Segment Analysis 2018 - 2022
        • Exhibit 19: Historic Market Size – End-user Segment 2018 - 2022 ($ billion)
      • 4.3 Type Segment Analysis 2018 - 2022
        • Exhibit 20: Historic Market Size – Type Segment 2018 - 2022 ($ billion)
      • 4.4 Geography Segment Analysis 2018 - 2022
        • Exhibit 21: Historic Market Size – Geography Segment 2018 - 2022 ($ billion)
      • 4.5 Country Segment Analysis 2018 - 2022
        • Exhibit 22: Historic Market Size – Country Segment 2018 - 2022 ($ billion)

      5 Five Forces Analysis

      • 5.1 Five forces summary
        • Exhibit 23: Five forces analysis - Comparison between 2023 and 2028
      • 5.2 Bargaining power of buyers
        • Exhibit 24: Chart on Bargaining power of buyers – Impact of key factors 2023 and 2028
      • 5.3 Bargaining power of suppliers
        • Exhibit 25: Bargaining power of suppliers – Impact of key factors in 2023 and 2028
      • 5.4 Threat of new entrants
        • Exhibit 26: Threat of new entrants – Impact of key factors in 2023 and 2028
      • 5.5 Threat of substitutes
        • Exhibit 27: Threat of substitutes – Impact of key factors in 2023 and 2028
      • 5.6 Threat of rivalry
        • Exhibit 28: Threat of rivalry – Impact of key factors in 2023 and 2028
      • 5.7 Market condition
        • Exhibit 29: Chart on Market condition - Five forces 2023 and 2028

      6 Market Segmentation by End-user

      • 6.1 Market segments
        • Exhibit 30: Chart on End-user - Market share 2023-2028 (%)
        • Exhibit 31: Data Table on End-user - Market share 2023-2028 (%)
      • 6.2 Comparison by End-user
        • Exhibit 32: Chart on Comparison by End-user
        • Exhibit 33: Data Table on Comparison by End-user
      • 6.3 Oil and gas - Market size and forecast 2023-2028
        • Exhibit 34: Chart on Oil and gas - Market size and forecast 2023-2028 ($ billion)
        • Exhibit 35: Data Table on Oil and gas - Market size and forecast 2023-2028 ($ billion)
        • Exhibit 36: Chart on Oil and gas - Year-over-year growth 2023-2028 (%)
        • Exhibit 37: Data Table on Oil and gas - Year-over-year growth 2023-2028 (%)
      • 6.4 Chemical - Market size and forecast 2023-2028
        • Exhibit 38: Chart on Chemical - Market size and forecast 2023-2028 ($ billion)
        • Exhibit 39: Data Table on Chemical - Market size and forecast 2023-2028 ($ billion)
        • Exhibit 40: Chart on Chemical - Year-over-year growth 2023-2028 (%)
        • Exhibit 41: Data Table on Chemical - Year-over-year growth 2023-2028 (%)
      • 6.5 Food and beverages - Market size and forecast 2023-2028
        • Exhibit 42: Chart on Food and beverages - Market size and forecast 2023-2028 ($ billion)
        • Exhibit 43: Data Table on Food and beverages - Market size and forecast 2023-2028 ($ billion)
        • Exhibit 44: Chart on Food and beverages - Year-over-year growth 2023-2028 (%)
        • Exhibit 45: Data Table on Food and beverages - Year-over-year growth 2023-2028 (%)
      • 6.6 Energy and power - Market size and forecast 2023-2028
        • Exhibit 46: Chart on Energy and power - Market size and forecast 2023-2028 ($ billion)
        • Exhibit 47: Data Table on Energy and power - Market size and forecast 2023-2028 ($ billion)
        • Exhibit 48: Chart on Energy and power - Year-over-year growth 2023-2028 (%)
        • Exhibit 49: Data Table on Energy and power - Year-over-year growth 2023-2028 (%)
      • 6.7 Others - Market size and forecast 2023-2028
        • Exhibit 50: Chart on Others - Market size and forecast 2023-2028 ($ billion)
        • Exhibit 51: Data Table on Others - Market size and forecast 2023-2028 ($ billion)
        • Exhibit 52: Chart on Others - Year-over-year growth 2023-2028 (%)
        • Exhibit 53: Data Table on Others - Year-over-year growth 2023-2028 (%)
      • 6.8 Market opportunity by End-user
        • Exhibit 54: Market opportunity by End-user ($ billion)
        • Exhibit 55: Data Table on Market opportunity by End-user ($ billion)

      7 Market Segmentation by Type

      • 7.1 Market segments
        • Exhibit 56: Chart on Type - Market share 2023-2028 (%)
        • Exhibit 57: Data Table on Type - Market share 2023-2028 (%)
      • 7.2 Comparison by Type
        • Exhibit 58: Chart on Comparison by Type
        • Exhibit 59: Data Table on Comparison by Type
      • 7.3 Process automation - Market size and forecast 2023-2028
        • Exhibit 60: Chart on Process automation - Market size and forecast 2023-2028 ($ billion)
        • Exhibit 61: Data Table on Process automation - Market size and forecast 2023-2028 ($ billion)
        • Exhibit 62: Chart on Process automation - Year-over-year growth 2023-2028 (%)
        • Exhibit 63: Data Table on Process automation - Year-over-year growth 2023-2028 (%)
      • 7.4 Process instrumentation - Market size and forecast 2023-2028
        • Exhibit 64: Chart on Process instrumentation - Market size and forecast 2023-2028 ($ billion)
        • Exhibit 65: Data Table on Process instrumentation - Market size and forecast 2023-2028 ($ billion)
        • Exhibit 66: Chart on Process instrumentation - Year-over-year growth 2023-2028 (%)
        • Exhibit 67: Data Table on Process instrumentation - Year-over-year growth 2023-2028 (%)
      • 7.5 Market opportunity by Type
        • Exhibit 68: Market opportunity by Type ($ billion)
        • Exhibit 69: Data Table on Market opportunity by Type ($ billion)

      8 Customer Landscape

      • 8.1 Customer landscape overview
        • Exhibit 70: Analysis of price sensitivity, lifecycle, customer purchase basket, adoption rates, and purchase criteria

      9 Geographic Landscape

      • 9.1 Geographic segmentation
        • Exhibit 71: Chart on Market share by geography 2023-2028 (%)
        • Exhibit 72: Data Table on Market share by geography 2023-2028 (%)
      • 9.2 Geographic comparison
        • Exhibit 73: Chart on Geographic comparison
        • Exhibit 74: Data Table on Geographic comparison
      • 9.3 APAC - Market size and forecast 2023-2028
        • Exhibit 75: Chart on APAC - Market size and forecast 2023-2028 ($ billion)
        • Exhibit 76: Data Table on APAC - Market size and forecast 2023-2028 ($ billion)
        • Exhibit 77: Chart on APAC - Year-over-year growth 2023-2028 (%)
        • Exhibit 78: Data Table on APAC - Year-over-year growth 2023-2028 (%)
      • 9.4 North America - Market size and forecast 2023-2028
        • Exhibit 79: Chart on North America - Market size and forecast 2023-2028 ($ billion)
        • Exhibit 80: Data Table on North America - Market size and forecast 2023-2028 ($ billion)
        • Exhibit 81: Chart on North America - Year-over-year growth 2023-2028 (%)
        • Exhibit 82: Data Table on North America - Year-over-year growth 2023-2028 (%)
      • 9.5 Europe - Market size and forecast 2023-2028
        • Exhibit 83: Chart on Europe - Market size and forecast 2023-2028 ($ billion)
        • Exhibit 84: Data Table on Europe - Market size and forecast 2023-2028 ($ billion)
        • Exhibit 85: Chart on Europe - Year-over-year growth 2023-2028 (%)
        • Exhibit 86: Data Table on Europe - Year-over-year growth 2023-2028 (%)
      • 9.6 South America - Market size and forecast 2023-2028
        • Exhibit 87: Chart on South America - Market size and forecast 2023-2028 ($ billion)
        • Exhibit 88: Data Table on South America - Market size and forecast 2023-2028 ($ billion)
        • Exhibit 89: Chart on South America - Year-over-year growth 2023-2028 (%)
        • Exhibit 90: Data Table on South America - Year-over-year growth 2023-2028 (%)
      • 9.7 Middle East and Africa - Market size and forecast 2023-2028
        • Exhibit 91: Chart on Middle East and Africa - Market size and forecast 2023-2028 ($ billion)
        • Exhibit 92: Data Table on Middle East and Africa - Market size and forecast 2023-2028 ($ billion)
        • Exhibit 93: Chart on Middle East and Africa - Year-over-year growth 2023-2028 (%)
        • Exhibit 94: Data Table on Middle East and Africa - Year-over-year growth 2023-2028 (%)
      • 9.8 US - Market size and forecast 2023-2028
        • Exhibit 95: Chart on US - Market size and forecast 2023-2028 ($ billion)
        • Exhibit 96: Data Table on US - Market size and forecast 2023-2028 ($ billion)
        • Exhibit 97: Chart on US - Year-over-year growth 2023-2028 (%)
        • Exhibit 98: Data Table on US - Year-over-year growth 2023-2028 (%)
      • 9.9 China - Market size and forecast 2023-2028
        • Exhibit 99: Chart on China - Market size and forecast 2023-2028 ($ billion)
        • Exhibit 100: Data Table on China - Market size and forecast 2023-2028 ($ billion)
        • Exhibit 101: Chart on China - Year-over-year growth 2023-2028 (%)
        • Exhibit 102: Data Table on China - Year-over-year growth 2023-2028 (%)
      • 9.10 India - Market size and forecast 2023-2028
        • Exhibit 103: Chart on India - Market size and forecast 2023-2028 ($ billion)
        • Exhibit 104: Data Table on India - Market size and forecast 2023-2028 ($ billion)
        • Exhibit 105: Chart on India - Year-over-year growth 2023-2028 (%)
        • Exhibit 106: Data Table on India - Year-over-year growth 2023-2028 (%)
      • 9.11 Canada - Market size and forecast 2023-2028
        • Exhibit 107: Chart on Canada - Market size and forecast 2023-2028 ($ billion)
        • Exhibit 108: Data Table on Canada - Market size and forecast 2023-2028 ($ billion)
        • Exhibit 109: Chart on Canada - Year-over-year growth 2023-2028 (%)
        • Exhibit 110: Data Table on Canada - Year-over-year growth 2023-2028 (%)
      • 9.12 UK - Market size and forecast 2023-2028
        • Exhibit 111: Chart on UK - Market size and forecast 2023-2028 ($ billion)
        • Exhibit 112: Data Table on UK - Market size and forecast 2023-2028 ($ billion)
        • Exhibit 113: Chart on UK - Year-over-year growth 2023-2028 (%)
        • Exhibit 114: Data Table on UK - Year-over-year growth 2023-2028 (%)
      • 9.13 Market opportunity by geography
        • Exhibit 115: Market opportunity by geography ($ billion)
        • Exhibit 116: Data Tables on Market opportunity by geography ($ billion)

      10 Drivers, Challenges, and Trends

      • 10.1 Market drivers
        • 10.2 Market challenges
          • 10.3 Impact of drivers and challenges
            • Exhibit 117: Impact of drivers and challenges in 2023 and 2028
          • 10.4 Market trends

            11 Vendor Landscape

            • 11.1 Overview
              • 11.2 Vendor landscape
                • Exhibit 118: Overview on Criticality of inputs and Factors of differentiation
              • 11.3 Landscape disruption
                • Exhibit 119: Overview on factors of disruption
              • 11.4 Industry risks
                • Exhibit 120: Impact of key risks on business

              12 Vendor Analysis

              • 12.1 Vendors covered
                • Exhibit 121: Vendors covered
              • 12.2 Market positioning of vendors
                • Exhibit 122: Matrix on vendor position and classification
              • 12.3 ABB Ltd.
                • Exhibit 123: ABB Ltd. - Overview
                • Exhibit 124: ABB Ltd. - Business segments
                • Exhibit 125: ABB Ltd. - Key offerings
                • Exhibit 126: ABB Ltd. - Segment focus
              • 12.4 Delta Electronics Inc.
                • Exhibit 127: Delta Electronics Inc. - Overview
                • Exhibit 128: Delta Electronics Inc. - Business segments
                • Exhibit 129: Delta Electronics Inc. - Key offerings
                • Exhibit 130: Delta Electronics Inc. - Segment focus
              • 12.5 Emerson Electric Co.
                • Exhibit 131: Emerson Electric Co. - Overview
                • Exhibit 132: Emerson Electric Co. - Business segments
                • Exhibit 133: Emerson Electric Co. - Key news
                • Exhibit 134: Emerson Electric Co. - Key offerings
                • Exhibit 135: Emerson Electric Co. - Segment focus
              • 12.6 Endress Hauser Group Services AG
                • Exhibit 136: Endress Hauser Group Services AG - Overview
                • Exhibit 137: Endress Hauser Group Services AG - Product / Service
                • Exhibit 138: Endress Hauser Group Services AG - Key news
                • Exhibit 139: Endress Hauser Group Services AG - Key offerings
              • 12.7 Fuji Electric Co. Ltd.
                • Exhibit 140: Fuji Electric Co. Ltd. - Overview
                • Exhibit 141: Fuji Electric Co. Ltd. - Business segments
                • Exhibit 142: Fuji Electric Co. Ltd. - Key offerings
                • Exhibit 143: Fuji Electric Co. Ltd. - Segment focus
              • 12.8 General Electric Co.
                • Exhibit 144: General Electric Co. - Overview
                • Exhibit 145: General Electric Co. - Business segments
                • Exhibit 146: General Electric Co. - Key news
                • Exhibit 147: General Electric Co. - Key offerings
                • Exhibit 148: General Electric Co. - Segment focus
              • 12.9 Hitachi Ltd.
                • Exhibit 149: Hitachi Ltd. - Overview
                • Exhibit 150: Hitachi Ltd. - Business segments
                • Exhibit 151: Hitachi Ltd. - Key news
                • Exhibit 152: Hitachi Ltd. - Key offerings
                • Exhibit 153: Hitachi Ltd. - Segment focus
              • 12.10 Honeywell International Inc.
                • Exhibit 154: Honeywell International Inc. - Overview
                • Exhibit 155: Honeywell International Inc. - Business segments
                • Exhibit 156: Honeywell International Inc. - Key news
                • Exhibit 157: Honeywell International Inc. - Key offerings
                • Exhibit 158: Honeywell International Inc. - Segment focus
              • 12.11 Metso Outotec Corp.
                • Exhibit 159: Metso Outotec Corp. - Overview
                • Exhibit 160: Metso Outotec Corp. - Business segments
                • Exhibit 161: Metso Outotec Corp. - Key offerings
                • Exhibit 162: Metso Outotec Corp. - Segment focus
              • 12.12 Mitsubishi Electric Corp.
                • Exhibit 163: Mitsubishi Electric Corp. - Overview
                • Exhibit 164: Mitsubishi Electric Corp. - Business segments
                • Exhibit 165: Mitsubishi Electric Corp. - Key news
                • Exhibit 166: Mitsubishi Electric Corp. - Key offerings
                • Exhibit 167: Mitsubishi Electric Corp. - Segment focus
              • 12.13 OMRON Corp.
                • Exhibit 168: OMRON Corp. - Overview
                • Exhibit 169: OMRON Corp. - Business segments
                • Exhibit 170: OMRON Corp. - Key news
                • Exhibit 171: OMRON Corp. - Key offerings
                • Exhibit 172: OMRON Corp. - Segment focus
              • 12.14 Pepperl and Fuchs SE
                • Exhibit 173: Pepperl and Fuchs SE - Overview
                • Exhibit 174: Pepperl and Fuchs SE - Product / Service
                • Exhibit 175: Pepperl and Fuchs SE - Key offerings
              • 12.15 Rockwell Automation Inc.
                • Exhibit 176: Rockwell Automation Inc. - Overview
                • Exhibit 177: Rockwell Automation Inc. - Business segments
                • Exhibit 178: Rockwell Automation Inc. - Key news
                • Exhibit 179: Rockwell Automation Inc. - Key offerings
                • Exhibit 180: Rockwell Automation Inc. - Segment focus
              • 12.16 Schneider Electric SE
                • Exhibit 181: Schneider Electric SE - Overview
                • Exhibit 182: Schneider Electric SE - Business segments
                • Exhibit 183: Schneider Electric SE - Key news
                • Exhibit 184: Schneider Electric SE - Key offerings
                • Exhibit 185: Schneider Electric SE - Segment focus
              • 12.17 Siemens AG
                • Exhibit 186: Siemens AG - Overview
                • Exhibit 187: Siemens AG - Business segments
                • Exhibit 188: Siemens AG - Key news
                • Exhibit 189: Siemens AG - Key offerings
                • Exhibit 190: Siemens AG - Segment focus

              13 Appendix

              • 13.1 Scope of the report
                • 13.2 Inclusions and exclusions checklist
                  • Exhibit 191: Inclusions checklist
                  • Exhibit 192: Exclusions checklist
                • 13.3 Currency conversion rates for US$
                  • Exhibit 193: Currency conversion rates for US$
                • 13.4 Research methodology
                  • Exhibit 194: Research methodology
                  • Exhibit 195: Validation techniques employed for market sizing
                  • Exhibit 196: Information sources
                • 13.5 List of abbreviations
                  • Exhibit 197: List of abbreviations

                Research Methodology

                Technavio presents a detailed picture of the market by way of study, synthesis, and summation of data from multiple sources. The analysts have presented the various facets of the market with a particular focus on identifying the key industry influencers. The data thus presented is comprehensive, reliable, and the result of extensive research, both primary and secondary.

                INFORMATION SOURCES

                Primary sources

                • Manufacturers and suppliers
                • Channel partners
                • Industry experts
                • Strategic decision makers

                Secondary sources

                • Industry journals and periodicals
                • Government data
                • Financial reports of key industry players
                • Historical data
                • Press releases

                DATA ANALYSIS

                Data Synthesis

                • Collation of data
                • Estimation of key figures
                • Analysis of derived insights

                Data Validation

                • Triangulation with data models
                • Reference against proprietary databases
                • Corroboration with industry experts

                REPORT WRITING

                Qualitative

                • Market drivers
                • Market challenges
                • Market trends
                • Five forces analysis

                Quantitative

                • Market size and forecast
                • Market segmentation
                • Geographical insights
                • Competitive landscape

                Interested in this report?

                Get your sample now to see our research methodology and insights!

                Download Now

                Frequently Asked Questions

                Process Automation and Instrumentation market growth will increase by $ 30.26 bn during 2024-2028 .

                The Process Automation and Instrumentation market is expected to grow at a CAGR of 5.95% during 2024-2028 .

                Process Automation and Instrumentation market is segmented by End-user( Oil and gas, Chemical, Food and beverages, Energy and power, Others) Type( Process automation, Process instrumentation, Europe, South America, Middle East and Africa)

                ABB Ltd., Delta Electronics Inc., Emerson Electric Co., Endress Hauser Group Services AG, Fuji Electric Co. Ltd., General Electric Co., Hitachi Ltd., Honeywell International Inc., KROHNE Messtechnik GmbH, Metso Outotec Corp., Mitsubishi Electric Corp., OMRON Corp., Pepperl and Fuchs SE, Rockwell Automation Inc., Schlumberger Ltd., Schneider Electric SE, Siemens AG, Teledyne Technologies Inc., Titan Co. Ltd., Yokogawa Electric Corp. are a few of the key vendors in the Process Automation and Instrumentation market.

                APAC will register the highest growth rate of 37% among the other regions. Therefore, the Process Automation and Instrumentation market in APAC is expected to garner significant business opportunities for the vendors during the forecast period.

                US, Canada, China, India, UK

                • Simplification of manufacturing through automationRequirements such as a lengthy bill of materials is the driving factor this market.
                • long cycle time is the driving factor this market.
                • highly skilled labor is the driving factor this market.
                • non-repetitive production process is the driving factor this market.
                • and extensive data collection and verification have increased the complexity of the manufacturing processes in the process and discrete industry. The complex product development methods require continuous streaming of the overall process.  Over the past years is the driving factor this market.
                • automation in manufacturing has been transforming the factory floor and economics of many manufacturing sectors. Advancements in robotics is the driving factor this market.
                • artificial intelligence is the driving factor this market.
                • and machine learning are enabling machines to outperform humans in a range of work capabilities that require cognitive capabilities. Some of the advantages of automation manufacturing include an increase in labor productivity is the driving factor this market.
                • low labor cost is the driving factor this market.
                • elimination of routine work is the driving factor this market.
                • high work safety is the driving factor this market.
                • high product quality is the driving factor this market.
                • and a decrease in lead time. Automated systems like SCADA is the driving factor this market.
                • PLCs is the driving factor this market.
                • DCS is the driving factor this market.
                • and MES help industrial operators streamline and automate complex manufacturing and reporting processes. Additionally is the driving factor this market.
                • instruments such as sensors is the driving factor this market.
                • analyzers is the driving factor this market.
                • and transmitters help in providing accurate data and ensuring controlled production operations. MES are automated systems to improve the quality and traceability of the entire operation process is the driving factor this market.
                • while PLCs and SCADA systems ease the regulation of operational equipment such as 3D printing and product assembly lines.  The fierce competition and increasing complexity of production operations coupled with faster time-to-market have become a major challenge for the Indian market. Without automated systems in place is the driving factor this market.
                • the overall time-to-market increases and leads to losses for the process and discrete industrial manufacturers. Thus is the driving factor this market.
                • to adopt changing technology is the driving factor this market.
                • this automated device just needs a minor change in programming. As this automated system can easily adapt to operational changes is the driving factor this market.
                • it reduces the time taken to collect data and increases the efficiency of the overall production process. Thus is the driving factor this market.
                •  simplification of manufacturing through automation is a major driver that is expected to drive the growth of the global automation and instrumentation market during the forecast period. is the driving factor this market.

                The Process Automation and Instrumentation market vendors should focus on grabbing business opportunities from the Oil and gas segment as it accounted for the largest market share in the base year.