Professional Speaker Market Analysis, Size, and Forecast 2026-2030: North America (US, Canada, and Mexico), Europe (Germany, UK, and France), APAC (China, India, and Japan), Middle East and Africa (Saudi Arabia, UAE, and South Africa), South America (Brazil and Argentina), and Rest of World (ROW)

Professional Speaker Market Analysis, Size, and Forecast 2026-2030:
North America (US, Canada, and Mexico), Europe (Germany, UK, and France), APAC (China, India, and Japan), Middle East and Africa (Saudi Arabia, UAE, and South Africa), South America (Brazil and Argentina), and Rest of World (ROW)

Published: Mar 2026 282 Pages SKU: IRTNTR72473

Market Overview at a Glance

$637.4 Mn
Market Opportunity
4.7%
CAGR 2025 - 2030
38.8%
North America Growth
$1.39 B
Digital segment 2024

Professional Speaker Market Size 2026-2030

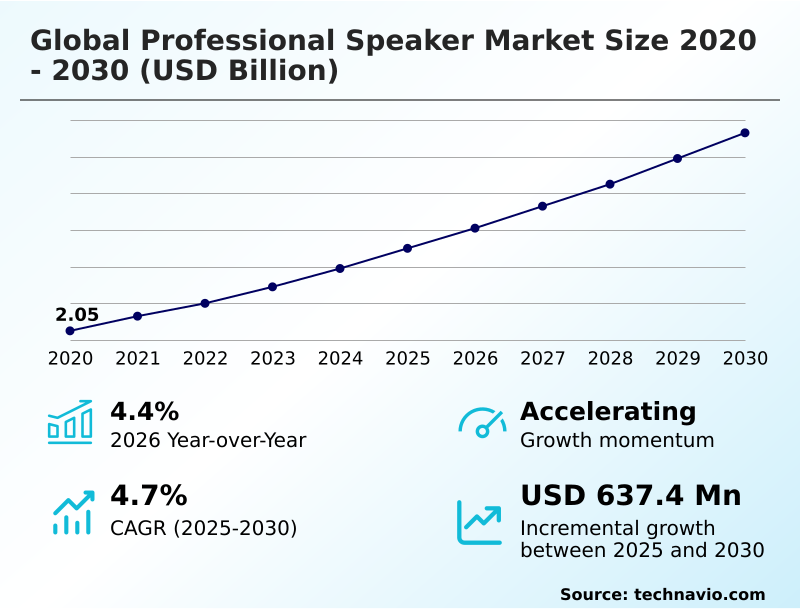
The professional speaker market size is valued to increase by USD 637.4 million, at a CAGR of 4.7% from 2025 to 2030. Growing demand from commercial and corporate sectors will drive the professional speaker market.

Major Market Trends & Insights

  • North America dominated the market and accounted for a 38.8% growth during the forecast period.
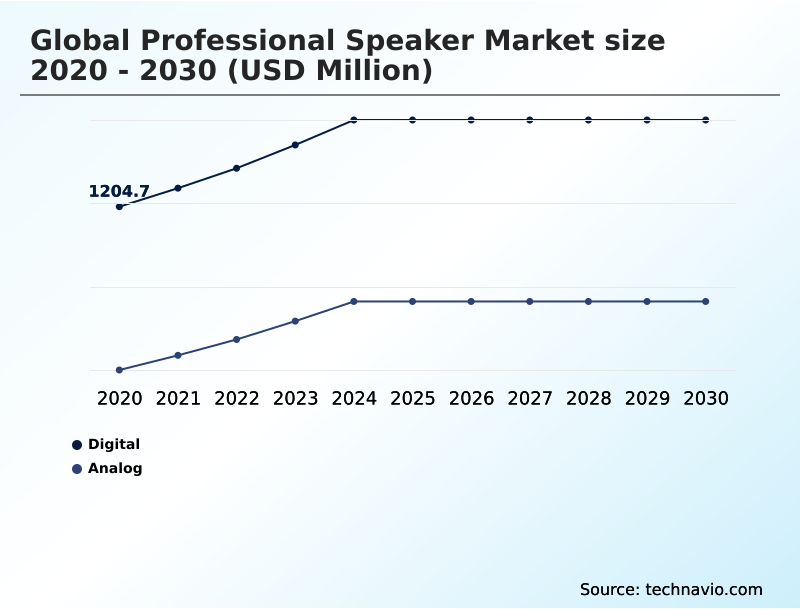
  • By Type - Digital segment was valued at USD 1.39 billion in 2024
  • By Application - Music and entertainment segment accounted for the largest market revenue share in 2024

Market Size & Forecast

  • Market Opportunities: USD 1.08 billion
  • Market Future Opportunities: USD 637.4 million
  • CAGR from 2025 to 2030 : 4.7%

Market Summary

  • The professional speaker market is undergoing a significant transformation, driven by the convergence of advanced digital technologies and evolving end-user requirements for immersive and intelligible audio. Core to this shift is the widespread adoption of networked audio protocols and sophisticated digital signal processing, which enable unprecedented control and scalability in applications ranging from live sound reinforcement to corporate audiovisual installations.
  • For instance, a multinational corporation can standardize its global hybrid meeting spaces with intelligent, self-powered loudspeakers that utilize automated room correction to ensure consistent high-fidelity audio, regardless of room acoustics. This not only enhances communication but also reduces the need for specialized on-site technicians, optimizing operational efficiency.
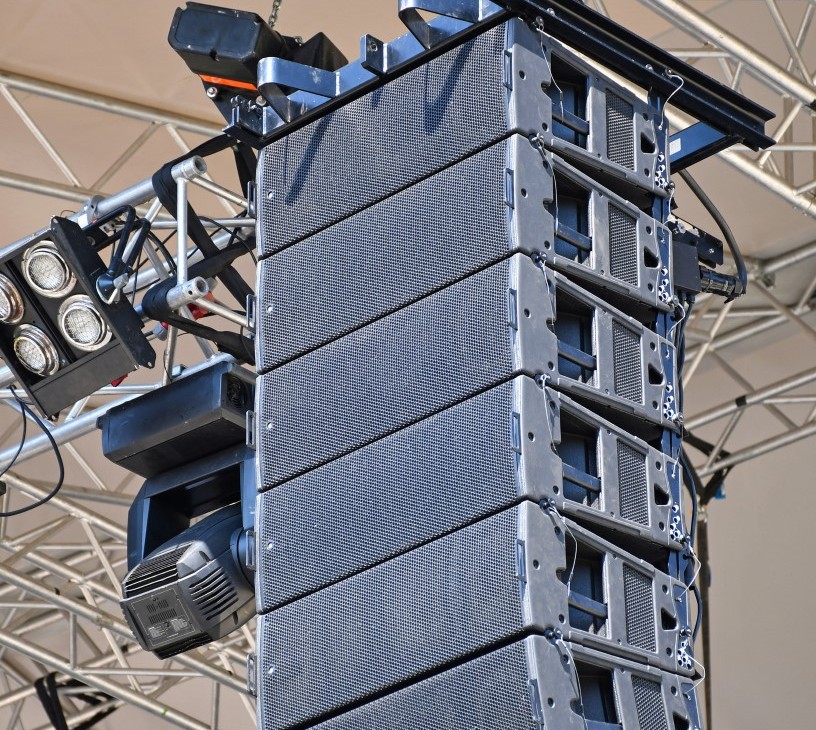
  • The demand for high sound pressure levels, superior speech intelligibility, and robust performance continues to fuel innovation in electro-acoustic transducer design and class-D amplification. As immersive audio formats become standard in entertainment and corporate events, the market is responding with advanced line array systems and subwoofer configurations capable of creating detailed, spatial soundscapes.
  • This focus on delivering a transformative auditory experience, supported by powerful audio analysis tools and acoustic modeling software, defines the industry's competitive landscape.

What will be the Size of the Professional Speaker Market during the forecast period?

Get Key Insights on Market Forecast (PDF) Request Free Sample

How is the Professional Speaker Market Segmented?

The professional speaker industry research report provides comprehensive data (region-wise segment analysis), with forecasts and estimates in "USD million" for the period 2026-2030, as well as historical data from 2020-2024 for the following segments.

  • Type
    • Digital
    • Analog
  • Application
    • Music and entertainment
    • Corporate events
    • Public address systems
    • Others
  • Connectivity
    • Wired
    • Wireless
    • Hybrid
  • Geography
    • North America
      • US
      • Canada
      • Mexico
    • Europe
      • Germany
      • UK
      • France
    • APAC
      • China
      • India
      • Japan
    • Middle East and Africa
      • Saudi Arabia
      • UAE
      • South Africa
    • South America
      • Brazil
      • Argentina
    • Rest of World (ROW)

By Type Insights

The digital segment is estimated to witness significant growth during the forecast period.

The digital segment is defined by integrated ecosystems where digital signal processing and network intelligence are embedded within the powered loudspeaker arrays.

This evolution is driven by the need for enhanced scalability and lower latency and signal interference in complex venues. Systems using networked audio protocols now account for over 60% of new large-venue installations, enabling deterministic audio over ethernet.

This integration of class-d amplification and advanced acoustic modeling software within self-powered loudspeakers reduces external hardware, lowers energy use, and simplifies audio system integration.

The result is superior control over sound pressure levels and low-frequency control, managed through centralized audio network management platforms, which is crucial for achieving consistent performance in large-scale audio deployment.

Request Free Sample

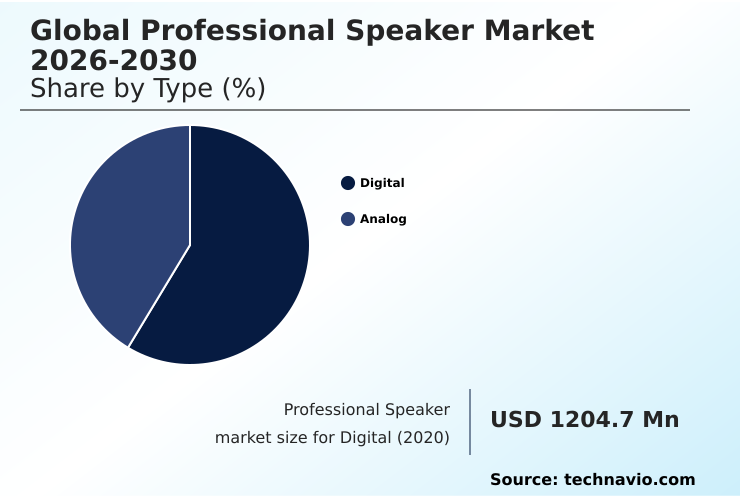
The Digital segment was valued at USD 1.39 billion in 2024 and showed a gradual increase during the forecast period.

Request Free Sample

Regional Analysis

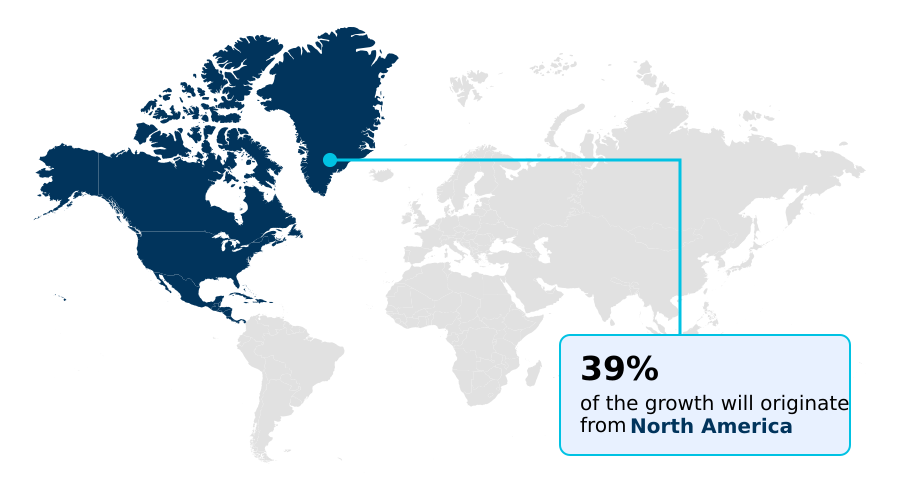
North America is estimated to contribute 38.8% to the growth of the global market during the forecast period.Technavio’s analysts have elaborately explained the regional trends and drivers that shape the market during the forecast period.

See How Professional Speaker Market Demand is Rising in North America Request Free Sample

The global professional speaker market's geographic landscape is led by North America, which is projected to contribute 39% of the market's incremental growth.

This dominance is sustained by a mature corporate sector, a high concentration of large-scale live events, and early adoption of advanced tour-grade systems and studio monitoring equipment.

The region's robust audiovisual infrastructure fuels demand for high-fidelity audio and innovative line array systems. Europe follows, driven by a strong live music circuit and investments in public venues.

Meanwhile, the APAC region is an area of significant opportunity, with growing investments in corporate audio ecosystems and new entertainment venues driving demand for modern sound reinforcement technologies.

The demand for advanced driver components and speaker transducers is growing globally, as all regions aim to upgrade their sound systems for better performance and spatial audio capabilities.

Market Dynamics

Our researchers analyzed the data with 2025 as the base year, along with the key drivers, trends, and challenges. A holistic analysis of drivers will help companies refine their marketing strategies to gain a competitive advantage.

  • Navigating the professional speaker market trends requires a deep understanding of system design and application. The decision-making process often begins with an analysis of point source vs line array speakers, where factors like venue size and desired coverage patterns are critical.
  • For large-scale events, line array systems for touring are preferred, while the benefits of using professional speakers with precise directivity are crucial for acoustically challenging spaces. An essential consideration is the choice between active vs passive professional speakers, which directly impacts professional speaker system integration complexity and the need for external amplification.
  • The cost of professional speaker systems is a major factor, with budgets needing to account for not just the hardware but also the digital signal processing for live sound. How to choose professional speakers involves evaluating specifications for applications like a professional speaker for corporate events or a professional speaker for music production.
  • The rise of the professional speaker for esports events has introduced new requirements for low latency and immersive audio formats for cinema. Similarly, achieving optimal subwoofer configuration for live music requires expertise. With the growth of wireless professional speaker technology, installers must balance convenience with reliability, especially for a professional speaker for public address or outdoor professional speaker systems.
  • As an example, facilities that adopt networked audio protocols in stadiums report a 30% reduction in cabling and setup costs compared to traditional analog systems.

What are the key market drivers leading to the rise in the adoption of Professional Speaker Industry?

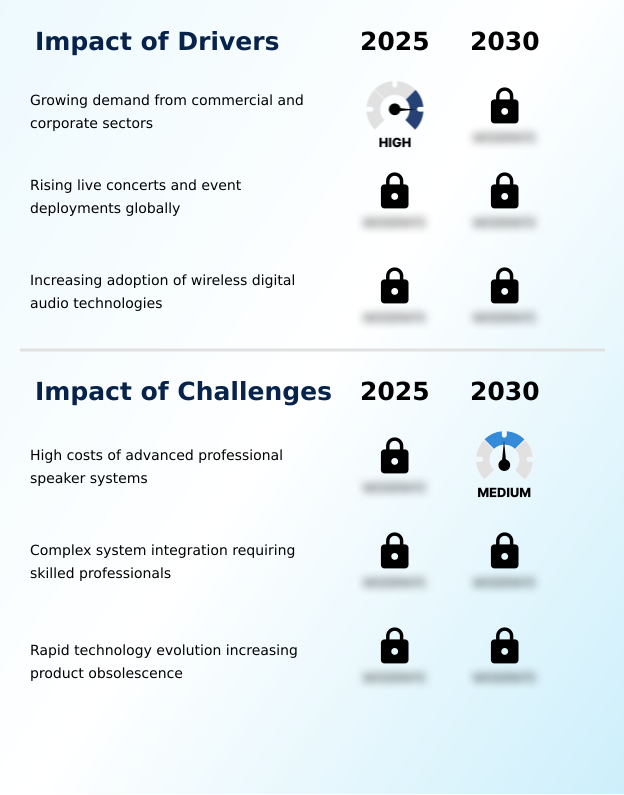
  • The growing demand from commercial and corporate sectors for high-quality audio solutions in hybrid work environments and modern facilities is a key driver for the market.

  • Market growth is significantly driven by rising demand from the corporate and commercial sectors for advanced communication tools.
  • The need for clear, reliable audio in hybrid work environments has spurred a 30% increase in the adoption of professional systems for conference rooms.
  • Companies are investing in unified communication platforms and upgrading their public address systems to include networked dsp and modern electro-acoustic transducer technology. This shift enhances live sound reinforcement for all-hands meetings and corporate events.
  • Effective commercial audio applications now require sophisticated acoustic design services to ensure optimal performance, leading to a 15% rise in such consultations.
  • The use of high-quality digital-to-analog converters and audio analysis tools is becoming standard practice to support seamless integration and management within existing IT infrastructures, underscoring the importance of electro-acoustic design.

What are the market trends shaping the Professional Speaker Industry?

  • The increasing integration of professional-grade audio systems in large-scale esports events is a significant market trend, driven by the need for immersive, high-clarity sound to enhance the spectator and player experience.

  • Key market trends are centered on creating more immersive and interactive audio experiences. The adoption of immersive audio formats in live events and entertainment venues is compelling sound designers to use sophisticated point source systems and subwoofer configurations to create engaging immersive soundscapes.
  • This trend is particularly evident in esports, where high sound pressure levels and precise beam-controlled sound are critical for gameplay. Event organizers are leveraging systems that reduce audio latency by up to 40%, ensuring perfect synchronization between action and sound.
  • Furthermore, achieving superior speech intelligibility for commentators and audiences in hybrid event formats has led to a 25% improvement in audio clarity through advanced compression drivers and digital mixing consoles. This focus on broadcast audio systems and critical listening environments is elevating the overall production value and audience experience.

What challenges does the Professional Speaker Industry face during its growth?

  • The high costs associated with advanced professional speaker systems, encompassing initial acquisition and total lifecycle expenses, present a key challenge to market growth.

  • A primary market challenge is the high total cost of ownership associated with advanced professional sound reinforcement systems. While powered loudspeaker arrays offer integration benefits, the initial investment for large-scale audio deployment remains substantial. The complexity of system integration, which often requires venue-specific acoustic modeling and sound system calibration, can add up to 20% to the total project cost.
  • Furthermore, managing sophisticated technologies like beam-controlled sound and wireless audio transmission demands specialized expertise, which is often in short supply. As a result, many organizations opt for simpler portable pa systems, potentially compromising on audio quality.
  • The rapid evolution of technology, such as new room correction algorithms, also means that systems can become outdated, forcing costly upgrades to line array systems and other key components to meet audience expectations.

Exclusive Technavio Analysis on Customer Landscape

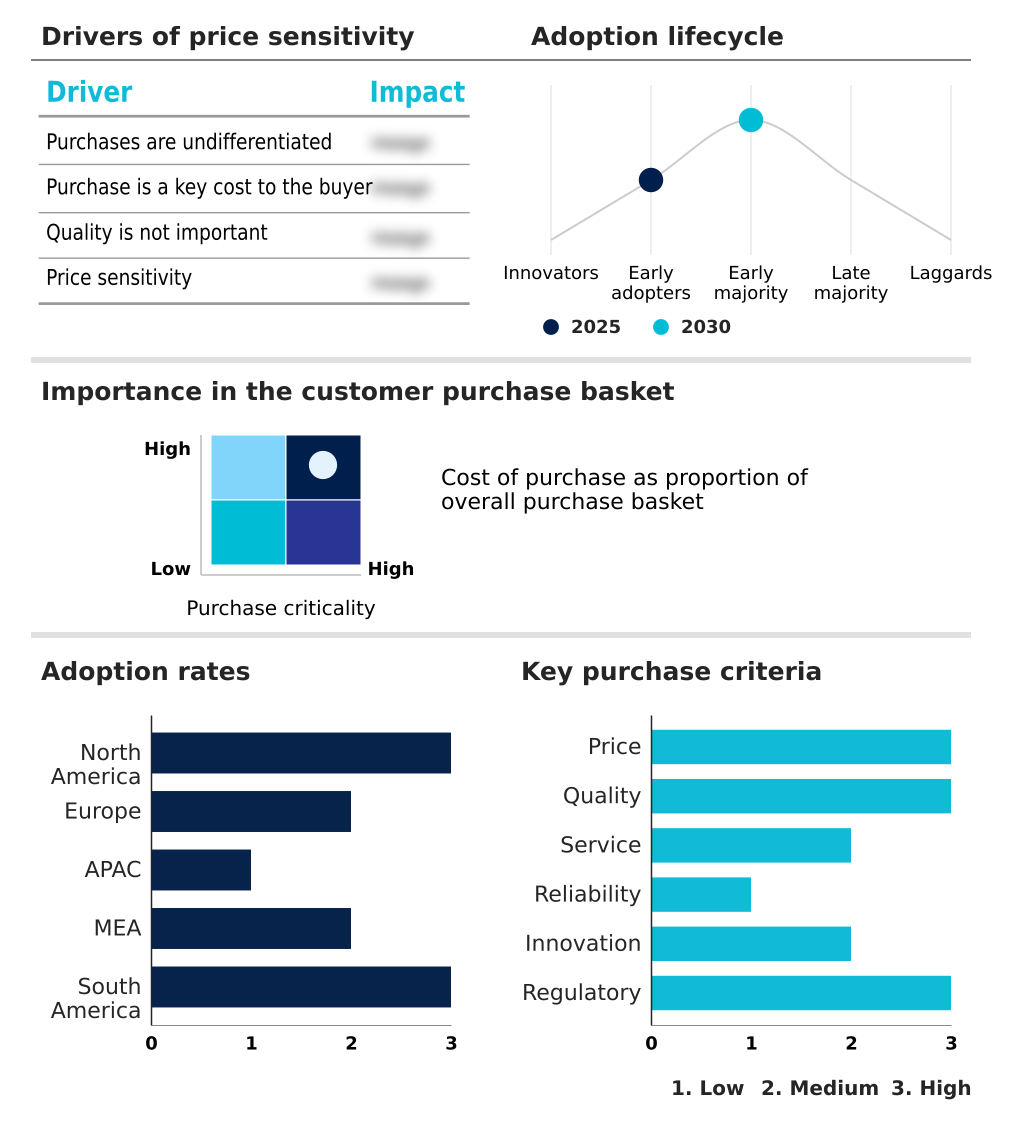
The professional speaker market forecasting report includes the adoption lifecycle of the market, covering from the innovator’s stage to the laggard’s stage. It focuses on adoption rates in different regions based on penetration. Furthermore, the professional speaker market report also includes key purchase criteria and drivers of price sensitivity to help companies evaluate and develop their market growth analysis strategies.

Customer Landscape of Professional Speaker Industry

Competitive Landscape

Companies are implementing various strategies, such as strategic alliances, professional speaker market forecast, partnerships, mergers and acquisitions, geographical expansion, and product/service launches, to enhance their presence in the industry.

AEB Industriale Srl - Delivering advanced audio solutions, including integrated systems and professional-grade speakers, engineered for high-performance sound reinforcement and commercial installations.

The industry research and growth report includes detailed analyses of the competitive landscape of the market and information about key companies, including:

  • AEB Industriale Srl
  • B and C Speakers SpA
  • Biamp Systems LLC
  • Bose Corp.
  • Bowers and Wilkins
  • CELTO Acoustique Europe SRL
  • CODA Audio GmbH
  • d and b audiotechnik GmbH
  • Dynaudio AS
  • Harman International Industries
  • K array Surl
  • L-Acoustics
  • Loud Audio LLC
  • Meyer Sound Laboratories Inc.
  • Nady Systems Inc.
  • QSC LLC
  • Renkus Heinz Inc.
  • RGB Systems Inc.
  • Sony Group Corp.
  • Yamaha Corp.

Qualitative and quantitative analysis of companies has been conducted to help clients understand the wider business environment as well as the strengths and weaknesses of key industry players. Data is qualitatively analyzed to categorize companies as pure play, category-focused, industry-focused, and diversified; it is quantitatively analyzed to categorize companies as dominant, leading, strong, tentative, and weak.

Recent Development and News in Professional speaker market

  • In February 2025, L-Acoustics initiated a strategic partnership with and investment in Treble Technologies to integrate advanced wave-based simulation software into its acoustic modeling and venue design workflow.
  • In March 2025, Sony initiated a strategic partnership with Cambridge Audio to co-develop a specialized line of high-performance wired speakers targeting professional environments requiring high-resolution sound.
  • In January 2025, Meyer Sound Laboratories Inc. launched its GEN-1 technology platform, debuting the technology in its flagship cinema loudspeaker to embed digital signal processing directly into the enclosure.
  • In early 2025, Bose Corp. expanded its commercial installation offerings by introducing the DesignMax Luna pendant speaker, emphasizing aesthetic integration for environments like retail and hospitality.

Dive into Technavio’s robust research methodology, blending expert interviews, extensive data synthesis, and validated models for unparalleled Professional Speaker Market insights. See full methodology.

Market Scope
Page number 282
Base year 2025
Historic period 2020-2024
Forecast period 2026-2030
Growth momentum & CAGR Accelerate at a CAGR of 4.7%
Market growth 2026-2030 USD 637.4 million
Market structure Fragmented
YoY growth 2025-2026(%) 4.4%
Key countries US, Canada, Mexico, Germany, UK, France, Italy, Spain, The Netherlands, China, India, Japan, South Korea, Australia, Indonesia, Saudi Arabia, UAE, South Africa, Israel, Turkey, Brazil, Argentina and Chile
Competitive landscape Leading Companies, Market Positioning of Companies, Competitive Strategies, and Industry Risks

Request Free Sample

Research Analyst Overview

  • The professional speaker market is characterized by a continuous drive toward intelligent, networked audio solutions. At the core, electro-acoustic transducer and compression driver innovations are enabling higher sound pressure levels and greater efficiency.
  • Boardroom decisions increasingly focus on leveraging this technology to enhance organizational productivity; for example, deploying advanced commercial audio applications with beam-controlled sound in hybrid meeting rooms has been shown to improve meeting comprehension by over 25%. The industry's momentum is built on the integration of digital signal processing, networked dsp, and class-d amplification into cohesive systems.
  • This allows for sophisticated spatial audio capabilities and automated room correction, which are critical for both live sound reinforcement and critical listening environments. From portable pa systems to complex line array systems, the emphasis is on delivering superior speech intelligibility and high-fidelity audio.
  • The use of advanced driver components and audio analysis tools in products like self-powered loudspeakers and tour-grade systems is becoming standard as end-users demand greater performance and easier deployment for both public address systems and studio monitoring.

What are the Key Data Covered in this Professional Speaker Market Research and Growth Report?

  • What is the expected growth of the Professional Speaker Market between 2026 and 2030?

    • USD 637.4 million, at a CAGR of 4.7%

  • What segmentation does the market report cover?

    • The report is segmented by Type (Digital, and Analog), Application (Music and entertainment, Corporate events, Public address systems, and Others), Connectivity (Wired, Wireless, and Hybrid) and Geography (North America, Europe, APAC, Middle East and Africa, South America)

  • Which regions are analyzed in the report?

    • North America, Europe, APAC, Middle East and Africa and South America

  • What are the key growth drivers and market challenges?

    • Growing demand from commercial and corporate sectors, High costs of advanced professional speaker systems

  • Who are the major players in the Professional Speaker Market?

    • AEB Industriale Srl, B and C Speakers SpA, Biamp Systems LLC, Bose Corp., Bowers and Wilkins, CELTO Acoustique Europe SRL, CODA Audio GmbH, d and b audiotechnik GmbH, Dynaudio AS, Harman International Industries, K array Surl, L-Acoustics, Loud Audio LLC, Meyer Sound Laboratories Inc., Nady Systems Inc., QSC LLC, Renkus Heinz Inc., RGB Systems Inc., Sony Group Corp. and Yamaha Corp.

Market Research Insights

  • Market dynamics are increasingly shaped by the need for integrated solutions within corporate audio ecosystems and professional audio reinforcement. The adoption of unified communication platforms has driven a 35% increase in demand for network-ready speakers, as enterprises upgrade their audiovisual infrastructure for hybrid work. These systems improve remote collaboration by ensuring consistent audio intelligibility.
  • However, buyer behavior analysis shows that over 50% of procurement decisions remain highly price-sensitive, placing pressure on vendor margins. Organizations are balancing the need for advanced features like multi-zone speaker arrays and live sound mixing capabilities against strict budget constraints.
  • This creates a competitive environment where value, defined by both performance and total cost of ownership, is paramount for success in commercial audio applications.

We can help! Our analysts can customize this professional speaker market research report to meet your requirements.

Get in touch

1. Executive Summary

1.1 Market overview

Executive Summary - Chart on Market Overview
Executive Summary - Data Table on Market Overview
Executive Summary - Chart on Global Market Characteristics
Executive Summary - Chart on Market by Geography
Executive Summary - Chart on Market Segmentation by Type
Executive Summary - Chart on Market Segmentation by Application
Executive Summary - Chart on Market Segmentation by Connectivity
Executive Summary - Chart on Incremental Growth
Executive Summary - Data Table on Incremental Growth
Executive Summary - Chart on Company Market Positioning

2. Technavio Analysis

2.1 Analysis of price sensitivity, lifecycle, customer purchase basket, adoption rates, and purchase criteria

2.2 Criticality of inputs and Factors of differentiation

Chart on Overview on criticality of inputs and factors of differentiation

2.3 Factors of disruption

Chart on Overview on factors of disruption

2.4 Impact of drivers and challenges

Chart on Impact of drivers and challenges in 2025 and 2030

3. Market Landscape

3.1 Market ecosystem

Chart on Parent Market
Data Table on - Parent Market

3.2 Market characteristics

Chart on Market characteristics analysis

3.3 Value chain analysis

Chart on Value chain analysis

4. Market Sizing

4.1 Market definition

Data Table on Offerings of companies included in the market definition

4.2 Market segment analysis

Market segments

4.3 Market size 2025

4.4 Market outlook: Forecast for 2025-2030

Chart on Global - Market size and forecast 2025-2030 ($ million)
Data Table on Global - Market size and forecast 2025-2030 ($ million)
Chart on Global Market: Year-over-year growth 2025-2030 (%)
Data Table on Global Market: Year-over-year growth 2025-2030 (%)

5. Historic Market Size

5.1 Global Professional Speaker Market 2020 - 2024

Historic Market Size - Data Table on Global Professional Speaker Market 2020 - 2024 ($ million)

5.2 Type segment analysis 2020 - 2024

Historic Market Size - Type Segment 2020 - 2024 ($ million)

5.3 Application segment analysis 2020 - 2024

Historic Market Size - Application Segment 2020 - 2024 ($ million)

5.4 Connectivity segment analysis 2020 - 2024

Historic Market Size - Connectivity Segment 2020 - 2024 ($ million)

5.5 Geography segment analysis 2020 - 2024

Historic Market Size - Geography Segment 2020 - 2024 ($ million)

5.6 Country segment analysis 2020 - 2024

Historic Market Size - Country Segment 2020 - 2024 ($ million)

6. Qualitative Analysis

6.1 Impact of AI in the Global Professional Speaker Market

7. Five Forces Analysis

7.1 Five forces summary

Five forces analysis - Comparison between 2025 and 2030

7.2 Bargaining power of buyers

Bargaining power of buyers - Impact of key factors 2025 and 2030

7.3 Bargaining power of suppliers

Bargaining power of suppliers - Impact of key factors in 2025 and 2030

7.4 Threat of new entrants

Threat of new entrants - Impact of key factors in 2025 and 2030

7.5 Threat of substitutes

Threat of substitutes - Impact of key factors in 2025 and 2030

7.6 Threat of rivalry

Threat of rivalry - Impact of key factors in 2025 and 2030

7.7 Market condition

Chart on Market condition - Five forces 2025 and 2030

8. Market Segmentation by Type

8.1 Market segments

Chart on Type - Market share 2025-2030 (%)
Data Table on Type - Market share 2025-2030 (%)

8.2 Comparison by Type

Chart on Comparison by Type
Data Table on Comparison by Type

8.3 Digital - Market size and forecast 2025-2030

Chart on Digital - Market size and forecast 2025-2030 ($ million)
Data Table on Digital - Market size and forecast 2025-2030 ($ million)
Chart on Digital - Year-over-year growth 2025-2030 (%)
Data Table on Digital - Year-over-year growth 2025-2030 (%)

8.4 Analog - Market size and forecast 2025-2030

Chart on Analog - Market size and forecast 2025-2030 ($ million)
Data Table on Analog - Market size and forecast 2025-2030 ($ million)
Chart on Analog - Year-over-year growth 2025-2030 (%)
Data Table on Analog - Year-over-year growth 2025-2030 (%)

8.5 Market opportunity by Type

Market opportunity by Type ($ million)
Data Table on Market opportunity by Type ($ million)

9. Market Segmentation by Application

9.1 Market segments

Chart on Application - Market share 2025-2030 (%)
Data Table on Application - Market share 2025-2030 (%)

9.2 Comparison by Application

Chart on Comparison by Application
Data Table on Comparison by Application

9.3 Music and entertainment - Market size and forecast 2025-2030

Chart on Music and entertainment - Market size and forecast 2025-2030 ($ million)
Data Table on Music and entertainment - Market size and forecast 2025-2030 ($ million)
Chart on Music and entertainment - Year-over-year growth 2025-2030 (%)
Data Table on Music and entertainment - Year-over-year growth 2025-2030 (%)

9.4 Corporate events - Market size and forecast 2025-2030

Chart on Corporate events - Market size and forecast 2025-2030 ($ million)
Data Table on Corporate events - Market size and forecast 2025-2030 ($ million)
Chart on Corporate events - Year-over-year growth 2025-2030 (%)
Data Table on Corporate events - Year-over-year growth 2025-2030 (%)

9.5 Public address systems - Market size and forecast 2025-2030

Chart on Public address systems - Market size and forecast 2025-2030 ($ million)
Data Table on Public address systems - Market size and forecast 2025-2030 ($ million)
Chart on Public address systems - Year-over-year growth 2025-2030 (%)
Data Table on Public address systems - Year-over-year growth 2025-2030 (%)

9.6 Others - Market size and forecast 2025-2030

Chart on Others - Market size and forecast 2025-2030 ($ million)
Data Table on Others - Market size and forecast 2025-2030 ($ million)
Chart on Others - Year-over-year growth 2025-2030 (%)
Data Table on Others - Year-over-year growth 2025-2030 (%)

9.7 Market opportunity by Application

Market opportunity by Application ($ million)
Data Table on Market opportunity by Application ($ million)

10. Market Segmentation by Connectivity

10.1 Market segments

Chart on Connectivity - Market share 2025-2030 (%)
Data Table on Connectivity - Market share 2025-2030 (%)

10.2 Comparison by Connectivity

Chart on Comparison by Connectivity
Data Table on Comparison by Connectivity

10.3 Wired - Market size and forecast 2025-2030

Chart on Wired - Market size and forecast 2025-2030 ($ million)
Data Table on Wired - Market size and forecast 2025-2030 ($ million)
Chart on Wired - Year-over-year growth 2025-2030 (%)
Data Table on Wired - Year-over-year growth 2025-2030 (%)

10.4 Wireless - Market size and forecast 2025-2030

Chart on Wireless - Market size and forecast 2025-2030 ($ million)
Data Table on Wireless - Market size and forecast 2025-2030 ($ million)
Chart on Wireless - Year-over-year growth 2025-2030 (%)
Data Table on Wireless - Year-over-year growth 2025-2030 (%)

10.5 Hybrid - Market size and forecast 2025-2030

Chart on Hybrid - Market size and forecast 2025-2030 ($ million)
Data Table on Hybrid - Market size and forecast 2025-2030 ($ million)
Chart on Hybrid - Year-over-year growth 2025-2030 (%)
Data Table on Hybrid - Year-over-year growth 2025-2030 (%)

10.6 Market opportunity by Connectivity

Market opportunity by Connectivity ($ million)
Data Table on Market opportunity by Connectivity ($ million)

11. Customer Landscape

11.1 Customer landscape overview

Analysis of price sensitivity, lifecycle, customer purchase basket, adoption rates, and purchase criteria

12. Geographic Landscape

12.1 Geographic segmentation

Chart on Market share by geography 2025-2030 (%)
Data Table on Market share by geography 2025-2030 (%)

12.2 Geographic comparison

Chart on Geographic comparison
Data Table on Geographic comparison

12.3 North America - Market size and forecast 2025-2030

Chart on North America - Market size and forecast 2025-2030 ($ million)
Data Table on North America - Market size and forecast 2025-2030 ($ million)
Chart on North America - Year-over-year growth 2025-2030 (%)
Data Table on North America - Year-over-year growth 2025-2030 (%)
Chart on Regional Comparison - North America
Data Table on Regional Comparison - North America

12.3.1 US - Market size and forecast 2025-2030

Chart on US - Market size and forecast 2025-2030 ($ million)
Data Table on US - Market size and forecast 2025-2030 ($ million)
Chart on US - Year-over-year growth 2025-2030 (%)
Data Table on US - Year-over-year growth 2025-2030 (%)

12.3.2 Canada - Market size and forecast 2025-2030

Chart on Canada - Market size and forecast 2025-2030 ($ million)
Data Table on Canada - Market size and forecast 2025-2030 ($ million)
Chart on Canada - Year-over-year growth 2025-2030 (%)
Data Table on Canada - Year-over-year growth 2025-2030 (%)

12.3.3 Mexico - Market size and forecast 2025-2030

Chart on Mexico - Market size and forecast 2025-2030 ($ million)
Data Table on Mexico - Market size and forecast 2025-2030 ($ million)
Chart on Mexico - Year-over-year growth 2025-2030 (%)
Data Table on Mexico - Year-over-year growth 2025-2030 (%)

12.4 Europe - Market size and forecast 2025-2030

Chart on Europe - Market size and forecast 2025-2030 ($ million)
Data Table on Europe - Market size and forecast 2025-2030 ($ million)
Chart on Europe - Year-over-year growth 2025-2030 (%)
Data Table on Europe - Year-over-year growth 2025-2030 (%)
Chart on Regional Comparison - Europe
Data Table on Regional Comparison - Europe

12.4.1 Germany - Market size and forecast 2025-2030

Chart on Germany - Market size and forecast 2025-2030 ($ million)
Data Table on Germany - Market size and forecast 2025-2030 ($ million)
Chart on Germany - Year-over-year growth 2025-2030 (%)
Data Table on Germany - Year-over-year growth 2025-2030 (%)

12.4.2 UK - Market size and forecast 2025-2030

Chart on UK - Market size and forecast 2025-2030 ($ million)
Data Table on UK - Market size and forecast 2025-2030 ($ million)
Chart on UK - Year-over-year growth 2025-2030 (%)
Data Table on UK - Year-over-year growth 2025-2030 (%)

12.4.3 France - Market size and forecast 2025-2030

Chart on France - Market size and forecast 2025-2030 ($ million)
Data Table on France - Market size and forecast 2025-2030 ($ million)
Chart on France - Year-over-year growth 2025-2030 (%)
Data Table on France - Year-over-year growth 2025-2030 (%)

12.4.4 Italy - Market size and forecast 2025-2030

Chart on Italy - Market size and forecast 2025-2030 ($ million)
Data Table on Italy - Market size and forecast 2025-2030 ($ million)
Chart on Italy - Year-over-year growth 2025-2030 (%)
Data Table on Italy - Year-over-year growth 2025-2030 (%)

12.4.5 Spain - Market size and forecast 2025-2030

Chart on Spain - Market size and forecast 2025-2030 ($ million)
Data Table on Spain - Market size and forecast 2025-2030 ($ million)
Chart on Spain - Year-over-year growth 2025-2030 (%)
Data Table on Spain - Year-over-year growth 2025-2030 (%)

12.4.6 The Netherlands - Market size and forecast 2025-2030

Chart on The Netherlands - Market size and forecast 2025-2030 ($ million)
Data Table on The Netherlands - Market size and forecast 2025-2030 ($ million)
Chart on The Netherlands - Year-over-year growth 2025-2030 (%)
Data Table on The Netherlands - Year-over-year growth 2025-2030 (%)

12.5 APAC - Market size and forecast 2025-2030

Chart on APAC - Market size and forecast 2025-2030 ($ million)
Data Table on APAC - Market size and forecast 2025-2030 ($ million)
Chart on APAC - Year-over-year growth 2025-2030 (%)
Data Table on APAC - Year-over-year growth 2025-2030 (%)
Chart on Regional Comparison - APAC
Data Table on Regional Comparison - APAC

12.5.1 China - Market size and forecast 2025-2030

Chart on China - Market size and forecast 2025-2030 ($ million)
Data Table on China - Market size and forecast 2025-2030 ($ million)
Chart on China - Year-over-year growth 2025-2030 (%)
Data Table on China - Year-over-year growth 2025-2030 (%)

12.5.2 India - Market size and forecast 2025-2030

Chart on India - Market size and forecast 2025-2030 ($ million)
Data Table on India - Market size and forecast 2025-2030 ($ million)
Chart on India - Year-over-year growth 2025-2030 (%)
Data Table on India - Year-over-year growth 2025-2030 (%)

12.5.3 Japan - Market size and forecast 2025-2030

Chart on Japan - Market size and forecast 2025-2030 ($ million)
Data Table on Japan - Market size and forecast 2025-2030 ($ million)
Chart on Japan - Year-over-year growth 2025-2030 (%)
Data Table on Japan - Year-over-year growth 2025-2030 (%)

12.5.4 South Korea - Market size and forecast 2025-2030

Chart on South Korea - Market size and forecast 2025-2030 ($ million)
Data Table on South Korea - Market size and forecast 2025-2030 ($ million)
Chart on South Korea - Year-over-year growth 2025-2030 (%)
Data Table on South Korea - Year-over-year growth 2025-2030 (%)

12.5.5 Australia - Market size and forecast 2025-2030

Chart on Australia - Market size and forecast 2025-2030 ($ million)
Data Table on Australia - Market size and forecast 2025-2030 ($ million)
Chart on Australia - Year-over-year growth 2025-2030 (%)
Data Table on Australia - Year-over-year growth 2025-2030 (%)

12.5.6 Indonesia - Market size and forecast 2025-2030

Chart on Indonesia - Market size and forecast 2025-2030 ($ million)
Data Table on Indonesia - Market size and forecast 2025-2030 ($ million)
Chart on Indonesia - Year-over-year growth 2025-2030 (%)
Data Table on Indonesia - Year-over-year growth 2025-2030 (%)

12.6 Middle East and Africa - Market size and forecast 2025-2030

Chart on Middle East and Africa - Market size and forecast 2025-2030 ($ million)
Data Table on Middle East and Africa - Market size and forecast 2025-2030 ($ million)
Chart on Middle East and Africa - Year-over-year growth 2025-2030 (%)
Data Table on Middle East and Africa - Year-over-year growth 2025-2030 (%)
Chart on Regional Comparison - Middle East and Africa
Data Table on Regional Comparison - Middle East and Africa

12.6.1 Saudi Arabia - Market size and forecast 2025-2030

Chart on Saudi Arabia - Market size and forecast 2025-2030 ($ million)
Data Table on Saudi Arabia - Market size and forecast 2025-2030 ($ million)
Chart on Saudi Arabia - Year-over-year growth 2025-2030 (%)
Data Table on Saudi Arabia - Year-over-year growth 2025-2030 (%)

12.6.2 UAE - Market size and forecast 2025-2030

Chart on UAE - Market size and forecast 2025-2030 ($ million)
Data Table on UAE - Market size and forecast 2025-2030 ($ million)
Chart on UAE - Year-over-year growth 2025-2030 (%)
Data Table on UAE - Year-over-year growth 2025-2030 (%)

12.6.3 South Africa - Market size and forecast 2025-2030

Chart on South Africa - Market size and forecast 2025-2030 ($ million)
Data Table on South Africa - Market size and forecast 2025-2030 ($ million)
Chart on South Africa - Year-over-year growth 2025-2030 (%)
Data Table on South Africa - Year-over-year growth 2025-2030 (%)

12.6.4 Israel - Market size and forecast 2025-2030

Chart on Israel - Market size and forecast 2025-2030 ($ million)
Data Table on Israel - Market size and forecast 2025-2030 ($ million)
Chart on Israel - Year-over-year growth 2025-2030 (%)
Data Table on Israel - Year-over-year growth 2025-2030 (%)

12.6.5 Turkey - Market size and forecast 2025-2030

Chart on Turkey - Market size and forecast 2025-2030 ($ million)
Data Table on Turkey - Market size and forecast 2025-2030 ($ million)
Chart on Turkey - Year-over-year growth 2025-2030 (%)
Data Table on Turkey - Year-over-year growth 2025-2030 (%)

12.7 South America - Market size and forecast 2025-2030

Chart on South America - Market size and forecast 2025-2030 ($ million)
Data Table on South America - Market size and forecast 2025-2030 ($ million)
Chart on South America - Year-over-year growth 2025-2030 (%)
Data Table on South America - Year-over-year growth 2025-2030 (%)
Chart on Regional Comparison - South America
Data Table on Regional Comparison - South America

12.7.1 Brazil - Market size and forecast 2025-2030

Chart on Brazil - Market size and forecast 2025-2030 ($ million)
Data Table on Brazil - Market size and forecast 2025-2030 ($ million)
Chart on Brazil - Year-over-year growth 2025-2030 (%)
Data Table on Brazil - Year-over-year growth 2025-2030 (%)

12.7.2 Argentina - Market size and forecast 2025-2030

Chart on Argentina - Market size and forecast 2025-2030 ($ million)
Data Table on Argentina - Market size and forecast 2025-2030 ($ million)
Chart on Argentina - Year-over-year growth 2025-2030 (%)
Data Table on Argentina - Year-over-year growth 2025-2030 (%)

12.7.3 Chile - Market size and forecast 2025-2030

Chart on Chile - Market size and forecast 2025-2030 ($ million)
Data Table on Chile - Market size and forecast 2025-2030 ($ million)
Chart on Chile - Year-over-year growth 2025-2030 (%)
Data Table on Chile - Year-over-year growth 2025-2030 (%)

12.8 Market opportunity by geography

Market opportunity by geography ($ million)
Data Tables on Market opportunity by geography ($ million)

13. Drivers, Challenges, and Opportunity

13.1 Market drivers

Growing demand from commercial and corporate sectors
Rising live concerts and event deployments globally
Increasing adoption of wireless digital audio technologies

13.2 Market challenges

High costs of advanced professional speaker systems
Complex system integration requiring skilled professionals
Rapid technology evolution increasing product obsolescence

13.3 Impact of drivers and challenges

Impact of drivers and challenges in 2025 and 2030

13.4 Market opportunities

Increasing use of speakers in esports events
Rising adoption of immersive and AI‑optimized audio
Replacement of outdated sound systems in nightclubs

14. Competitive Landscape

14.1 Overview

14.2

Overview on criticality of inputs and factors of differentiation

14.3 Landscape disruption

Overview on factors of disruption

14.4 Industry risks

Impact of key risks on business

15. Competitive Analysis

15.1 Companies profiled

Companies covered

15.2 Company ranking index

15.3 Market positioning of companies

Matrix on companies position and classification

15.4 AEB Industriale Srl

AEB Industriale Srl - Overview
AEB Industriale Srl - Product / Service
AEB Industriale Srl - Key offerings
SWOT

15.5 Biamp Systems LLC

Biamp Systems LLC - Overview
Biamp Systems LLC - Product / Service
Biamp Systems LLC - Key offerings
SWOT

15.6 Bose Corp.

Bose Corp. - Overview
Bose Corp. - Product / Service
Bose Corp. - Key news
Bose Corp. - Key offerings
SWOT

15.7 Bowers and Wilkins

Bowers and Wilkins - Overview
Bowers and Wilkins - Product / Service
Bowers and Wilkins - Key offerings
SWOT

15.8 CODA Audio GmbH

CODA Audio GmbH - Overview
CODA Audio GmbH - Product / Service
CODA Audio GmbH - Key offerings
SWOT

15.9 Dynaudio AS

Dynaudio AS - Overview
Dynaudio AS - Product / Service
Dynaudio AS - Key offerings
SWOT

15.10 Harman International Industries

Harman International Industries - Overview
Harman International Industries - Product / Service
Harman International Industries - Key offerings
SWOT

15.11 L-Acoustics

L-Acoustics - Overview
L-Acoustics - Product / Service
L-Acoustics - Key offerings
SWOT

15.12 Meyer Sound Laboratories Inc.

Meyer Sound Laboratories Inc. - Overview
Meyer Sound Laboratories Inc. - Product / Service
Meyer Sound Laboratories Inc. - Key offerings
SWOT

15.13 Nady Systems Inc.

Nady Systems Inc. - Overview
Nady Systems Inc. - Product / Service
Nady Systems Inc. - Key offerings
SWOT

15.14 QSC LLC

QSC LLC - Overview
QSC LLC - Product / Service
QSC LLC - Key offerings
SWOT

15.15 Renkus Heinz Inc.

Renkus Heinz Inc. - Overview
Renkus Heinz Inc. - Product / Service
Renkus Heinz Inc. - Key offerings
SWOT

15.16 RGB Systems Inc.

RGB Systems Inc. - Overview
RGB Systems Inc. - Product / Service
RGB Systems Inc. - Key offerings
SWOT

15.17 Sony Group Corp.

Sony Group Corp. - Overview
Sony Group Corp. - Business segments
Sony Group Corp. - Key offerings
Sony Group Corp. - Segment focus
SWOT

15.18 Yamaha Corp.

Yamaha Corp. - Overview
Yamaha Corp. - Business segments
Yamaha Corp. - Key news
Yamaha Corp. - Key offerings
Yamaha Corp. - Segment focus
SWOT

16. Appendix

16.1 Scope of the report

Market definition
Objectives
Notes and caveats

16.2 Inclusions and exclusions checklist

Inclusions checklist
Exclusions checklist

16.3 Currency conversion rates for US$

16.4 Research methodology

16.5 Data procurement

Information sources

16.6 Data validation

16.7 Validation techniques employed for market sizing

16.8 Data synthesis

16.9 360 degree market analysis

16.10 List of abbreviations

Research Methodology

Technavio presents a detailed picture of the market by way of study, synthesis, and summation of data from multiple sources. The analysts have presented the various facets of the market with a particular focus on identifying the key industry influencers. The data thus presented is comprehensive, reliable, and the result of extensive research, both primary and secondary.

INFORMATION SOURCES

Primary sources

  • Manufacturers and suppliers
  • Channel partners
  • Industry experts
  • Strategic decision makers

Secondary sources

  • Industry journals and periodicals
  • Government data
  • Financial reports of key industry players
  • Historical data
  • Press releases

DATA ANALYSIS

Data Synthesis

  • Collation of data
  • Estimation of key figures
  • Analysis of derived insights

Data Validation

  • Triangulation with data models
  • Reference against proprietary databases
  • Corroboration with industry experts

REPORT WRITING

Qualitative

  • Market drivers
  • Market challenges
  • Market trends
  • Five forces analysis

Quantitative

  • Market size and forecast
  • Market segmentation
  • Geographical insights
  • Competitive landscape

Interested in this report?

Get your sample now to see our research methodology and insights!

Download Now

Frequently Asked Questions

Professional Speaker market growth will increase by USD 637.4 million during 2026-2030.

The Professional Speaker market is expected to grow at a CAGR of 4.7% during 2026-2030.

Professional Speaker market is segmented by Type (Digital, Analog) Application (Music and entertainment, Corporate events, Public address systems, Others) Connectivity (Wired, Wireless, Hybrid)

AEB Industriale Srl, B and C Speakers SpA, Biamp Systems LLC, Bose Corp., Bowers and Wilkins, CELTO Acoustique Europe SRL, CODA Audio GmbH, d and b audiotechnik GmbH, Dynaudio AS, Harman International Industries, K array Surl, L-Acoustics, Loud Audio LLC, Meyer Sound Laboratories Inc., Nady Systems Inc., QSC LLC, Renkus Heinz Inc., RGB Systems Inc., Sony Group Corp., Yamaha Corp. are a few of the key vendors in the Professional Speaker market.

North America will register the highest growth rate of 38.8% among the other regions. Therefore, the Professional Speaker market in North America is expected to garner significant business opportunities for the vendors during the forecast period.

US, Canada, Mexico, Germany, UK, France, Italy, Spain, The Netherlands, China, India, Japan, South Korea, Australia, Indonesia, Saudi Arabia, UAE, South Africa, Israel, Turkey, Brazil, Argentina, Chile

  • Growing demand from commercial and corporate sectors is the driving factor this market.

The Professional Speaker market vendors should focus on grabbing business opportunities from the Type segment as it accounted for the largest market share in the base year.
RIA - Research AI Assistant
Ask RIA