Smart Stadium Market Size 2025-2029
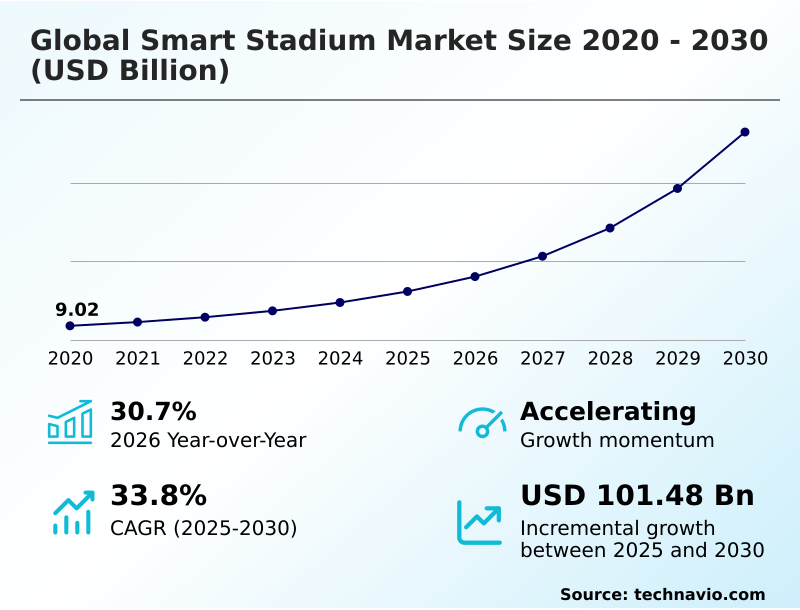
The smart stadium market size is valued to increase by USD 68 billion, at a CAGR of 30.9% from 2024 to 2029. Improved operational efficiency will drive the smart stadium market.
Major Market Trends & Insights
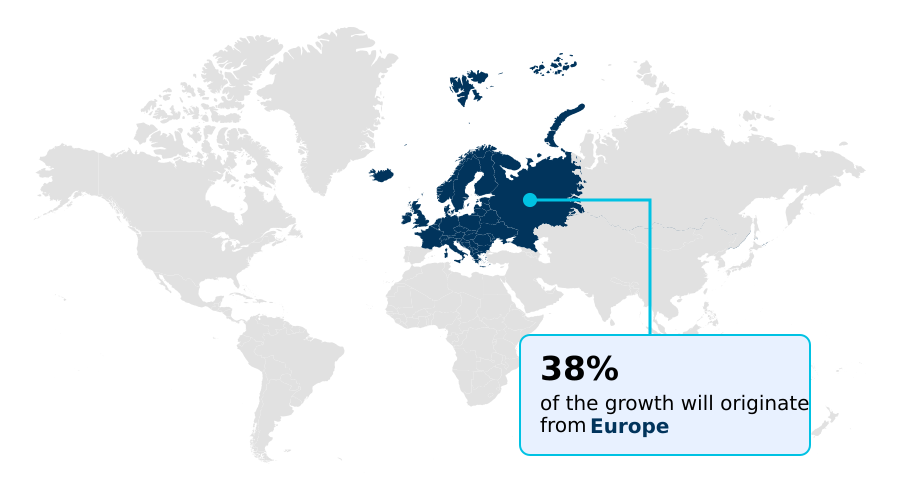
- Europe dominated the market and accounted for a 39% growth during the forecast period.
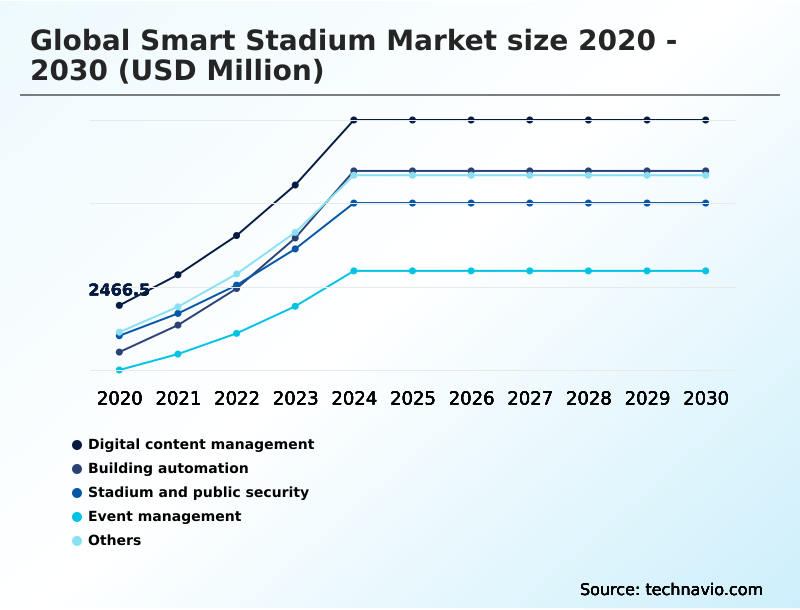
- By Software - Digital content management segment was valued at USD 1.99 billion in 2023
- By Deployment - On-premises segment accounted for the largest market revenue share in 2023
Market Size & Forecast
- Market Opportunities: USD 1.00 million
- Market Future Opportunities: USD 67999.20 million
- CAGR from 2024 to 2029 : 30.9%
Market Summary
- The market is experiencing significant growth, with an estimated 30,000 stadiums worldwide expected to adopt smart technologies by 2025. This expansion is driven by the increasing demand for enhanced fan experiences, improved operational efficiency, and the emergence of augmented reality (AR) in stadiums. The integration of AR technology enables fans to access real-time statistics, player information, and interactive games, creating a more engaging and immersive environment.
- However, the high initial investment required for implementing these advanced systems poses a challenge for some stadiums. Despite this hurdle, the market's future direction remains promising, as stadiums continue to seek ways to differentiate themselves and provide unique experiences for their audiences.
What will be the Size of the Smart Stadium Market during the forecast period?

Get Key Insights on Market Forecast (PDF) Request Free Sample
How is the Smart Stadium Market Segmented ?
The smart stadium industry research report provides comprehensive data (region-wise segment analysis), with forecasts and estimates in "USD million" for the period 2025-2029, as well as historical data from 2019-2023 for the following segments.
- Software
- Digital content management
- Building automation
- Stadium and public security
- Event management
- Others
- Deployment
- Stadium Type
- Geography
- North America
- Europe
- France
- Germany
- Italy
- Spain
- The Netherlands
- UK
- APAC
- Rest of World (ROW)
By Software Insights
The digital content management segment is estimated to witness significant growth during the forecast period.
The market is a dynamic and ever-evolving industry, characterized by the integration of advanced technologies to enhance the spectator experience and optimize venue operations. Smart Stadiums employ concession stand management systems, real-time data analytics, and sustainable practices, such as automated lighting control and energy management systems. These innovations contribute to operational efficiency metrics, reducing costs and improving fan engagement. Moreover, data visualization dashboards and predictive maintenance systems enable stadium management to monitor and analyze spectator experience metrics, crowd management systems, and emergency response systems in real-time. Digital twin technology, fan engagement platforms, and mobile ticketing platforms facilitate seamless communication between fans and staff, ensuring a more personalized experience.
Security is a top priority, with integrated security platforms, network infrastructure, data privacy regulations, cybersecurity protocols, and access control systems ensuring a safe and secure environment. The implementation of IoT sensor networks and staff productivity tracking systems further optimizes venue operations, while fan behavior analytics and audio-visual systems create immersive experiences. According to recent statistics, over 70% of stadiums have adopted digital signage displays for advertising and communication purposes. These displays are essential for revenue generation strategies, providing a platform for sponsor advertisements and promotions. Additionally, high-definition cameras, payment processing systems, and parking management solutions ensure a smooth fan experience.
Overall, the market is revolutionizing the way we enjoy live sports and entertainment, offering a more connected, efficient, and enjoyable experience for all.

Request Free Sample
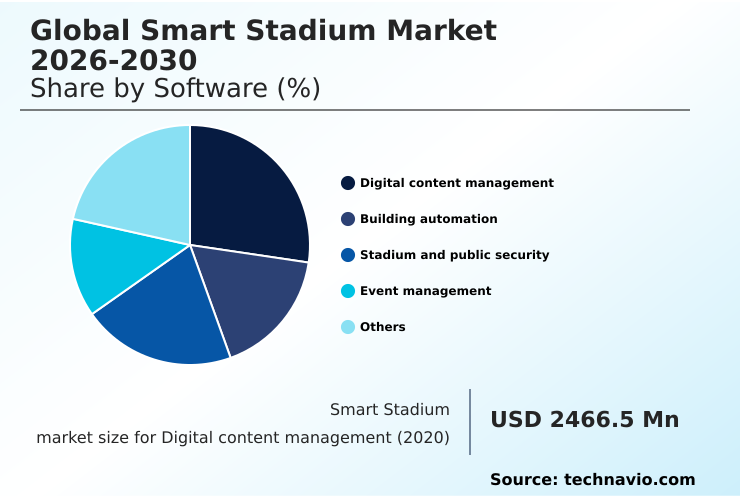
The Digital content management segment was valued at USD 1.99 billion in 2019 and showed a gradual increase during the forecast period.

Request Free Sample
Regional Analysis
Europe is estimated to contribute 39% to the growth of the global market during the forecast period.Technavio's analysts have elaborately explained the regional trends and drivers that shape the market during the forecast period.

See How Smart Stadium Market Demand is Rising in Europe Request Free Sample
Europe, a prominent global sporting destination, plays a significant role in the evolving the market. With the European Union (EU) countries leading the Olympic medal tally, the region's immense popularity of various sports leagues fuels market growth. Notable leagues, such as the PREMIER LEAGUE and The Championships, Wimbledon, attract millions of fans. The increasing demand for fan engagement through technology is a primary factor driving this trend.
Sports fans, particularly those in Western Europe belonging to Generation Z, are accustomed to hyper-digital connectivity, customer centricity, and convenience. This demographic's preferences are shaping the future of smart stadiums in Europe.
Market Dynamics
Our researchers analyzed the data with 2024 as the base year, along with the key drivers, trends, and challenges. A holistic analysis of drivers will help companies refine their marketing strategies to gain a competitive advantage.
The market is experiencing significant growth as sports and entertainment venues integrate IoT sensors into their operations for real-time data analysis, enabling improved decision-making and enhanced fan experiences. The deployment of 5G networks ensures seamless connectivity for these advanced systems, while AI-driven predictive maintenance keeps stadium infrastructure in optimal condition. Facial recognition technology is being implemented for security enhancement, providing a more efficient and secure environment for attendees. Digital signage is used for improved wayfinding and advertising, while mobile ticketing platforms facilitate seamless transactions. Energy management systems are being optimized for cost reduction, and fan engagement platforms enhance communication between teams and fans.
High-definition cameras are deployed for improved security, access control systems manage crowds efficiently, and network infrastructure is upgraded for seamless operations. Data visualization dashboards provide efficient monitoring, while integrated security platforms ensure comprehensive security. Environmental monitoring enhances sustainability efforts, automated lighting control promotes energy efficiency, and wireless communication protocols optimize network performance. Venue operations management software and CRM strategies are implemented to improve engagement and streamline processes. Digital twin creation offers accurate simulation and optimization of stadium operations, ensuring a more efficient and effective use of resources. The market continues to evolve, offering innovative solutions for sports and entertainment venues to enhance fan experiences, optimize operations, and reduce costs.

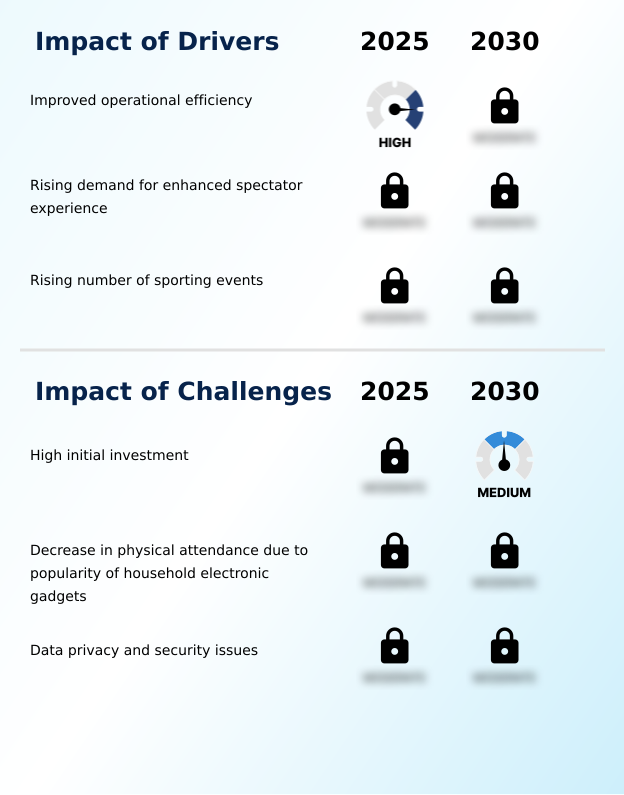
What are the key market drivers leading to the rise in the adoption of Smart Stadium Industry?
- The imperative for enhanced operational efficiency serves as the primary market catalyst.
- Smart stadium solutions have revolutionized the way stadium management is conducted, enhancing operational efficiency and sustainability. These advanced technologies enable stadium authorities to optimize energy usage, manage building systems, and automate various processes. For instance, temperature control is a significant aspect of stadium management, and smart stadiums allow for real-time monitoring and adjustment. Moreover, lighting conditions can be adjusted based on crowd size, ensuring energy efficiency. Centralized building management systems offer a unified console for managing the entire stadium, reducing operational costs and maximizing efficiency.
- Furthermore, integrating smart stadium solutions with external departments, such as weather and public transport, provides spectators with real-time information on weather conditions and transportation schedules. This data-driven approach to stadium management is a game-changer, offering numerous benefits and continuously evolving to meet the needs of various sectors.
What are the market trends shaping the Smart Stadium Industry?
- Augmented reality (AR) is emerging as the next market trend in stadium experiences. This technological innovation enhances fan engagement and enriches the live event atmosphere.
- The integration of augmented reality (AR) technology in the sports industry is gaining momentum, offering an immersive experience for spectators. Users can engage with AR applications on their devices, enhancing their visit to stadiums. These tools provide real-time access to player statistics, referee decisions, and multiple camera angles for action replays. Moreover, stadium management can leverage AR for revenue generation through online auctions and merchandise sales.
- The sports sector's adoption of AR is continuously evolving, with applications offering new features and functionalities. For instance, AR can help spectators visualize individual players on the field, providing a more interactive and engaging experience. The potential of AR in sports is significant, with applications spanning from spectator engagement to operational efficiency.
What challenges does the Smart Stadium Industry face during its growth?
- A significant barrier to industry expansion is the high upfront investment required.
- Smart stadiums, characterized by advanced technology integration, represent a significant investment for sports and entertainment venues. The implementation of these solutions necessitates substantial upgrades to existing infrastructure, encompassing hardware acquisitions, such as Wi-Fi and distributed antenna systems, building management software, and interactive displays. These expenses can total millions of dollars, with ongoing maintenance costs adding to the financial burden. Furthermore, the frequency of live events at stadiums can be limited, with some hosting as few as one or two events per month.
- This extended period between events can prolong the time to recoup the initial investment. Despite these challenges, the market continues to evolve, driven by the growing demand for enhanced fan experiences and operational efficiency.
Exclusive Technavio Analysis on Customer Landscape
The smart stadium market forecasting report includes the adoption lifecycle of the market, covering from the innovator's stage to the laggard's stage. It focuses on adoption rates in different regions based on penetration. Furthermore, the smart stadium market report also includes key purchase criteria and drivers of price sensitivity to help companies evaluate and develop their market growth analysis strategies.

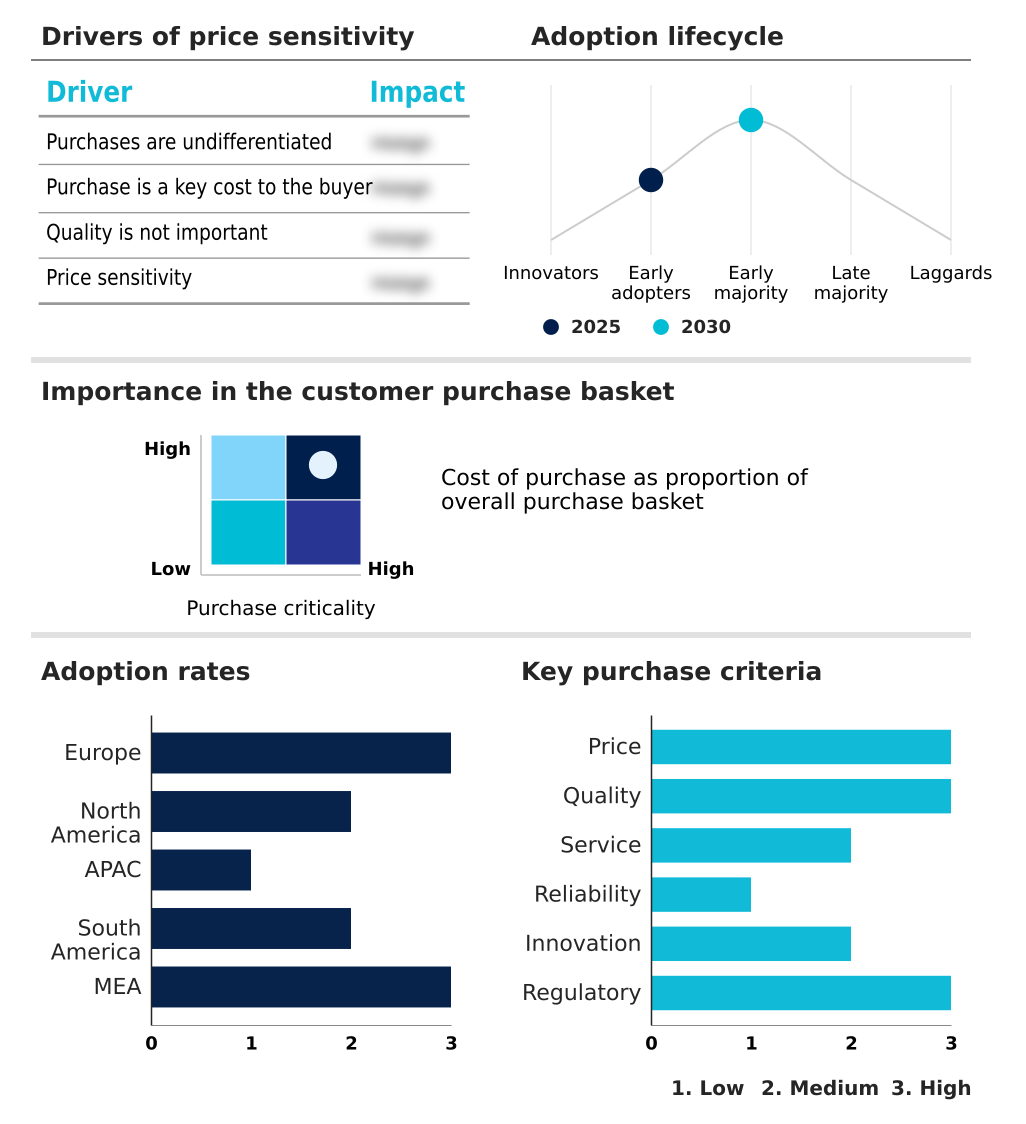
Customer Landscape of Smart Stadium Industry
Competitive Landscape
Companies are implementing various strategies, such as strategic alliances, smart stadium market forecast, partnerships, mergers and acquisitions, geographical expansion, and product/service launches, to enhance their presence in the industry.
Avaya LLC - This company innovatively delivers a mobile app for sports teams, enhancing fan engagement. It digitizes the experience before, during, and after games, offering features that cater to fan needs and preferences. The app bridges the gap between teams and fans, fostering a stronger connection.
The industry research and growth report includes detailed analyses of the competitive landscape of the market and information about key companies, including:
- Avaya LLC
- Cisco Systems Inc.
- DB Schenker
- Dell Technologies Inc.
- Dignia Systems Ltd.
- DS worldwide Ltd.
- GP Smart Stadium
- Hawk Eye Innovations Ltd.
- Hewlett Packard Enterprise Co.
- Honeywell International Inc.
- Huawei Technologies Co. Ltd.
- Infosys Ltd.
- Intel Corp.
- International Business Machines Corp.
- Johnson Controls International Plc
- Lumen Technologies Inc.
- NEC Corp.
- Nippon Telegraph and Telephone Corp.
- Telefonaktiebolaget LM Ericsson
- Weblib
- Schneider Electric SE
- Fujitsu
Qualitative and quantitative analysis of companies has been conducted to help clients understand the wider business environment as well as the strengths and weaknesses of key industry players. Data is qualitatively analyzed to categorize companies as pure play, category-focused, industry-focused, and diversified; it is quantitatively analyzed to categorize companies as dominant, leading, strong, tentative, and weak.
Recent Development and News in Smart Stadium Market
- In January 2024, Intel and Major League Soccer (MLS) announced a strategic partnership to deploy Intel's technology solutions in MLS stadiums, aiming to enhance fan experiences through real-time analytics and personalized services (Intel press release).
- In March 2024, IBM and Arsenal Football Club unveiled a new smart stadium project at the Emirates Stadium, integrating IBM's Watson AI technology for predictive analytics and fan engagement (IBM press release).
- In April 2025, Panasonic Corporation announced a USD100 million investment in its North American smart stadium business, aiming to expand its market presence and offer advanced technologies such as facial recognition, contactless payments, and dynamic signage (Panasonic press release).
- In May 2025, the European Commission approved the Horizon 2020 project "SmartStadia," a collaborative initiative to develop and deploy smart stadium technologies across Europe, with a focus on energy efficiency, fan experience, and public safety (European Commission press release).
Dive into Technavio's robust research methodology, blending expert interviews, extensive data synthesis, and validated models for unparalleled Smart Stadium Market insights. See full methodology.
|
Market Scope
|
|
Report Coverage
|
Details
|
|
Page number
|
217
|
|
Base year
|
2024
|
|
Historic period
|
2019-2023 |
|
Forecast period
|
2025-2029
|
|
Growth momentum & CAGR
|
Accelerate at a CAGR of 30.9%
|
|
Market growth 2025-2029
|
USD 67999.2 million
|
|
Market structure
|
Fragmented
|
|
YoY growth 2024-2025(%)
|
29.4
|
|
Key countries
|
US, UK, Germany, Canada, France, Italy, China, Japan, The Netherlands, and Spain
|
|
Competitive landscape
|
Leading Companies, Market Positioning of Companies, Competitive Strategies, and Industry Risks
|
Request Free Sample
Research Analyst Overview
- The market continues to evolve, integrating advanced technologies to enhance fan experiences and optimize operational efficiency. Real-time data analytics plays a crucial role, enabling concession stand management to adapt to crowd fluctuations and ensure optimal inventory levels. Sustainable practices implementation, such as automated lighting control and energy management systems, reduce environmental impact. Spectator experience metrics, monitored through data visualization dashboards, provide insights into fan behavior and preferences. Digital twin technology and IoT sensor networks facilitate predictive maintenance, ensuring emergency response systems are always ready. Payment processing systems and mobile ticketing platforms streamline entry and transaction processes. Integrated security platforms, including cybersecurity protocols and access control systems, prioritize fan safety.
- Network infrastructure and wireless communication protocols ensure seamless connectivity for digital signage displays, fan engagement platforms, and customer relationship management systems. Environmental monitoring systems and revenue generation strategies, such as dynamic pricing and targeted advertising, contribute to the overall sustainability and profitability of smart stadiums. The market is expected to grow at a significant rate, with industry experts projecting a 15% annual increase in smart stadium installations. For instance, a major sports venue implemented a comprehensive smart stadium solution, resulting in a 25% increase in fan engagement and a 10% rise in revenue. This success story underscores the potential of smart stadiums to transform the spectator experience while promoting sustainable practices and operational efficiency.
What are the Key Data Covered in this Smart Stadium Market Research and Growth Report?
-
What is the expected growth of the Smart Stadium Market between 2025 and 2029?
-
What segmentation does the market report cover?
-
The report is segmented by Software (Digital content management, Building automation, Stadium and public security, Event management, and Others), Deployment (On-premises and Cloud-based), Geography (Europe, North America, APAC, South America, and Middle East and Africa), and Stadium Type (Outdoor and Indoor)
-
Which regions are analyzed in the report?
-
Europe, North America, APAC, South America, and Middle East and Africa
-
What are the key growth drivers and market challenges?
-
Who are the major players in the Smart Stadium Market?
-
Avaya LLC, Cisco Systems Inc., DB Schenker, Dell Technologies Inc., Dignia Systems Ltd., DS worldwide Ltd., GP Smart Stadium, Hawk Eye Innovations Ltd., Hewlett Packard Enterprise Co., Honeywell International Inc., Huawei Technologies Co. Ltd., Infosys Ltd., Intel Corp., International Business Machines Corp., Johnson Controls International Plc, Lumen Technologies Inc., NEC Corp., Nippon Telegraph and Telephone Corp., Telefonaktiebolaget LM Ericsson, Weblib, Schneider Electric SE, and Fujitsu
Market Research Insights
- The market for smart stadiums continues to evolve, integrating advanced technologies to enhance fan experiences and streamline operations. Two notable developments include the implementation of power consumption monitoring systems, reducing energy usage by up to 30%, and the integration of accessibility features, ensuring equal access for all attendees. Industry experts anticipate a growth rate of approximately 15% annually in the coming years, as more stadiums adopt these innovative solutions.
- For instance, a major sports venue saw a sales increase of 22% after implementing an interactive mobile application, offering personalized experiences and real-time event information to fans.
We can help! Our analysts can customize this smart stadium market research report to meet your requirements.
Get in touch
1 Executive Summary
- 1.1 Market overview
- Executive Summary - Chart on Market Overview
- Executive Summary - Data Table on Market Overview
- Executive Summary - Chart on Global Market Characteristics
- Executive Summary - Chart on Market by Geography
- Executive Summary - Chart on Market Segmentation by Software
- Executive Summary - Chart on Market Segmentation by Deployment
- Executive Summary - Chart on Incremental Growth
- Executive Summary - Data Table on Incremental Growth
- Executive Summary - Chart on Company Market Positioning
2 Technavio Analysis
- 2.1 Analysis of price sensitivity, lifecycle, customer purchase basket, adoption rates, and purchase criteria
- Analysis of price sensitivity, lifecycle, customer purchase basket, adoption rates, and purchase criteria
- 2.2 Criticality of inputs and Factors of differentiation
- Overview on criticality of inputs and factors of differentiation
- 2.3 Factors of disruption
- Overview on factors of disruption
- 2.4 Impact of drivers and challenges
- Impact of drivers and challenges in 2024 and 2029
3 Market Landscape
- 3.1 Market ecosystem
- Parent Market
- Data Table on - Parent Market
- 3.2 Market characteristics
- Market characteristics analysis
4 Market Sizing
- 4.1 Market definition
- Offerings of companies included in the market definition
- 4.2 Market segment analysis
- 4.4 Market outlook: Forecast for 2024-2029
- Chart on Global - Market size and forecast 2024-2029 ($ million)
- Data Table on Global - Market size and forecast 2024-2029 ($ million)
- Chart on Global Market: Year-over-year growth 2024-2029 (%)
- Data Table on Global Market: Year-over-year growth 2024-2029 (%)
5 Historic Market Size
- 5.1 Global Smart Stadium Market 2019 - 2023
- Historic Market Size - Data Table on Global Smart Stadium Market 2019 - 2023 ($ million)
- 5.2 Software segment analysis 2019 - 2023
- Historic Market Size - Software Segment 2019 - 2023 ($ million)
- 5.3 Deployment segment analysis 2019 - 2023
- Historic Market Size - Deployment Segment 2019 - 2023 ($ million)
- 5.4 Geography segment analysis 2019 - 2023
- Historic Market Size - Geography Segment 2019 - 2023 ($ million)
- 5.5 Country segment analysis 2019 - 2023
- Historic Market Size - Country Segment 2019 - 2023 ($ million)
6 Qualitative Analysis
- 6.1 Impact of AI On The Global Smart Stadium Market
7 Five Forces Analysis
- 7.1 Five forces summary
- Five forces analysis - Comparison between 2024 and 2029
- 7.2 Bargaining power of buyers
- Bargaining power of buyers - Impact of key factors 2024 and 2029
- 7.3 Bargaining power of suppliers
- Bargaining power of suppliers - Impact of key factors in 2024 and 2029
- 7.4 Threat of new entrants
- Threat of new entrants - Impact of key factors in 2024 and 2029
- 7.5 Threat of substitutes
- Threat of substitutes - Impact of key factors in 2024 and 2029
- 7.6 Threat of rivalry
- Threat of rivalry - Impact of key factors in 2024 and 2029
- 7.7 Market condition
- Chart on Market condition - Five forces 2024 and 2029
8 Market Segmentation by Software
- 8.1 Market segments
- Chart on Software - Market share (2024-2029) (%)
- Data Table on Software - Market share (2024-2029) (%)
- 8.2 Comparison by Software
- Chart on Comparison by Software
- Data Table on Comparison by Software
- 8.3 Digital content management - Market size and forecast (2024-2029)
- Chart on Digital content management - Market size and forecast (2024-2029) ($ million)
- Data Table on Digital content management - Market size and forecast (2024-2029) ($ million)
- Chart on Digital content management - Year-over-year growth (2024-2029) (%)
- Data Table on Digital content management - Year-over-year growth (2024-2029) (%)
- 8.4 Building automation - Market size and forecast (2024-2029)
- Chart on Building automation - Market size and forecast (2024-2029) ($ million)
- Data Table on Building automation - Market size and forecast (2024-2029) ($ million)
- Chart on Building automation - Year-over-year growth (2024-2029) (%)
- Data Table on Building automation - Year-over-year growth (2024-2029) (%)
- 8.5 Stadium and public security - Market size and forecast (2024-2029)
- Chart on Stadium and public security - Market size and forecast (2024-2029) ($ million)
- Data Table on Stadium and public security - Market size and forecast (2024-2029) ($ million)
- Chart on Stadium and public security - Year-over-year growth (2024-2029) (%)
- Data Table on Stadium and public security - Year-over-year growth (2024-2029) (%)
- 8.6 Event management - Market size and forecast (2024-2029)
- Chart on Event management - Market size and forecast (2024-2029) ($ million)
- Data Table on Event management - Market size and forecast (2024-2029) ($ million)
- Chart on Event management - Year-over-year growth (2024-2029) (%)
- Data Table on Event management - Year-over-year growth (2024-2029) (%)
- 8.7 Others - Market size and forecast (2024-2029)
- Chart on Others - Market size and forecast (2024-2029) ($ million)
- Data Table on Others - Market size and forecast (2024-2029) ($ million)
- Chart on Others - Year-over-year growth (2024-2029) (%)
- Data Table on Others - Year-over-year growth (2024-2029) (%)
- 8.8 Market opportunity by Software
- Market opportunity by Software ($ million)
- Data Table on Market opportunity by Software ($ million)
9 Market Segmentation by Deployment
- 9.1 Market segments
- Chart on Deployment - Market share (2024-2029) (%)
- Data Table on Deployment - Market share (2024-2029) (%)
- 9.2 Comparison by Deployment
- Chart on Comparison by Deployment
- Data Table on Comparison by Deployment
- 9.3 On-premises - Market size and forecast (2024-2029)
- Chart on On-premises - Market size and forecast (2024-2029) ($ million)
- Data Table on On-premises - Market size and forecast (2024-2029) ($ million)
- Chart on On-premises - Year-over-year growth (2024-2029) (%)
- Data Table on On-premises - Year-over-year growth (2024-2029) (%)
- 9.4 Cloud-based - Market size and forecast (2024-2029)
- Chart on Cloud-based - Market size and forecast (2024-2029) ($ million)
- Data Table on Cloud-based - Market size and forecast (2024-2029) ($ million)
- Chart on Cloud-based - Year-over-year growth (2024-2029) (%)
- Data Table on Cloud-based - Year-over-year growth (2024-2029) (%)
- 9.5 Market opportunity by Deployment
- Market opportunity by Deployment ($ million)
- Data Table on Market opportunity by Deployment ($ million)
10 Market Segmentation by Stadium Type
- 10.1 Market segments
- Chart on Stadium Type - Market share (2024-2029) (%)
- Data Table on Stadium Type - Market share (2024-2029) (%)
- 10.2 Comparison by Stadium Type
- Chart on Comparison by Stadium Type
- Data Table on Comparison by Stadium Type
- 10.3 Outdoor - Market size and forecast (2024-2029)
- Chart on Outdoor - Market size and forecast (2024-2029) ($ million)
- Data Table on Outdoor - Market size and forecast (2024-2029) ($ million)
- Chart on Outdoor - Year-over-year growth (2024-2029) (%)
- Data Table on Outdoor - Year-over-year growth (2024-2029) (%)
- 10.4 Indoor - Market size and forecast (2024-2029)
- Chart on Indoor - Market size and forecast (2024-2029) ($ million)
- Data Table on Indoor - Market size and forecast (2024-2029) ($ million)
- Chart on Indoor - Year-over-year growth (2024-2029) (%)
- Data Table on Indoor - Year-over-year growth (2024-2029) (%)
- 10.5 Market opportunity by Stadium Type
- Market opportunity by Stadium Type ($ million)
- Data Table on Market opportunity by Stadium Type ($ million)
11 Customer Landscape
- 11.1 Customer landscape overview
- Analysis of price sensitivity, lifecycle, customer purchase basket, adoption rates, and purchase criteria
12 Geographic Landscape
- 12.1 Geographic segmentation
- Chart on Market share by geography 2024-2029 (%)
- Data Table on Market share by geography 2024-2029 (%)
- 12.2 Geographic comparison
- Chart on Geographic comparison
- Data Table on Geographic comparison
- 12.3 Europe - Market size and forecast 2024-2029
- Chart on Europe - Market size and forecast 2024-2029 ($ million)
- Data Table on Europe - Market size and forecast 2024-2029 ($ million)
- Chart on Europe - Year-over-year growth 2024-2029 (%)
- Data Table on Europe - Year-over-year growth 2024-2029 (%)
- 12.4 North America - Market size and forecast 2024-2029
- Chart on North America - Market size and forecast 2024-2029 ($ million)
- Data Table on North America - Market size and forecast 2024-2029 ($ million)
- Chart on North America - Year-over-year growth 2024-2029 (%)
- Data Table on North America - Year-over-year growth 2024-2029 (%)
- 12.5 APAC - Market size and forecast 2024-2029
- Chart on APAC - Market size and forecast 2024-2029 ($ million)
- Data Table on APAC - Market size and forecast 2024-2029 ($ million)
- Chart on APAC - Year-over-year growth 2024-2029 (%)
- Data Table on APAC - Year-over-year growth 2024-2029 (%)
- 12.6 South America - Market size and forecast 2024-2029
- Chart on South America - Market size and forecast 2024-2029 ($ million)
- Data Table on South America - Market size and forecast 2024-2029 ($ million)
- Chart on South America - Year-over-year growth 2024-2029 (%)
- Data Table on South America - Year-over-year growth 2024-2029 (%)
- 12.7 Middle East and Africa - Market size and forecast 2024-2029
- Chart on Middle East and Africa - Market size and forecast 2024-2029 ($ million)
- Data Table on Middle East and Africa - Market size and forecast 2024-2029 ($ million)
- Chart on Middle East and Africa - Year-over-year growth 2024-2029 (%)
- Data Table on Middle East and Africa - Year-over-year growth 2024-2029 (%)
- 12.8 US - Market size and forecast 2024-2029
- Chart on US - Market size and forecast 2024-2029 ($ million)
- Data Table on US - Market size and forecast 2024-2029 ($ million)
- Chart on US - Year-over-year growth 2024-2029 (%)
- Data Table on US - Year-over-year growth 2024-2029 (%)
- 12.9 UK - Market size and forecast 2024-2029
- Chart on UK - Market size and forecast 2024-2029 ($ million)
- Data Table on UK - Market size and forecast 2024-2029 ($ million)
- Chart on UK - Year-over-year growth 2024-2029 (%)
- Data Table on UK - Year-over-year growth 2024-2029 (%)
- 12.10 Germany - Market size and forecast 2024-2029
- Chart on Germany - Market size and forecast 2024-2029 ($ million)
- Data Table on Germany - Market size and forecast 2024-2029 ($ million)
- Chart on Germany - Year-over-year growth 2024-2029 (%)
- Data Table on Germany - Year-over-year growth 2024-2029 (%)
- 12.11 Canada - Market size and forecast 2024-2029
- Chart on Canada - Market size and forecast 2024-2029 ($ million)
- Data Table on Canada - Market size and forecast 2024-2029 ($ million)
- Chart on Canada - Year-over-year growth 2024-2029 (%)
- Data Table on Canada - Year-over-year growth 2024-2029 (%)
- 12.12 France - Market size and forecast 2024-2029
- Chart on France - Market size and forecast 2024-2029 ($ million)
- Data Table on France - Market size and forecast 2024-2029 ($ million)
- Chart on France - Year-over-year growth 2024-2029 (%)
- Data Table on France - Year-over-year growth 2024-2029 (%)
- 12.13 China - Market size and forecast 2024-2029
- Chart on China - Market size and forecast 2024-2029 ($ million)
- Data Table on China - Market size and forecast 2024-2029 ($ million)
- Chart on China - Year-over-year growth 2024-2029 (%)
- Data Table on China - Year-over-year growth 2024-2029 (%)
- 12.14 Italy - Market size and forecast 2024-2029
- Chart on Italy - Market size and forecast 2024-2029 ($ million)
- Data Table on Italy - Market size and forecast 2024-2029 ($ million)
- Chart on Italy - Year-over-year growth 2024-2029 (%)
- Data Table on Italy - Year-over-year growth 2024-2029 (%)
- 12.15 Japan - Market size and forecast 2024-2029
- Chart on Japan - Market size and forecast 2024-2029 ($ million)
- Data Table on Japan - Market size and forecast 2024-2029 ($ million)
- Chart on Japan - Year-over-year growth 2024-2029 (%)
- Data Table on Japan - Year-over-year growth 2024-2029 (%)
- 12.16 The Netherlands - Market size and forecast 2024-2029
- Chart on The Netherlands - Market size and forecast 2024-2029 ($ million)
- Data Table on The Netherlands - Market size and forecast 2024-2029 ($ million)
- Chart on The Netherlands - Year-over-year growth 2024-2029 (%)
- Data Table on The Netherlands - Year-over-year growth 2024-2029 (%)
- 12.17 Spain - Market size and forecast 2024-2029
- Chart on Spain - Market size and forecast 2024-2029 ($ million)
- Data Table on Spain - Market size and forecast 2024-2029 ($ million)
- Chart on Spain - Year-over-year growth 2024-2029 (%)
- Data Table on Spain - Year-over-year growth 2024-2029 (%)
- 12.18 Market opportunity by geography
- Market opportunity by geography ($ million)
- Data Tables on Market opportunity by geography ($ million)
- 12.19 Rest of World (ROW) - Market size and forecast (2024-2029)
- Chart on Rest of World (ROW) - Market size and forecast (2024-2029) ($ million)
- Data Table on Rest of World (ROW) - Market size and forecast (2024-2029) ($ million)
- Chart on Rest of World (ROW) - Year-over-year growth (2024-2029) (%)
- Data Table on Rest of World (ROW) - Year-over-year growth (2024-2029) (%)
13 Drivers, Challenges, and Opportunity/Restraints
- 13.3 Impact of drivers and challenges
- Impact of drivers and challenges in 2024 and 2029
- 13.4 Market opportunities/restraints
14 Competitive Landscape
- 14.2 Competitive Landscape
- Overview on criticality of inputs and factors of differentiation
- 14.3 Landscape disruption
- Overview on factors of disruption
- 14.4 Industry risks
- Impact of key risks on business
15 Competitive Analysis
- 15.2 Market positioning of companies
- Matrix on companies position and classification
- 15.3 Avaya LLC
- Avaya LLC - Overview
- Avaya LLC - Product / Service
- Avaya LLC - Key offerings
- 15.4 Cisco Systems Inc.
- Cisco Systems Inc. - Overview
- Cisco Systems Inc. - Product / Service
- Cisco Systems Inc. - Key offerings
- 15.5 DB Schenker
- DB Schenker - Overview
- DB Schenker - Product / Service
- DB Schenker - Key offerings
- 15.6 Dell Technologies Inc.
- Dell Technologies Inc. - Overview
- Dell Technologies Inc. - Product / Service
- Dell Technologies Inc. - Key offerings
- 15.7 Dignia Systems Ltd.
- Dignia Systems Ltd. - Overview
- Dignia Systems Ltd. - Product / Service
- Dignia Systems Ltd. - Key offerings
- 15.8 DS worldwide Ltd.
- DS worldwide Ltd. - Overview
- DS worldwide Ltd. - Product / Service
- DS worldwide Ltd. - Key offerings
- 15.9 GP Smart Stadium
- GP Smart Stadium - Overview
- GP Smart Stadium - Product / Service
- GP Smart Stadium - Key offerings
- 15.10 Hawk Eye Innovations Ltd.
- Hawk Eye Innovations Ltd. - Overview
- Hawk Eye Innovations Ltd. - Product / Service
- Hawk Eye Innovations Ltd. - Key offerings
- 15.11 Hewlett Packard Enterprise Co.
- Hewlett Packard Enterprise Co. - Overview
- Hewlett Packard Enterprise Co. - Product / Service
- Hewlett Packard Enterprise Co. - Key offerings
- 15.12 Honeywell International Inc.
- Honeywell International Inc. - Overview
- Honeywell International Inc. - Product / Service
- Honeywell International Inc. - Key offerings
- 15.13 Huawei Technologies Co. Ltd.
- Huawei Technologies Co. Ltd. - Overview
- Huawei Technologies Co. Ltd. - Product / Service
- Huawei Technologies Co. Ltd. - Key offerings
- 15.14 Infosys Ltd.
- Infosys Ltd. - Overview
- Infosys Ltd. - Product / Service
- Infosys Ltd. - Key offerings
- 15.15 Intel Corp.
- Intel Corp. - Overview
- Intel Corp. - Product / Service
- Intel Corp. - Key offerings
- 15.16 International Business Machines Corp.
- International Business Machines Corp. - Overview
- International Business Machines Corp. - Product / Service
- International Business Machines Corp. - Key offerings
- 15.17 Johnson Controls International Plc
- Johnson Controls International Plc - Overview
- Johnson Controls International Plc - Product / Service
- Johnson Controls International Plc - Key offerings
- 15.18 Lumen Technologies Inc.
- Lumen Technologies Inc. - Overview
- Lumen Technologies Inc. - Product / Service
- Lumen Technologies Inc. - Key offerings
- 15.19 NEC Corp.
- NEC Corp. - Overview
- NEC Corp. - Product / Service
- NEC Corp. - Key offerings
- 15.20 Nippon Telegraph and Telephone Corp.
- Nippon Telegraph and Telephone Corp. - Overview
- Nippon Telegraph and Telephone Corp. - Product / Service
- Nippon Telegraph and Telephone Corp. - Key offerings
- 15.21 Telefonaktiebolaget LM Ericsson
- Telefonaktiebolaget LM Ericsson - Overview
- Telefonaktiebolaget LM Ericsson - Product / Service
- Telefonaktiebolaget LM Ericsson - Key offerings
- 15.22 Weblib
- Weblib - Overview
- Weblib - Product / Service
- Weblib - Key offerings
- 15.23 Schneider Electric SE
- Schneider Electric SE - Overview
- Schneider Electric SE - Product / Service
- Schneider Electric SE - Key offerings
- 15.24 Fujitsu
- Fujitsu - Overview
- Fujitsu - Product / Service
- Fujitsu - Key offerings
- 15.25 Avaya LLC
- Avaya LLC - Overview
- Avaya LLC - Product / Service
- Avaya LLC - Key offerings
- 15.26 Cisco Systems Inc.
- Cisco Systems Inc. - Overview
- Cisco Systems Inc. - Product / Service
- Cisco Systems Inc. - Key offerings
- 15.27 DB Schenker
- DB Schenker - Overview
- DB Schenker - Product / Service
- DB Schenker - Key offerings
- 15.28 Dell Technologies Inc.
- Dell Technologies Inc. - Overview
- Dell Technologies Inc. - Product / Service
- Dell Technologies Inc. - Key offerings
- 15.29 Dignia Systems Ltd.
- Dignia Systems Ltd. - Overview
- Dignia Systems Ltd. - Product / Service
- Dignia Systems Ltd. - Key offerings
- 15.30 DS worldwide Ltd.
- DS worldwide Ltd. - Overview
- DS worldwide Ltd. - Product / Service
- DS worldwide Ltd. - Key offerings
- 15.31 GP Smart Stadium
- GP Smart Stadium - Overview
- GP Smart Stadium - Product / Service
- GP Smart Stadium - Key offerings
- 15.32 Hawk Eye Innovations Ltd.
- Hawk Eye Innovations Ltd. - Overview
- Hawk Eye Innovations Ltd. - Product / Service
- Hawk Eye Innovations Ltd. - Key offerings
- 15.33 Hewlett Packard Enterprise Co.
- Hewlett Packard Enterprise Co. - Overview
- Hewlett Packard Enterprise Co. - Product / Service
- Hewlett Packard Enterprise Co. - Key offerings
- 15.34 Honeywell International Inc.
- Honeywell International Inc. - Overview
- Honeywell International Inc. - Product / Service
- Honeywell International Inc. - Key offerings
- 15.35 Huawei Technologies Co. Ltd.
- Huawei Technologies Co. Ltd. - Overview
- Huawei Technologies Co. Ltd. - Product / Service
- Huawei Technologies Co. Ltd. - Key offerings
- 15.36 Infosys Ltd.
- Infosys Ltd. - Overview
- Infosys Ltd. - Product / Service
- Infosys Ltd. - Key offerings
- 15.37 Intel Corp.
- Intel Corp. - Overview
- Intel Corp. - Product / Service
- Intel Corp. - Key offerings
- 15.38 International Business Machines Corp.
- International Business Machines Corp. - Overview
- International Business Machines Corp. - Product / Service
- International Business Machines Corp. - Key offerings
- 15.39 Johnson Controls International Plc
- Johnson Controls International Plc - Overview
- Johnson Controls International Plc - Product / Service
- Johnson Controls International Plc - Key offerings
- 15.40 Lumen Technologies Inc.
- Lumen Technologies Inc. - Overview
- Lumen Technologies Inc. - Product / Service
- Lumen Technologies Inc. - Key offerings
- 15.41 NEC Corp.
- NEC Corp. - Overview
- NEC Corp. - Product / Service
- NEC Corp. - Key offerings
- 15.42 Nippon Telegraph and Telephone Corp.
- Nippon Telegraph and Telephone Corp. - Overview
- Nippon Telegraph and Telephone Corp. - Product / Service
- Nippon Telegraph and Telephone Corp. - Key offerings
- 15.43 Telefonaktiebolaget LM Ericsson
- Telefonaktiebolaget LM Ericsson - Overview
- Telefonaktiebolaget LM Ericsson - Product / Service
- Telefonaktiebolaget LM Ericsson - Key offerings
- 15.44 Weblib
- Weblib - Overview
- Weblib - Product / Service
- Weblib - Key offerings
16 Appendix
- 16.2 Inclusions and exclusions checklist
- Inclusions checklist
- Exclusions checklist
- 16.3 Currency conversion rates for US$
- Currency conversion rates for US$
- 16.4 Research methodology
- 16.7 Validation techniques employed for market sizing
- Validation techniques employed for market sizing
- 16.9 360 degree market analysis
- 360 degree market analysis
- 16.10 List of abbreviations