Programmable Logic Devices (PLD) Market Size 2025-2029
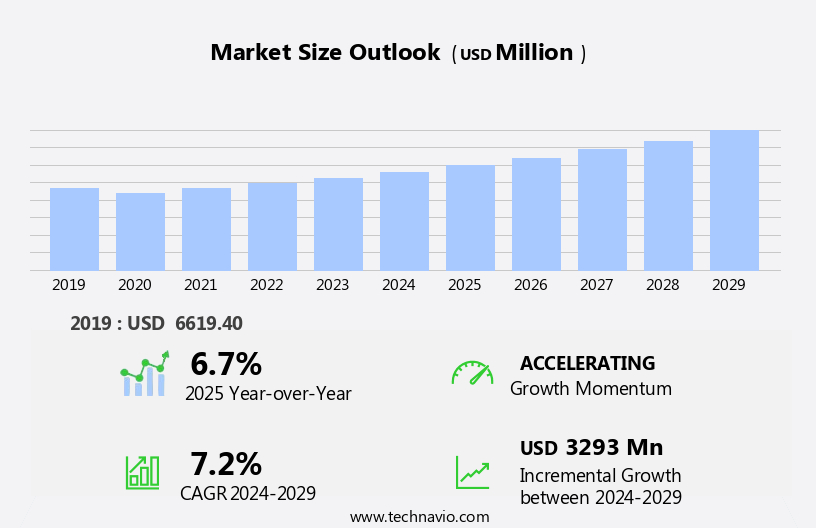
The programmable logic devices (PLD) market size is forecast to increase by USD 3.29 billion at a CAGR of 7.2% between 2024 and 2029.
- The market is experiencing significant growth due to the increasing demand for Internet of Things (IoT) and Artificial Intelligence (AI) applications. The integration of technologies such as Field-Programmable Gate Arrays (FPGAs) with other devices, including processors, memory, or accelerators, for heterogeneous integration is driving market expansion. However, the market faces challenges from competitors offering Application-Specific Integrated Circuits (ASICs) and System-on-Chips (SoCs) solutions. These alternatives offer high performance and power efficiency, posing a threat to the flexibility and adaptability of PLDs. Companies in the market must focus on enhancing the performance and power efficiency of their offerings while maintaining the adaptability and customizability that sets PLDs apart.
- To capitalize on the growing demand for IoT and AI applications, PLD manufacturers should invest in research and development to create innovative solutions that address the unique requirements of these markets. Additionally, collaborations and partnerships with technology leaders in IoT and AI sectors can help expand market reach and create new opportunities. The market will expand in the coming years due to proliferation of consumer electronics such as smartphones, tablets, and wearable technology.
What will be the Size of the Programmable Logic Devices (PLD) Market during the forecast period?
Explore in-depth regional segment analysis with market size data - historical 2019-2023 and forecasts 2025-2029 - in the full report.
Request Free Sample
- Programmable Logic Devices (PLDs) encompass FPGA and CPLD technologies, each exhibiting unique characteristics and applications. FPGA companies continue to innovate, introducing advanced features such as fault simulation, design for test, and formal verification to address design constraints and optimize logic blocks. CPLDs, meanwhile, focus on cost-effective solutions for I/O pins and look-up tables in CPLD applications. FPGA technology trends include design for manufacturability, design for reliability, and timing constraints, driving the need for design optimization and automation. FPGAs are increasingly used in applications ranging from telecommunications to automotive and aerospace, fueling the FPGA market size growth. Simultaneously, CPLD technology trends prioritize configuration memory, placement and routing, and design verification. The increasing demand for customizable ICs, consumer electronic devices, data center investments, telecommunication network infrastructure growth, smart city initiatives, in-vehicle electronics adoption, focus on renewable energy sources, and the proliferation of IoT devices are key factors fueling the demand
- Design complexity and cost remain key challenges, necessitating continuous innovation in design automation and design verification tools. Both FPGAs and CPLDs play crucial roles in the electronics industry, offering flexibility, customization, and performance. As technology evolves, the PLD market size is expected to expand, driven by the demand for efficient, reliable, and cost-effective design solutions. Additionally, the increasing popularity of virtual reality (VR) technology and its application in consumer electronics is another growth factor.
How is this Programmable Logic Devices (PLD) Industry segmented?
The programmable logic devices (PLD) industry research report provides comprehensive data (region-wise segment analysis), with forecasts and estimates in "USD million" for the period 2025-2029, as well as historical data from 2019-2023 for the following segments.
- Type
- Programmable array logic
- Read-only memory
- Complex programmable logic devices
- Field-programmable gate arrays
- Others
- End-user
- Consumer electronics
- Automotive
- Telecommunication
- Aerospace and defense
- Others
- Application
- Industrial automation
- Data center and cloud infrastructure
- AI and ML acceleration
- Edge computing
- Medical devices and imaging
- Geography
- North America
- US
- Canada
- Europe
- Germany
- Russia
- UK
- APAC
- China
- India
- Japan
- South Korea
- South America
- Brazil
- Rest of World (ROW)
- North America
By Type Insights
The programmable array logic segment is estimated to witness significant growth during the forecast period. In the dynamic market, programmable array logic (PAL) devices continue to play a significant role due to their versatility and adaptability. These devices have seen continuous evolution through generations, each offering enhanced logic density, performance, and faster speeds. The capacity of PALs varies, with higher-capacity devices accommodating more complex logic functions. Originally, PALs were characterized by fixed AND gates and programmable OR gates. However, advancements in technology have led to variations and improvements within this subset of simple PLDs. Design tools and hardware description languages facilitate the digital design process, ensuring design flow efficiency and design reuse.
Real-time operating systems and power management systems optimize performance and power consumption. Industrial automation, aerospace electronics, automotive electronics, and consumer electronics all benefit from PLDs. Signal conditioning, data acquisition, image processing, and control systems are essential applications for these devices. Communication protocols and thermal management are crucial considerations in the design process. Manufacturing processes employ logic synthesis, data conversion, and logic gates to create complex digital designs. Embedded systems, design for testability, and intellectual property are essential aspects of PLD development. Cost optimization and packaging technologies are also significant factors in the market. Power management and power consumption are critical concerns, with power management systems and ip cores addressing these issues.
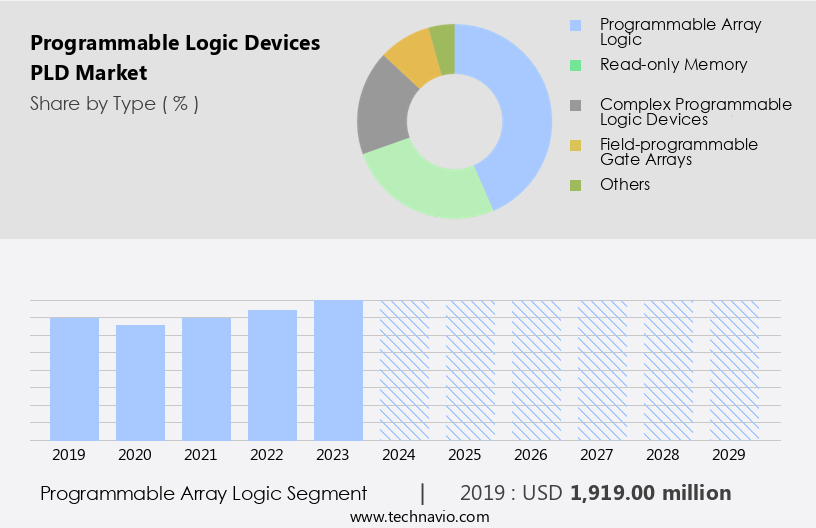
The Programmable array logic segment was valued at USD 1.92 billion in 2019 and showed a gradual increase during the forecast period.
Regional Analysis
North America is estimated to contribute 40% to the growth of the global market during the forecast period. Technavio's analysts have elaborately explained the regional trends and drivers that shape the market during the forecast period.
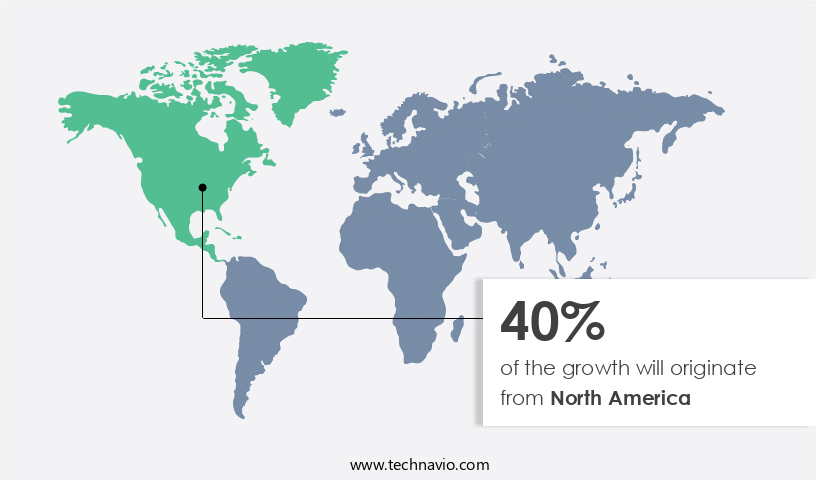
The market in North America is poised for growth due to the revival of manufacturing activities in the region. Quality control and productivity improvement are key priorities for industries in North America, leading to increased adoption of PLDs. IoT-enabled controllers are particularly popular, as they enable energy efficiency, power reduction, and streamlined automation processes. The manufacturing sectors of automotive, electronics and semiconductors, and food and beverage are expected to significantly contribute to the PLD market's revenue during the forecast period. Industrialization and economic growth in North America have set a high standard for manufacturing quality. In the realm of digital design, design tools, logic synthesis, and hardware description languages are essential components of the design flow. Emerging technologies, such as artificial intelligence, the Internet of Things, augmented reality, and smart home systems from industry leaders continue to shape the market's direction.
Real-time operating systems, signal conditioning, and communication protocols ensure optimal performance and efficient data acquisition. Power management, thermal management, and cost optimization are crucial considerations for manufacturers. Design for testability and embedded systems are essential for ensuring product reliability and reducing development time. Intellectual property and design reuse are essential strategies for manufacturers to stay competitive. Aerospace electronics, automotive electronics, image processing, control systems, and data conversion are among the various applications of PLDs. Testing and verification are essential steps in the design process to ensure the functionality and reliability of these devices. Packaging technologies and power management are critical aspects of PLD manufacturing processes.
Market Dynamics
Our researchers analyzed the data with 2024 as the base year, along with the key drivers, trends, and challenges. A holistic analysis of drivers will help companies refine their marketing strategies to gain a competitive advantage.
What are the Programmable Logic Devices (PLD) market drivers leading to the rise in the adoption of Industry?
- The increasing demand for IoT (Internet of Things) and AI (Artificial Intelligence) technologies is the primary catalyst fueling market growth. The market experiences significant growth due to the increasing adoption of IoT (Internet of Things) and AI (Artificial Intelligence) technologies. PLDs, including field-programmable gate arrays (FPGAs) and complex programmable logic devices (CPLDs), play a crucial role in IoT ecosystems by providing customizable solutions for various industries such as industrial automation, aerospace electronics, data acquisition, and digital signal processing. These devices offer advantages like real-time processing, signal conditioning, and the ability to implement specific logic for optimized performance and power efficiency.
- The flexibility of PLDs enables their integration into diverse applications, making them indispensable components in modern technology systems. Real-time operating systems and industrial automation sectors particularly benefit from the use of PLDs, ensuring efficient and reliable control in manufacturing processes and critical applications.
What are the Programmable Logic Devices (PLD) market trends shaping the Industry?
- The integration of various technologies, such as Field-Programmable Gate Arrays (FPGAs) with processors, memory, or accelerators, is a major trend, shaping the market. This trend signifies the importance of advanced technology combinations to enhance system performance and flexibility. The market is witnessing significant advancements due to the integration of heterogeneous technologies. This approach, known as heterogeneous integration, combines various functionalities, including Field-Programmable Gate Arrays (FPGAs), processors, memory, and specialized accelerators, onto a single chip or package. The primary objective of this integration is to enhance system performance, reduce latency, and improve overall integration. Manufacturers in the PLD industry are employing heterogeneous integration to create hybrid solutions catering to diverse application requirements across sectors such as telecommunications, automotive, aerospace, and IoT. This trend aligns with the growing demand for more efficient and compact systems, offering improved performance and flexibility while minimizing interconnect complexity and power consumption.
- In digital design, tools such as Electronic Design Automation (EDA) and logic synthesis play a crucial role in the design flow. Data conversion and manufacturing processes are essential components of the PLD market, ensuring seamless integration and functionality. Logic gates, a fundamental building block of digital design, are a key focus area for innovation and optimization in PLD technology.
How does Programmable Logic Devices (PLD) market face challenges during its growth?
- The expansion of ASICs (Application-Specific Integrated Circuits) and SoCs (Systems on Chips) solutions poses a significant challenge to the industry's growth trajectory. These advanced technologies are increasingly encroaching upon traditional market domains, necessitating continuous innovation and adaptation to remain competitive. The market experiences intense competition from Application-Specific Integrated Circuits (ASICs) and System-on-Chip (SoC) solutions, impacting PLD's market penetration. ASICs and SoCs cater to specific applications with optimized performance, power efficiency, and cost-effectiveness, making them preferred choices for large-scale production. ASICs, custom-designed for particular tasks or functions, deliver superior performance and power efficiency, especially in applications with high-volume production where the initial design and manufacturing costs are justified. SoCs integrate various components into a single chip, comprising processors, memory, peripherals, and often dedicated hardware accelerators for specialized functions.
- In the realm of embedded systems, ASICs and SoCs have gained traction in sectors like automotive electronics, image processing, control systems, and testing and verification due to their performance optimization and power consumption advantages. Despite the challenges, PLDs continue to offer flexibility in design for testability and ease of implementation, making them valuable in various industries.
Exclusive Customer Landscape
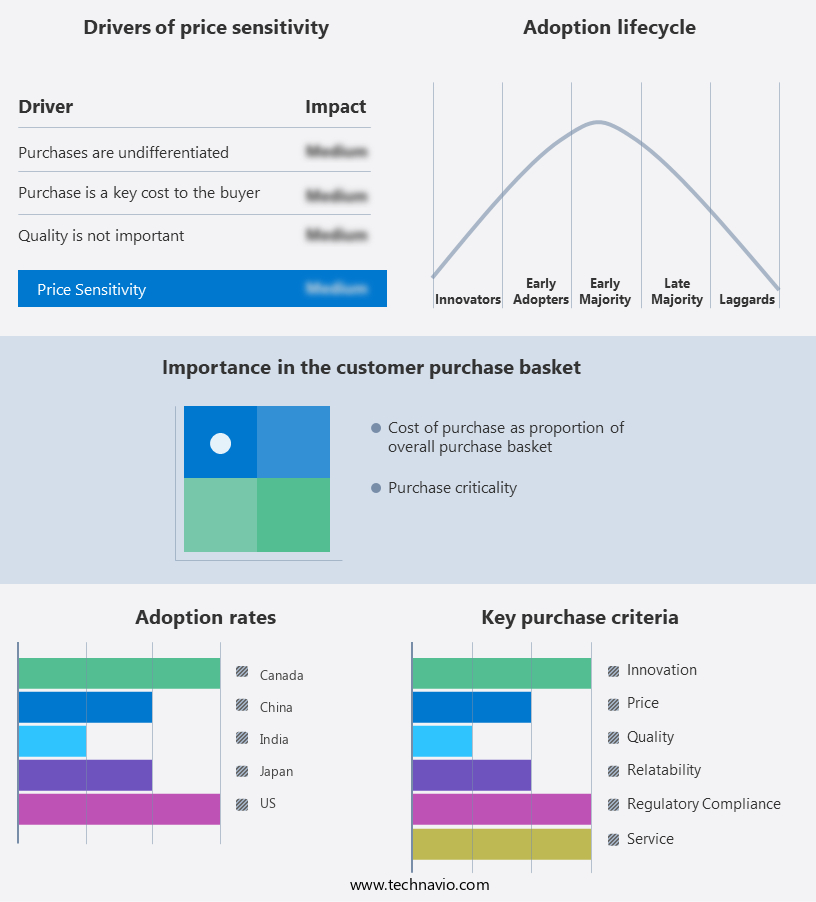
The programmable logic devices (PLD) market forecasting report includes the adoption lifecycle of the market, covering from the innovator's stage to the laggard's stage. It focuses on adoption rates in different regions based on penetration. Furthermore, the programmable logic devices (PLD) market report also includes key purchase criteria and drivers of price sensitivity to help companies evaluate and develop their market growth analysis strategies.
Customer Landscape
Key Companies & Market Insights
Companies are implementing various strategies, such as strategic alliances, programmable logic devices (PLD) market forecast, partnerships, mergers and acquisitions, geographical expansion, and product/service launches, to enhance their presence in the industry.
Achronix Semiconductor Corp. - This company specializes in providing programmable logic solutions through advanced devices like Speedster7t FPGAs.
The industry research and growth report includes detailed analyses of the competitive landscape of the market and information about key companies, including:
- Achronix Semiconductor Corp.
- Advanced Micro Devices Inc.
- Aldec Inc.
- Cadence Design Systems Inc.
- Efinix Inc.
- GOWIN Semiconductor Corp.
- Infineon Technologies AG
- Intel Corp.
- Lattice Semiconductor Corp.
- Microchip Technology Inc.
- QuickLogic Corp.
- Renesas Electronics Corp.
- STMicroelectronics NV
- Texas Instruments Inc.
- TTI Inc.
Qualitative and quantitative analysis of companies has been conducted to help clients understand the wider business environment as well as the strengths and weaknesses of key industry players. Data is qualitatively analyzed to categorize companies as pure play, category-focused, industry-focused, and diversified; it is quantitatively analyzed to categorize companies as dominant, leading, strong, tentative, and weak.
Recent Development and News in Programmable Logic Devices (PLD) Market
- In February 2024, Texas Instruments, a leading semiconductor company, announced the launch of its new MSP430FR5994 microcontroller, featuring integrated Programmable Logic Devices (PLDs) and wireless connectivity. This innovative solution allows designers to implement complex control functions and wireless communication in a single chip, reducing design complexity and cost (Texas Instruments Press Release, 2024).
- In June 2024, Infineon Technologies AG and NXP Semiconductors entered into a strategic partnership to expand their collaboration on automotive PLDs. This partnership aims to combine Infineon's expertise in power semiconductors and NXP's strength in microcontrollers and software to deliver advanced automotive solutions (Infineon Technologies AG Press Release, 2024).
- In October 2024, ON Semiconductor completed the acquisition of Cypress Semiconductor, creating a leading provider of PLDs and other semiconductor solutions. This merger is expected to generate significant synergies and enable ON Semiconductor to expand its product portfolio and customer base (ON Semiconductor Press Release, 2024).
- In March 2025, Intel announced the release of its new FPGA-based PLD, the Arria 10 GX FPGA family. With up to 2.5x the logic density and 3x the performance compared to its predecessor, this technological advancement is expected to significantly enhance the capabilities of Intel's PLD offerings (Intel Corporation Press Release, 2025).
Research Analyst Overview
The market continues to evolve, driven by advancements in embedded systems, power consumption, and performance optimization. These technologies find applications in various sectors, including industrial automation, digital signal processing, real-time operating systems, and aerospace electronics. Signal conditioning and data acquisition systems are integral to the PLD market, enabling precise data measurement and processing in various industries. Embedded systems, designed using Hardware Description Languages (HDL), are increasingly adopted for control applications, ensuring efficient and reliable operation. Automotive electronics and image processing are significant growth areas, with the demand for advanced driver assistance systems (ADAS) and autonomous vehicles driving the need for high-performance, low-power PLD solutions.
Power consumption and performance optimization remain key challenges, with ongoing research focusing on design for testability, cost optimization, and intellectual property protection. In the consumer electronics sector, PLDs are used in communication protocols, logic synthesis, and data conversion applications, enabling seamless connectivity and data transfer. Manufacturing processes leverage PLDs for logic gates and digital design, optimizing design flow and reducing time-to-market. Testing and verification are essential components of the PLD market, with ongoing research focusing on automating testing and verification processes, improving thermal management, and implementing packaging technologies for enhanced reliability and cost optimization. Power management and IP cores are also critical areas of focus, enabling efficient power usage and design reuse across various applications.
Dive into Technavio's robust research methodology, blending expert interviews, extensive data synthesis, and validated models for unparalleled Programmable Logic Devices (PLD) Market insights. See full methodology.
|
Market Scope |
|
|
Report Coverage |
Details |
|
Page number |
228 |
|
Base year |
2024 |
|
Historic period |
2019-2023 |
|
Forecast period |
2025-2029 |
|
Growth momentum & CAGR |
Accelerate at a CAGR of 7.2% |
|
Market growth 2025-2029 |
USD 3.29 billion |
|
Market structure |
Fragmented |
|
YoY growth 2024-2025(%) |
6.7 |
|
Key countries |
US, China, Canada, Germany, UK, Japan, India, Russia, Brazil, and South Korea |
|
Competitive landscape |
Leading Companies, Market Positioning of Companies, Competitive Strategies, and Industry Risks |
What are the Key Data Covered in this Programmable Logic Devices (PLD) Market Research and Growth Report?
- CAGR of the Programmable Logic Devices (PLD) industry during the forecast period
- Detailed information on factors that will drive the growth and forecasting between 2025 and 2029
- Precise estimation of the size of the market and its contribution of the industry in focus to the parent market
- Accurate predictions about upcoming growth and trends and changes in consumer behaviour
- Growth of the market across North America, APAC, Europe, Middle East and Africa, and South America
- Thorough analysis of the market's competitive landscape and detailed information about companies
- Comprehensive analysis of factors that will challenge the programmable logic devices (PLD) market growth of industry companies
We can help! Our analysts can customize this programmable logic devices (PLD) market research report to meet your requirements.
 RIA -
RIA - 
