Protective Packaging Market Analysis, Size, and Forecast 2026-2030: APAC (China, India, and Japan), North America (US, Canada, and Mexico), Europe (Germany, UK, and France), Middle East and Africa (South Africa, UAE, and Saudi Arabia), South America (Brazil and Argentina), and Rest of World (ROW)

Protective Packaging Market Analysis, Size, and Forecast 2026-2030:
APAC (China, India, and Japan), North America (US, Canada, and Mexico), Europe (Germany, UK, and France), Middle East and Africa (South Africa, UAE, and Saudi Arabia), South America (Brazil and Argentina), and Rest of World (ROW)

Published: Dec 2025 298 Pages SKU: IRTNTR76194

Market Overview at a Glance

$6.50 B
Market Opportunity
3.5%
CAGR 2025 - 2030
40.2%
APAC Growth
$22.12 B
Flexible segment 2024

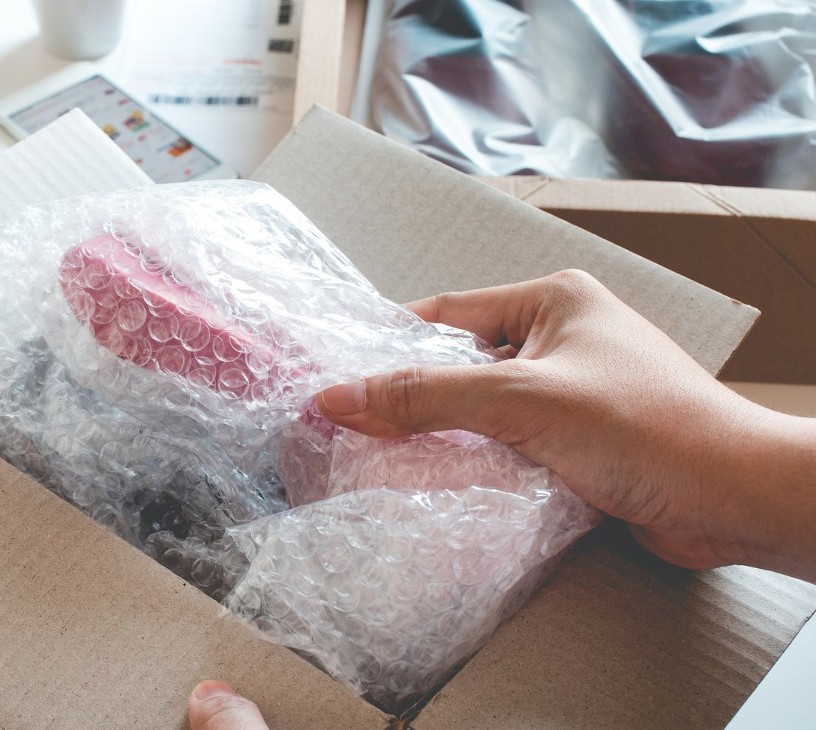
Protective Packaging Market Size 2026-2030

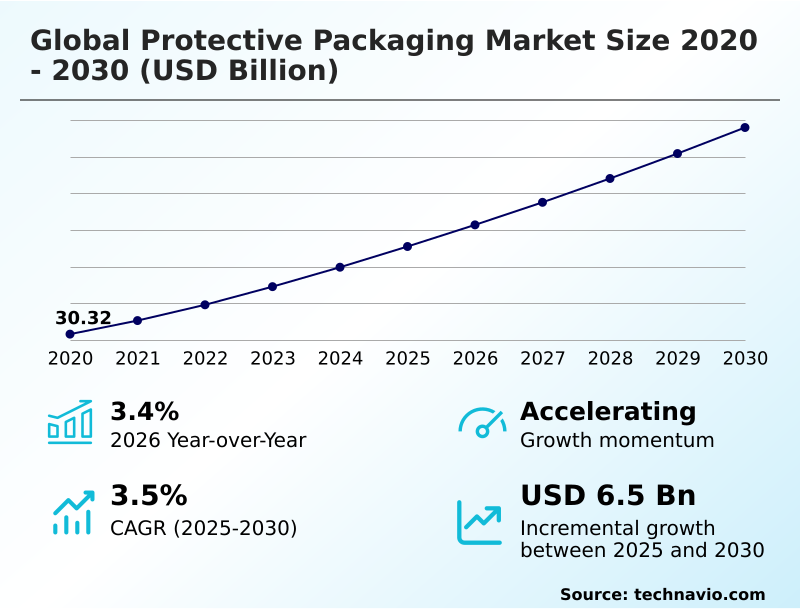
The protective packaging market size is valued to increase by USD 6.50 billion, at a CAGR of 3.5% from 2025 to 2030. Growth of e-commerce sector will drive the protective packaging market.

Major Market Trends & Insights

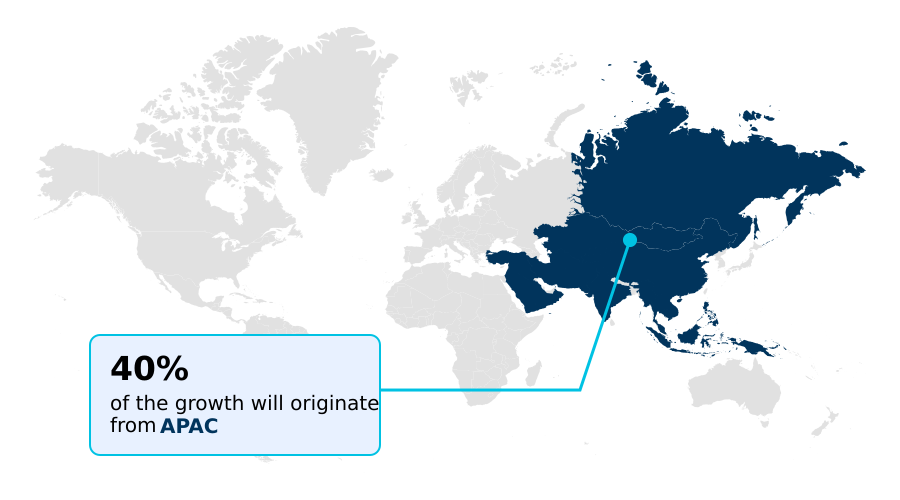
  • APAC dominated the market and accounted for a 40.2% growth during the forecast period.
  • By Type - Flexible segment was valued at USD 22.12 billion in 2024
  • By End-user - Food and beverages segment accounted for the largest market revenue share in 2024

Market Size & Forecast

  • Market Opportunities: USD 11.28 billion
  • Market Future Opportunities: USD 6.50 billion
  • CAGR from 2025 to 2030 : 3.5%

Market Summary

  • The protective packaging market is undergoing a significant transformation, driven by the dual imperatives of sustainability and e-commerce logistics. The industry is moving beyond conventional materials toward advanced solutions like sustainable cushioning materials and biodegradable foam alternatives to meet stringent environmental regulations and consumer demand for curbside recyclable solutions.
  • This evolution is redefining the function of packaging, which must now provide robust, shock-absorbent packaging while also enhancing the unboxing experience. For instance, a third-party logistics provider might integrate automated boxing systems that use sensors to select the optimal container size for each order.
  • This technology significantly reduces the need for void-fill systems and inflatable air cushions, leading to lower material consumption and dimensional weight charges. Such innovations, including the development of mono-material packaging and the exploration of chemical recycling pyrolysis for multi-layer flexible films, are critical for creating a circular economy.
  • This focus on efficiency and environmental stewardship shapes the competitive landscape, compelling businesses to innovate across flexible protective packaging, rigid protective packaging, and foam protective packaging categories to maintain relevance and meet the sophisticated demands of modern supply chains.

What will be the Size of the Protective Packaging Market during the forecast period?

Get Key Insights on Market Forecast (PDF) Request Free Sample

How is the Protective Packaging Market Segmented?

The protective packaging industry research report provides comprehensive data (region-wise segment analysis), with forecasts and estimates in "USD million" for the period 2026-2030, as well as historical data from 2020-2024 for the following segments.

  • Type
    • Flexible
    • Rigid
    • Foam
  • End-user
    • Food and beverages
    • Industrial goods
    • Consumer electronics
    • Household appliances
    • Others
  • Material
    • Plastic
    • Paper and paperboard
    • Others
  • Geography
    • APAC
      • China
      • India
      • Japan
    • North America
      • US
      • Canada
      • Mexico
    • Europe
      • Germany
      • UK
      • France
    • Middle East and Africa
      • South Africa
      • UAE
      • Saudi Arabia
    • South America
      • Brazil
      • Argentina
    • Rest of World (ROW)

By Type Insights

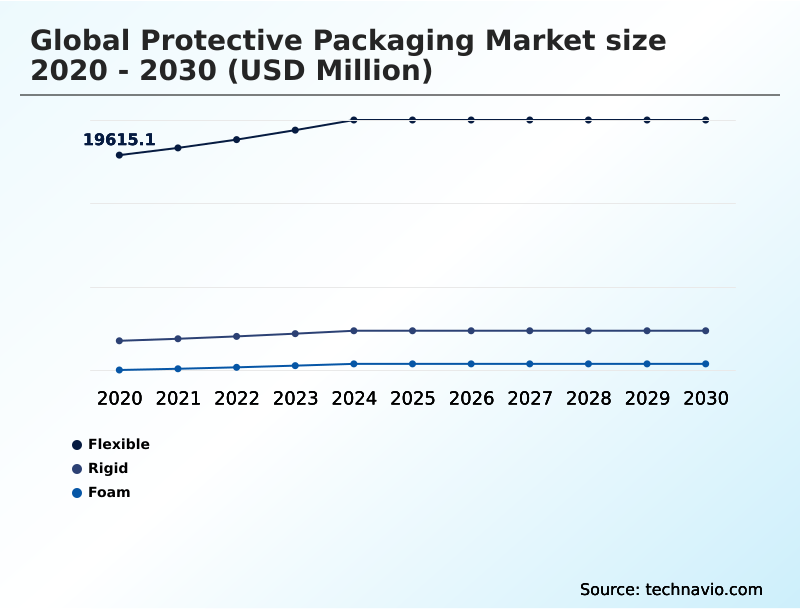
The flexible segment is estimated to witness significant growth during the forecast period.

The flexible protective packaging segment is driven by e-commerce packaging optimization and the need for sustainable packaging innovation.

A shift is underway from traditional multi-layer flexible films and inflatable air cushions toward curbside recyclable solutions and other lightweight shipping materials that support packaging waste management goals.

These advancements are crucial for product damage reduction and building a resilient supply chain packaging strategy for high-volume retailers.

For instance, the adoption of intelligent sizing algorithms in conjunction with advanced flexible materials has enabled select distributors to reduce the use of unnecessary void-fill materials by nearly 15%, directly impacting shipping costs and environmental footprint.

This evolution underscores the segment's critical role in meeting both logistical demands and consumer sustainability expectations.

Request Free Sample

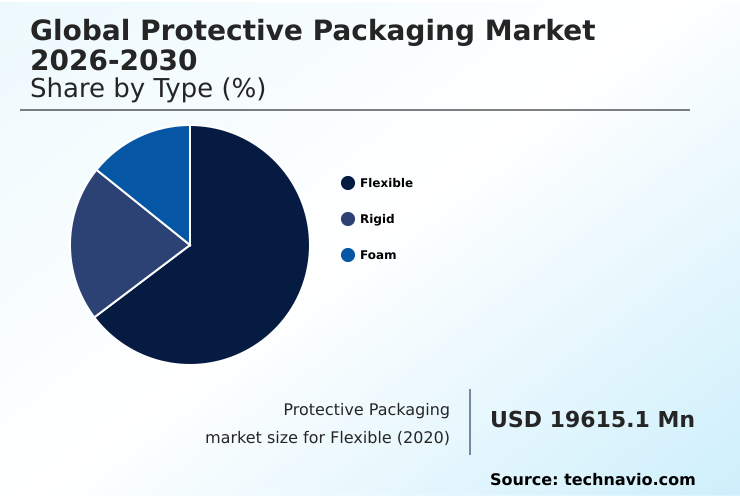
The Flexible segment was valued at USD 22.12 billion in 2024 and showed a gradual increase during the forecast period.

Request Free Sample

Regional Analysis

APAC is estimated to contribute 40.2% to the growth of the global market during the forecast period.Technavio’s analysts have elaborately explained the regional trends and drivers that shape the market during the forecast period.

See How Protective Packaging Market Demand is Rising in APAC Request Free Sample

The geographic landscape is led by APAC, which accounts for over 40% of incremental growth, fueled by its expanding manufacturing and e-commerce sectors.

The region is rapidly adopting sustainable cushioning materials like molded pulp trays and honeycomb paperboard, which serve as lightweight shipping materials to enable freight weight reduction for exports.

In North America and Europe, the focus is on optimizing logistics with heavy-duty corrugated solutions and advanced shock-absorbent packaging to build a more resilient supply chain packaging framework.

Globally, the demand for sophisticated temperature-controlled packaging is accelerating, particularly for food-grade protective materials.

The deployment of these advanced materials has already helped leading logistics networks reduce in-transit product damage rates by more than 15%, showcasing a clear return on investment.

Market Dynamics

Our researchers analyzed the data with 2025 as the base year, along with the key drivers, trends, and challenges. A holistic analysis of drivers will help companies refine their marketing strategies to gain a competitive advantage.

  • The global protective packaging market 2026-2030 navigates a complex trade-off between the cost of high-performance protective packaging and the intense impact of e-commerce on protective packaging demand. Key advancements in recyclable flexible packaging materials are addressing sustainability goals, with a significant push for sustainable alternatives to expanded polystyrene foam.
  • The requirements for protective packaging for fragile electronic components, which often necessitate ESD protective packaging for sensitive electronics, differ greatly from the needs of protective packaging for industrial goods. This specialization drives trends in automated protective packaging systems, which are essential for optimizing protective packaging for last-mile delivery.
  • Simultaneously, the role of protective packaging in cold chain logistics is becoming more critical, intensifying the challenges of recycling multi-layer packaging films. Innovations in paper-based void-fill solutions and the benefits of molded pulp for product protection offer viable paths forward.
  • Strategic decisions now involve a direct comparison of air pillows vs paper cushioning, as companies work toward reducing packaging waste in online retail and ensuring protective packaging compliance with EPR schemes. The move toward mono-material packaging for improved recyclability is a central theme, aimed at enhancing the unboxing experience with packaging.
  • Companies that successfully implement lightweighting strategies for protective packaging are reporting freight cost savings more than double those of competitors using traditional materials, highlighting a clear operational advantage.

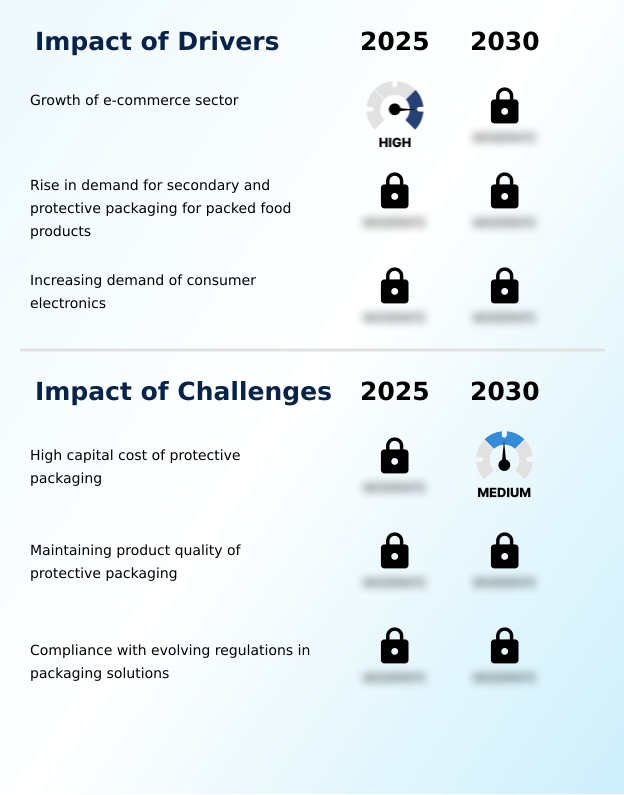
What are the key market drivers leading to the rise in the adoption of Protective Packaging Industry?

  • The rapid growth of the e-commerce sector is a primary driver for the protective packaging market.

  • Growth is primarily fueled by the demands of e-commerce, which necessitates superior last-mile delivery protection and efficient cold chain logistics solutions.
  • This has accelerated investment in automated packaging machinery, including automated boxing systems and sophisticated air-cushioning systems that optimize material usage. For instance, automation has increased fulfillment throughput by over 35% in high-volume distribution centers.
  • The adoption of advanced void-fill systems and lightweight materials like paper-based thermal liner contributes to significant freight weight reduction, lowering operational costs.
  • Beyond efficiency, the driver to enhance the unboxing experience is compelling brands to invest in higher-quality foam protective packaging and other materials that ensure products arrive in perfect condition.

What are the market trends shaping the Protective Packaging Industry?

  • The emergence of new recycling techniques for flexible packaging is a key upcoming market trend. These advanced methods are set to influence material choices and packaging design.

  • Key trends are centered on advancing circular economy packaging principles and ensuring extended producer responsibility (EPR) compliance. The development of mono-material packaging is a primary focus, as it simplifies recycling and reduces contamination in waste streams.
  • Innovations in biodegradable foam alternatives and compostable protective packaging are providing viable substitutes for traditional polymers, helping companies meet high-performance protection standards while improving their environmental profile. Concurrently, the rise of smart packaging integration within returnable transit packaging systems is enabling superior asset tracking and lifecycle management, with some systems improving return rates by 40%.
  • The industry is also exploring advanced recycling methods like chemical recycling pyrolysis and solvent-based dissolution to manage complex materials.

What challenges does the Protective Packaging Industry face during its growth?

  • The high capital cost associated with protective packaging solutions presents a significant challenge to industry growth.

  • Significant challenges persist in specialized, high-cost applications. For industrial goods packaging and consumer electronics protection, the need for custom rigid protective packaging and electrostatic discharge (ESD) foams adds considerable expense and complexity. Ensuring consistent thermal insulation performance in insulated shipping containers while increasing post-consumer recycled (PCR) content remains a technical hurdle.
  • Furthermore, guaranteeing pharmaceutical packaging integrity with custom die-cut packaging and sophisticated vibration dampening materials requires extensive validation, which can increase product development timelines by up to 25%. These challenges are compounded by volatile raw material costs, making it difficult to balance performance with budget constraints.

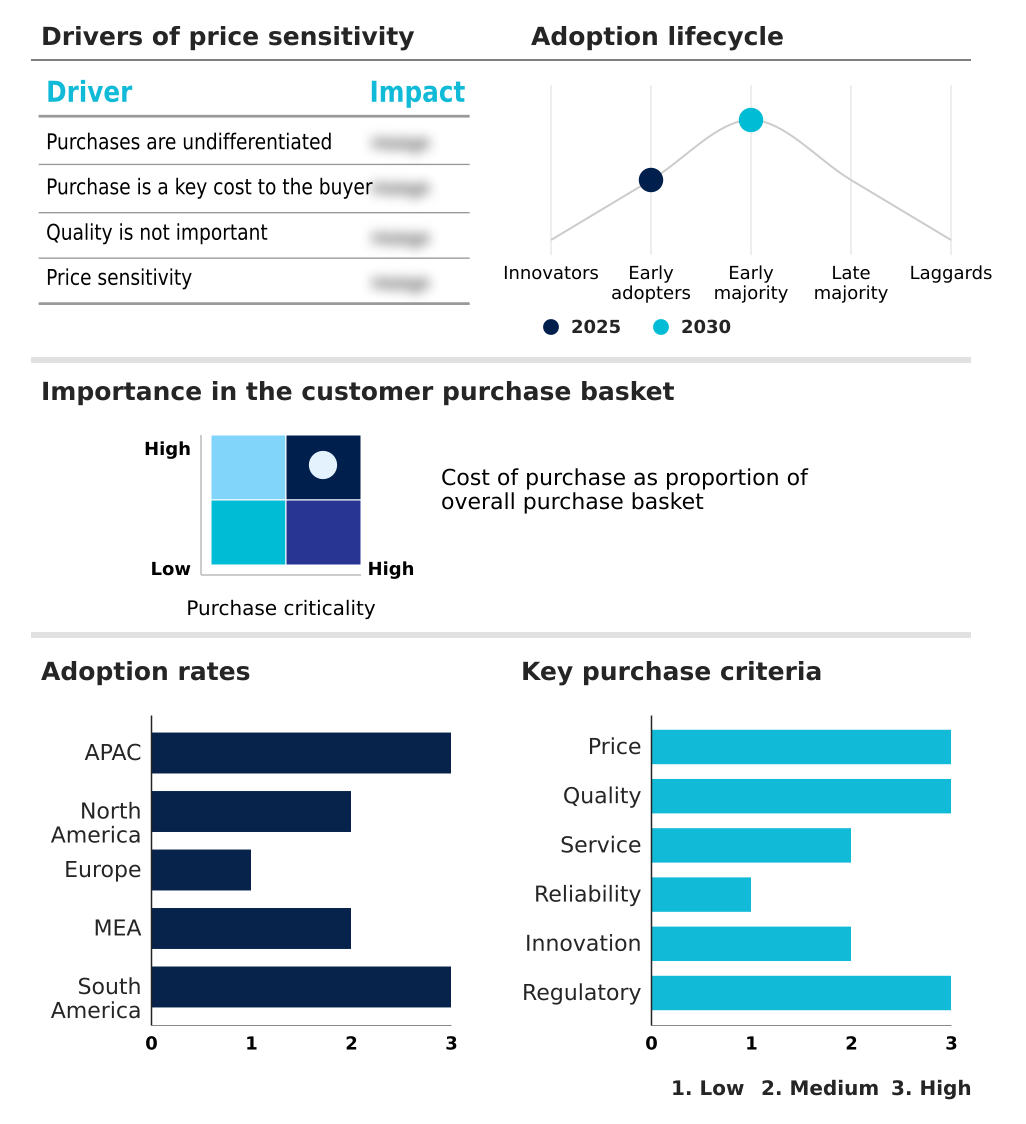
Exclusive Technavio Analysis on Customer Landscape

The protective packaging market forecasting report includes the adoption lifecycle of the market, covering from the innovator’s stage to the laggard’s stage. It focuses on adoption rates in different regions based on penetration. Furthermore, the protective packaging market report also includes key purchase criteria and drivers of price sensitivity to help companies evaluate and develop their market growth analysis strategies.

Customer Landscape of Protective Packaging Industry

Competitive Landscape

Companies are implementing various strategies, such as strategic alliances, protective packaging market forecast, partnerships, mergers and acquisitions, geographical expansion, and product/service launches, to enhance their presence in the industry.

Avery Dennison Corp. - Provides engineered protective solutions, including custom die-cut and insulated boxes, designed to ensure product integrity across various transit conditions.

The industry research and growth report includes detailed analyses of the competitive landscape of the market and information about key companies, including:

  • Avery Dennison Corp.
  • Berry Global Inc.
  • Black Diamond Capital
  • Cascades Inc.
  • Crown Holdings Inc.
  • Dow Chemical Co.
  • DS Smith Plc
  • EcoEnclose
  • Hanchett Paper Co.
  • International Paper Co.
  • Mondi Plc
  • NEFAB GROUP
  • Pregis LLC
  • Ranpak Holdings Corp.
  • Sealed Air Corp.
  • Smurfit Kappa Group
  • Storopack Pvt. Ltd.
  • Universal Protective Packaging
  • WestRock Co.
  • Winpak Ltd.

Qualitative and quantitative analysis of companies has been conducted to help clients understand the wider business environment as well as the strengths and weaknesses of key industry players. Data is qualitatively analyzed to categorize companies as pure play, category-focused, industry-focused, and diversified; it is quantitatively analyzed to categorize companies as dominant, leading, strong, tentative, and weak.

Recent Development and News in Protective packaging market

  • In August, 2024, Sealed Air Corp. announced the launch of the Bubble Wrap Brand Ready-to-Roll Embossed Paper, a paper-based cushioning alternative to its traditional plastic products designed to be curbside recyclable.
  • In September, 2024, Mondi Group, in partnership with Amazon, unveiled a new line of protective mailers that use a shock-absorbent open-flute paper structure, eliminating the need for plastic bubble linings.
  • In October, 2024, LyondellBasell acquired APK AG, a company specializing in a unique solvent-based recycling technology for separating multi-layer flexible packaging, to strengthen its circular economy portfolio.
  • In December, 2024, DS Smith reported a 15% increase in capital expenditure in its half-year results, committing to investments in operational efficiency and sustainable innovation despite a challenging economic environment.

Dive into Technavio’s robust research methodology, blending expert interviews, extensive data synthesis, and validated models for unparalleled Protective Packaging Market insights. See full methodology.

Market Scope
Page number 298
Base year 2025
Historic period 2020-2024
Forecast period 2026-2030
Growth momentum & CAGR Accelerate at a CAGR of 3.5%
Market growth 2026-2030 USD 6497.8 million
Market structure Fragmented
YoY growth 2025-2026(%) 3.4%
Key countries China, India, Japan, South Korea, Australia, Indonesia, US, Canada, Mexico, Germany, UK, France, Italy, Spain, The Netherlands, South Africa, UAE, Saudi Arabia, Israel, Turkey, Brazil, Argentina and Chile
Competitive landscape Leading Companies, Market Positioning of Companies, Competitive Strategies, and Industry Risks

Request Free Sample

Research Analyst Overview

  • The protective packaging market is pivoting toward a circular model, where material science and automation converge. Innovations in sustainable cushioning materials, including paper-based thermal liner and compostable protective packaging, are replacing legacy products. All primary categories flexible protective packaging, rigid protective packaging, and foam protective packaging are being re-engineered with biodegradable foam alternatives and higher post-consumer recycled (PCR) content.
  • The strategic shift to curbside recyclable solutions and mono-material packaging has become a boardroom-level imperative, directly influencing supply chain architecture and risk management. For instance, the deployment of automated boxing systems has been shown to reduce material waste by over 20%, a compelling efficiency gain.
  • Specialized applications continue to drive demand for solutions like electrostatic discharge (ESD) foams, insulated shipping containers for temperature-controlled packaging, and vibration dampening materials. The industry is also tackling end-of-life challenges for multi-layer flexible films through emerging technologies like solvent-based dissolution and chemical recycling pyrolysis.
  • This evolution is supported by a range of technologies, from air-cushioning systems and advanced void-fill systems to molded pulp trays and shock-absorbent packaging made from honeycomb paperboard.

What are the Key Data Covered in this Protective Packaging Market Research and Growth Report?

  • What is the expected growth of the Protective Packaging Market between 2026 and 2030?

    • USD 6.50 billion, at a CAGR of 3.5%

  • What segmentation does the market report cover?

    • The report is segmented by Type (Flexible, Rigid, and Foam), End-user (Food and beverages, Industrial goods, Consumer electronics, Household appliances, and Others), Material (Plastic, Paper and paperboard, and Others) and Geography (APAC, North America, Europe, Middle East and Africa, South America)

  • Which regions are analyzed in the report?

    • APAC, North America, Europe, Middle East and Africa and South America

  • What are the key growth drivers and market challenges?

    • Growth of e-commerce sector, High capital cost of protective packaging

  • Who are the major players in the Protective Packaging Market?

    • Avery Dennison Corp., Berry Global Inc., Black Diamond Capital, Cascades Inc., Crown Holdings Inc., Dow Chemical Co., DS Smith Plc, EcoEnclose, Hanchett Paper Co., International Paper Co., Mondi Plc, NEFAB GROUP, Pregis LLC, Ranpak Holdings Corp., Sealed Air Corp., Smurfit Kappa Group, Storopack Pvt. Ltd., Universal Protective Packaging, WestRock Co. and Winpak Ltd.

Market Research Insights

  • Market dynamics are increasingly shaped by e-commerce packaging optimization and the critical need for resilient supply chain packaging. The focus on sustainable packaging innovation is driving the adoption of circular economy packaging principles and pushing for greater extended producer responsibility (EPR) compliance.
  • This has led to measurable business outcomes, as the implementation of automated packaging machinery increases fulfillment throughput by over 30%. Furthermore, the strategic use of lightweight shipping materials has enabled freight weight reduction of up to 15%, directly lowering operational costs. The integration of advanced cold chain logistics solutions is also pivotal, reducing spoilage rates for temperature-sensitive goods by 20%.
  • These efficiencies, coupled with an enhanced unboxing experience and better product damage reduction, define the current competitive environment.

We can help! Our analysts can customize this protective packaging market research report to meet your requirements.

Get in touch

1. Executive Summary

1.1 Market overview

Executive Summary - Chart on Market Overview
Executive Summary - Data Table on Market Overview
Executive Summary - Chart on Global Market Characteristics
Executive Summary - Chart on Market by Geography
Executive Summary - Chart on Market Segmentation by Type
Executive Summary - Chart on Market Segmentation by End-user
Executive Summary - Chart on Market Segmentation by Material
Executive Summary - Chart on Incremental Growth
Executive Summary - Data Table on Incremental Growth
Executive Summary - Chart on Company Market Positioning

2. Technavio Analysis

2.1 Analysis of price sensitivity, lifecycle, customer purchase basket, adoption rates, and purchase criteria

2.2 Criticality of inputs and Factors of differentiation

Chart on Overview on criticality of inputs and factors of differentiation

2.3 Factors of disruption

Chart on Overview on factors of disruption

2.4 Impact of drivers and challenges

Chart on Impact of drivers and challenges in 2025 and 2030

3. Market Landscape

3.1 Market ecosystem

Chart on Parent Market
Data Table on - Parent Market

3.2 Market characteristics

Chart on Market characteristics analysis

3.3 Value chain analysis

Chart on Value chain analysis

4. Market Sizing

4.1 Market definition

Data Table on Offerings of companies included in the market definition

4.2 Market segment analysis

Market segments

4.3 Market size 2025

4.4 Market outlook: Forecast for 2025-2030

Chart on Global - Market size and forecast 2025-2030 ($ million)
Data Table on Global - Market size and forecast 2025-2030 ($ million)
Chart on Global Market: Year-over-year growth 2025-2030 (%)
Data Table on Global Market: Year-over-year growth 2025-2030 (%)

5. Historic Market Size

5.1 Global Protective Packaging Market 2020 - 2024

Historic Market Size - Data Table on Global Protective Packaging Market 2020 - 2024 ($ million)

5.2 Type segment analysis 2020 - 2024

Historic Market Size - Type Segment 2020 - 2024 ($ million)

5.3 End-user segment analysis 2020 - 2024

Historic Market Size - End-user Segment 2020 - 2024 ($ million)

5.4 Material segment analysis 2020 - 2024

Historic Market Size - Material Segment 2020 - 2024 ($ million)

5.5 Geography segment analysis 2020 - 2024

Historic Market Size - Geography Segment 2020 - 2024 ($ million)

5.6 Country segment analysis 2020 - 2024

Historic Market Size - Country Segment 2020 - 2024 ($ million)

6. Qualitative Analysis

6.1 Impact of AI on Global Protective Packaging Market

7. Five Forces Analysis

7.1 Five forces summary

Five forces analysis - Comparison between 2025 and 2030

7.2 Bargaining power of buyers

Bargaining power of buyers - Impact of key factors 2025 and 2030

7.3 Bargaining power of suppliers

Bargaining power of suppliers - Impact of key factors in 2025 and 2030

7.4 Threat of new entrants

Threat of new entrants - Impact of key factors in 2025 and 2030

7.5 Threat of substitutes

Threat of substitutes - Impact of key factors in 2025 and 2030

7.6 Threat of rivalry

Threat of rivalry - Impact of key factors in 2025 and 2030

7.7 Market condition

Chart on Market condition - Five forces 2025 and 2030

8. Market Segmentation by Type

8.1 Market segments

Chart on Type - Market share 2025-2030 (%)
Data Table on Type - Market share 2025-2030 (%)

8.2 Comparison by Type

Chart on Comparison by Type
Data Table on Comparison by Type

8.3 Flexible - Market size and forecast 2025-2030

Chart on Flexible - Market size and forecast 2025-2030 ($ million)
Data Table on Flexible - Market size and forecast 2025-2030 ($ million)
Chart on Flexible - Year-over-year growth 2025-2030 (%)
Data Table on Flexible - Year-over-year growth 2025-2030 (%)

8.4 Rigid - Market size and forecast 2025-2030

Chart on Rigid - Market size and forecast 2025-2030 ($ million)
Data Table on Rigid - Market size and forecast 2025-2030 ($ million)
Chart on Rigid - Year-over-year growth 2025-2030 (%)
Data Table on Rigid - Year-over-year growth 2025-2030 (%)

8.5 Foam - Market size and forecast 2025-2030

Chart on Foam - Market size and forecast 2025-2030 ($ million)
Data Table on Foam - Market size and forecast 2025-2030 ($ million)
Chart on Foam - Year-over-year growth 2025-2030 (%)
Data Table on Foam - Year-over-year growth 2025-2030 (%)

8.6 Market opportunity by Type

Market opportunity by Type ($ million)
Data Table on Market opportunity by Type ($ million)

9. Market Segmentation by End-user

9.1 Market segments

Chart on End-user - Market share 2025-2030 (%)
Data Table on End-user - Market share 2025-2030 (%)

9.2 Comparison by End-user

Chart on Comparison by End-user
Data Table on Comparison by End-user

9.3 Food and beverages - Market size and forecast 2025-2030

Chart on Food and beverages - Market size and forecast 2025-2030 ($ million)
Data Table on Food and beverages - Market size and forecast 2025-2030 ($ million)
Chart on Food and beverages - Year-over-year growth 2025-2030 (%)
Data Table on Food and beverages - Year-over-year growth 2025-2030 (%)

9.4 Industrial goods - Market size and forecast 2025-2030

Chart on Industrial goods - Market size and forecast 2025-2030 ($ million)
Data Table on Industrial goods - Market size and forecast 2025-2030 ($ million)
Chart on Industrial goods - Year-over-year growth 2025-2030 (%)
Data Table on Industrial goods - Year-over-year growth 2025-2030 (%)

9.5 Consumer electronics - Market size and forecast 2025-2030

Chart on Consumer electronics - Market size and forecast 2025-2030 ($ million)
Data Table on Consumer electronics - Market size and forecast 2025-2030 ($ million)
Chart on Consumer electronics - Year-over-year growth 2025-2030 (%)
Data Table on Consumer electronics - Year-over-year growth 2025-2030 (%)

9.6 Household appliances - Market size and forecast 2025-2030

Chart on Household appliances - Market size and forecast 2025-2030 ($ million)
Data Table on Household appliances - Market size and forecast 2025-2030 ($ million)
Chart on Household appliances - Year-over-year growth 2025-2030 (%)
Data Table on Household appliances - Year-over-year growth 2025-2030 (%)

9.7 Others - Market size and forecast 2025-2030

Chart on Others - Market size and forecast 2025-2030 ($ million)
Data Table on Others - Market size and forecast 2025-2030 ($ million)
Chart on Others - Year-over-year growth 2025-2030 (%)
Data Table on Others - Year-over-year growth 2025-2030 (%)

9.8 Market opportunity by End-user

Market opportunity by End-user ($ million)
Data Table on Market opportunity by End-user ($ million)

10. Market Segmentation by Material

10.1 Market segments

Chart on Material - Market share 2025-2030 (%)
Data Table on Material - Market share 2025-2030 (%)

10.2 Comparison by Material

Chart on Comparison by Material
Data Table on Comparison by Material

10.3 Plastic - Market size and forecast 2025-2030

Chart on Plastic - Market size and forecast 2025-2030 ($ million)
Data Table on Plastic - Market size and forecast 2025-2030 ($ million)
Chart on Plastic - Year-over-year growth 2025-2030 (%)
Data Table on Plastic - Year-over-year growth 2025-2030 (%)

10.4 Paper and paperboard - Market size and forecast 2025-2030

Chart on Paper and paperboard - Market size and forecast 2025-2030 ($ million)
Data Table on Paper and paperboard - Market size and forecast 2025-2030 ($ million)
Chart on Paper and paperboard - Year-over-year growth 2025-2030 (%)
Data Table on Paper and paperboard - Year-over-year growth 2025-2030 (%)

10.5 Others - Market size and forecast 2025-2030

Chart on Others - Market size and forecast 2025-2030 ($ million)
Data Table on Others - Market size and forecast 2025-2030 ($ million)
Chart on Others - Year-over-year growth 2025-2030 (%)
Data Table on Others - Year-over-year growth 2025-2030 (%)

10.6 Market opportunity by Material

Market opportunity by Material ($ million)
Data Table on Market opportunity by Material ($ million)

11. Customer Landscape

11.1 Customer landscape overview

Analysis of price sensitivity, lifecycle, customer purchase basket, adoption rates, and purchase criteria

12. Geographic Landscape

12.1 Geographic segmentation

Chart on Market share by geography 2025-2030 (%)
Data Table on Market share by geography 2025-2030 (%)

12.2 Geographic comparison

Chart on Geographic comparison
Data Table on Geographic comparison

12.3 APAC - Market size and forecast 2025-2030

Chart on APAC - Market size and forecast 2025-2030 ($ million)
Data Table on APAC - Market size and forecast 2025-2030 ($ million)
Chart on APAC - Year-over-year growth 2025-2030 (%)
Data Table on APAC - Year-over-year growth 2025-2030 (%)
Chart on Regional Comparison - APAC
Data Table on Regional Comparison - APAC

12.3.1 China - Market size and forecast 2025-2030

Chart on China - Market size and forecast 2025-2030 ($ million)
Data Table on China - Market size and forecast 2025-2030 ($ million)
Chart on China - Year-over-year growth 2025-2030 (%)
Data Table on China - Year-over-year growth 2025-2030 (%)

12.3.2 India - Market size and forecast 2025-2030

Chart on India - Market size and forecast 2025-2030 ($ million)
Data Table on India - Market size and forecast 2025-2030 ($ million)
Chart on India - Year-over-year growth 2025-2030 (%)
Data Table on India - Year-over-year growth 2025-2030 (%)

12.3.3 Japan - Market size and forecast 2025-2030

Chart on Japan - Market size and forecast 2025-2030 ($ million)
Data Table on Japan - Market size and forecast 2025-2030 ($ million)
Chart on Japan - Year-over-year growth 2025-2030 (%)
Data Table on Japan - Year-over-year growth 2025-2030 (%)

12.3.4 South Korea - Market size and forecast 2025-2030

Chart on South Korea - Market size and forecast 2025-2030 ($ million)
Data Table on South Korea - Market size and forecast 2025-2030 ($ million)
Chart on South Korea - Year-over-year growth 2025-2030 (%)
Data Table on South Korea - Year-over-year growth 2025-2030 (%)

12.3.5 Australia - Market size and forecast 2025-2030

Chart on Australia - Market size and forecast 2025-2030 ($ million)
Data Table on Australia - Market size and forecast 2025-2030 ($ million)
Chart on Australia - Year-over-year growth 2025-2030 (%)
Data Table on Australia - Year-over-year growth 2025-2030 (%)

12.3.6 Indonesia - Market size and forecast 2025-2030

Chart on Indonesia - Market size and forecast 2025-2030 ($ million)
Data Table on Indonesia - Market size and forecast 2025-2030 ($ million)
Chart on Indonesia - Year-over-year growth 2025-2030 (%)
Data Table on Indonesia - Year-over-year growth 2025-2030 (%)

12.4 North America - Market size and forecast 2025-2030

Chart on North America - Market size and forecast 2025-2030 ($ million)
Data Table on North America - Market size and forecast 2025-2030 ($ million)
Chart on North America - Year-over-year growth 2025-2030 (%)
Data Table on North America - Year-over-year growth 2025-2030 (%)
Chart on Regional Comparison - North America
Data Table on Regional Comparison - North America

12.4.1 US - Market size and forecast 2025-2030

Chart on US - Market size and forecast 2025-2030 ($ million)
Data Table on US - Market size and forecast 2025-2030 ($ million)
Chart on US - Year-over-year growth 2025-2030 (%)
Data Table on US - Year-over-year growth 2025-2030 (%)

12.4.2 Canada - Market size and forecast 2025-2030

Chart on Canada - Market size and forecast 2025-2030 ($ million)
Data Table on Canada - Market size and forecast 2025-2030 ($ million)
Chart on Canada - Year-over-year growth 2025-2030 (%)
Data Table on Canada - Year-over-year growth 2025-2030 (%)

12.4.3 Mexico - Market size and forecast 2025-2030

Chart on Mexico - Market size and forecast 2025-2030 ($ million)
Data Table on Mexico - Market size and forecast 2025-2030 ($ million)
Chart on Mexico - Year-over-year growth 2025-2030 (%)
Data Table on Mexico - Year-over-year growth 2025-2030 (%)

12.5 Europe - Market size and forecast 2025-2030

Chart on Europe - Market size and forecast 2025-2030 ($ million)
Data Table on Europe - Market size and forecast 2025-2030 ($ million)
Chart on Europe - Year-over-year growth 2025-2030 (%)
Data Table on Europe - Year-over-year growth 2025-2030 (%)
Chart on Regional Comparison - Europe
Data Table on Regional Comparison - Europe

12.5.1 Germany - Market size and forecast 2025-2030

Chart on Germany - Market size and forecast 2025-2030 ($ million)
Data Table on Germany - Market size and forecast 2025-2030 ($ million)
Chart on Germany - Year-over-year growth 2025-2030 (%)
Data Table on Germany - Year-over-year growth 2025-2030 (%)

12.5.2 UK - Market size and forecast 2025-2030

Chart on UK - Market size and forecast 2025-2030 ($ million)
Data Table on UK - Market size and forecast 2025-2030 ($ million)
Chart on UK - Year-over-year growth 2025-2030 (%)
Data Table on UK - Year-over-year growth 2025-2030 (%)

12.5.3 France - Market size and forecast 2025-2030

Chart on France - Market size and forecast 2025-2030 ($ million)
Data Table on France - Market size and forecast 2025-2030 ($ million)
Chart on France - Year-over-year growth 2025-2030 (%)
Data Table on France - Year-over-year growth 2025-2030 (%)

12.5.4 Italy - Market size and forecast 2025-2030

Chart on Italy - Market size and forecast 2025-2030 ($ million)
Data Table on Italy - Market size and forecast 2025-2030 ($ million)
Chart on Italy - Year-over-year growth 2025-2030 (%)
Data Table on Italy - Year-over-year growth 2025-2030 (%)

12.5.5 Spain - Market size and forecast 2025-2030

Chart on Spain - Market size and forecast 2025-2030 ($ million)
Data Table on Spain - Market size and forecast 2025-2030 ($ million)
Chart on Spain - Year-over-year growth 2025-2030 (%)
Data Table on Spain - Year-over-year growth 2025-2030 (%)

12.5.6 The Netherlands - Market size and forecast 2025-2030

Chart on The Netherlands - Market size and forecast 2025-2030 ($ million)
Data Table on The Netherlands - Market size and forecast 2025-2030 ($ million)
Chart on The Netherlands - Year-over-year growth 2025-2030 (%)
Data Table on The Netherlands - Year-over-year growth 2025-2030 (%)

12.6 Middle East and Africa - Market size and forecast 2025-2030

Chart on Middle East and Africa - Market size and forecast 2025-2030 ($ million)
Data Table on Middle East and Africa - Market size and forecast 2025-2030 ($ million)
Chart on Middle East and Africa - Year-over-year growth 2025-2030 (%)
Data Table on Middle East and Africa - Year-over-year growth 2025-2030 (%)
Chart on Regional Comparison - Middle East and Africa
Data Table on Regional Comparison - Middle East and Africa

12.6.1 South Africa - Market size and forecast 2025-2030

Chart on South Africa - Market size and forecast 2025-2030 ($ million)
Data Table on South Africa - Market size and forecast 2025-2030 ($ million)
Chart on South Africa - Year-over-year growth 2025-2030 (%)
Data Table on South Africa - Year-over-year growth 2025-2030 (%)

12.6.2 UAE - Market size and forecast 2025-2030

Chart on UAE - Market size and forecast 2025-2030 ($ million)
Data Table on UAE - Market size and forecast 2025-2030 ($ million)
Chart on UAE - Year-over-year growth 2025-2030 (%)
Data Table on UAE - Year-over-year growth 2025-2030 (%)

12.6.3 Saudi Arabia - Market size and forecast 2025-2030

Chart on Saudi Arabia - Market size and forecast 2025-2030 ($ million)
Data Table on Saudi Arabia - Market size and forecast 2025-2030 ($ million)
Chart on Saudi Arabia - Year-over-year growth 2025-2030 (%)
Data Table on Saudi Arabia - Year-over-year growth 2025-2030 (%)

12.6.4 Israel - Market size and forecast 2025-2030

Chart on Israel - Market size and forecast 2025-2030 ($ million)
Data Table on Israel - Market size and forecast 2025-2030 ($ million)
Chart on Israel - Year-over-year growth 2025-2030 (%)
Data Table on Israel - Year-over-year growth 2025-2030 (%)

12.6.5 Turkey - Market size and forecast 2025-2030

Chart on Turkey - Market size and forecast 2025-2030 ($ million)
Data Table on Turkey - Market size and forecast 2025-2030 ($ million)
Chart on Turkey - Year-over-year growth 2025-2030 (%)
Data Table on Turkey - Year-over-year growth 2025-2030 (%)

12.7 South America - Market size and forecast 2025-2030

Chart on South America - Market size and forecast 2025-2030 ($ million)
Data Table on South America - Market size and forecast 2025-2030 ($ million)
Chart on South America - Year-over-year growth 2025-2030 (%)
Data Table on South America - Year-over-year growth 2025-2030 (%)
Chart on Regional Comparison - South America
Data Table on Regional Comparison - South America

12.7.1 Brazil - Market size and forecast 2025-2030

Chart on Brazil - Market size and forecast 2025-2030 ($ million)
Data Table on Brazil - Market size and forecast 2025-2030 ($ million)
Chart on Brazil - Year-over-year growth 2025-2030 (%)
Data Table on Brazil - Year-over-year growth 2025-2030 (%)

12.7.2 Argentina - Market size and forecast 2025-2030

Chart on Argentina - Market size and forecast 2025-2030 ($ million)
Data Table on Argentina - Market size and forecast 2025-2030 ($ million)
Chart on Argentina - Year-over-year growth 2025-2030 (%)
Data Table on Argentina - Year-over-year growth 2025-2030 (%)

12.7.3 Chile - Market size and forecast 2025-2030

Chart on Chile - Market size and forecast 2025-2030 ($ million)
Data Table on Chile - Market size and forecast 2025-2030 ($ million)
Chart on Chile - Year-over-year growth 2025-2030 (%)
Data Table on Chile - Year-over-year growth 2025-2030 (%)

12.8 Market opportunity by geography

Market opportunity by geography ($ million)
Data Tables on Market opportunity by geography ($ million)

13. Drivers, Challenges, and Opportunity

13.1 Market drivers

Growth of e-commerce sector
Rise in demand for secondary and protective packaging for packed food products
Increasing demand of consumer electronics

13.2 Market challenges

High capital cost of protective packaging
Maintaining product quality of protective packaging
Compliance with evolving regulations in packaging solutions

13.3 Impact of drivers and challenges

Impact of drivers and challenges in 2025 and 2030

13.4 Market opportunities

Emergence of new recycling techniques for flexible packaging
Active participation in manufacturing and supply of protective packaging by third-party logistics companies
Growing globalization and international trade in protective packaging market

14. Competitive Landscape

14.1 Overview

14.2

Overview on criticality of inputs and factors of differentiation

14.3 Landscape disruption

Overview on factors of disruption

14.4 Industry risks

Impact of key risks on business

15. Competitive Analysis

15.1 Companies profiled

Companies covered

15.2 Company ranking index

15.3 Market positioning of companies

Matrix on companies position and classification

15.4 Avery Dennison Corp.

Avery Dennison Corp. - Overview
Avery Dennison Corp. - Business segments
Avery Dennison Corp. - Key news
Avery Dennison Corp. - Key offerings
Avery Dennison Corp. - Segment focus
SWOT

15.5 Berry Global Inc.

Berry Global Inc. - Overview
Berry Global Inc. - Business segments
Berry Global Inc. - Key news
Berry Global Inc. - Key offerings
Berry Global Inc. - Segment focus
SWOT

15.6 Black Diamond Capital

Black Diamond Capital - Overview
Black Diamond Capital - Product / Service
Black Diamond Capital - Key offerings
SWOT

15.7 Cascades Inc.

Cascades Inc. - Overview
Cascades Inc. - Business segments
Cascades Inc. - Key offerings
Cascades Inc. - Segment focus
SWOT

15.8 Crown Holdings Inc.

Crown Holdings Inc. - Overview
Crown Holdings Inc. - Business segments
Crown Holdings Inc. - Key offerings
Crown Holdings Inc. - Segment focus
SWOT

15.9 Dow Chemical Co.

Dow Chemical Co. - Overview
Dow Chemical Co. - Business segments
Dow Chemical Co. - Key news
Dow Chemical Co. - Key offerings
Dow Chemical Co. - Segment focus
SWOT

15.10 DS Smith Plc

DS Smith Plc - Overview
DS Smith Plc - Business segments
DS Smith Plc - Key news
DS Smith Plc - Key offerings
DS Smith Plc - Segment focus
SWOT

15.11 Hanchett Paper Co.

Hanchett Paper Co. - Overview
Hanchett Paper Co. - Product / Service
Hanchett Paper Co. - Key offerings
SWOT

15.12 International Paper Co.

International Paper Co. - Overview
International Paper Co. - Business segments
International Paper Co. - Key news
International Paper Co. - Key offerings
International Paper Co. - Segment focus
SWOT

15.13 Mondi Plc

Mondi Plc - Overview
Mondi Plc - Business segments
Mondi Plc - Key news
Mondi Plc - Key offerings
Mondi Plc - Segment focus
SWOT

15.14 Pregis LLC

Pregis LLC - Overview
Pregis LLC - Product / Service
Pregis LLC - Key offerings
SWOT

15.15 Ranpak Holdings Corp.

Ranpak Holdings Corp. - Overview
Ranpak Holdings Corp. - Product / Service
Ranpak Holdings Corp. - Key offerings
SWOT

15.16 Sealed Air Corp.

Sealed Air Corp. - Overview
Sealed Air Corp. - Business segments
Sealed Air Corp. - Key news
Sealed Air Corp. - Key offerings
Sealed Air Corp. - Segment focus
SWOT

15.17 Smurfit Kappa Group

Smurfit Kappa Group - Overview
Smurfit Kappa Group - Business segments
Smurfit Kappa Group - Key news
Smurfit Kappa Group - Key offerings
Smurfit Kappa Group - Segment focus
SWOT

15.18 WestRock Co.

WestRock Co. - Overview
WestRock Co. - Business segments
WestRock Co. - Key news
WestRock Co. - Key offerings
WestRock Co. - Segment focus
SWOT

16. Appendix

16.1 Scope of the report

Market definition
Objectives
Notes and caveats

16.2 Inclusions and exclusions checklist

Inclusions checklist
Exclusions checklist

16.3 Currency conversion rates for US$

16.4 Research methodology

16.5 Data procurement

Information sources

16.6 Data validation

16.7 Validation techniques employed for market sizing

16.8 Data synthesis

16.9 360 degree market analysis

16.10 List of abbreviations

Research Methodology

Technavio presents a detailed picture of the market by way of study, synthesis, and summation of data from multiple sources. The analysts have presented the various facets of the market with a particular focus on identifying the key industry influencers. The data thus presented is comprehensive, reliable, and the result of extensive research, both primary and secondary.

INFORMATION SOURCES

Primary sources

  • Manufacturers and suppliers
  • Channel partners
  • Industry experts
  • Strategic decision makers

Secondary sources

  • Industry journals and periodicals
  • Government data
  • Financial reports of key industry players
  • Historical data
  • Press releases

DATA ANALYSIS

Data Synthesis

  • Collation of data
  • Estimation of key figures
  • Analysis of derived insights

Data Validation

  • Triangulation with data models
  • Reference against proprietary databases
  • Corroboration with industry experts

REPORT WRITING

Qualitative

  • Market drivers
  • Market challenges
  • Market trends
  • Five forces analysis

Quantitative

  • Market size and forecast
  • Market segmentation
  • Geographical insights
  • Competitive landscape

Interested in this report?

Get your sample now to see our research methodology and insights!

Download Now

Frequently Asked Questions

Protective Packaging market growth will increase by USD 6497.8 million during 2026-2030.

The Protective Packaging market is expected to grow at a CAGR of 3.5% during 2026-2030.

Protective Packaging market is segmented by Type (Flexible, Rigid, Foam) End-user (Food and beverages, Industrial goods, Consumer electronics, Household appliances, Others) Material (Plastic, Paper and paperboard, Others)

Avery Dennison Corp., Berry Global Inc., Black Diamond Capital, Cascades Inc., Crown Holdings Inc., Dow Chemical Co., DS Smith Plc, EcoEnclose, Hanchett Paper Co., International Paper Co., Mondi Plc, NEFAB GROUP, Pregis LLC, Ranpak Holdings Corp., Sealed Air Corp., Smurfit Kappa Group, Storopack Pvt. Ltd., Universal Protective Packaging, WestRock Co., Winpak Ltd. are a few of the key vendors in the Protective Packaging market.

APAC will register the highest growth rate of 40.2% among the other regions. Therefore, the Protective Packaging market in APAC is expected to garner significant business opportunities for the vendors during the forecast period.

China, India, Japan, South Korea, Australia, Indonesia, US, Canada, Mexico, Germany, UK, France, Italy, Spain, The Netherlands, South Africa, UAE, Saudi Arabia, Israel, Turkey, Brazil, Argentina, Chile

  • Growth of e-commerce sector is the driving factor this market.

The Protective Packaging market vendors should focus on grabbing business opportunities from the Type segment as it accounted for the largest market share in the base year.