Pure Play Software Testing Services Market Analysis, Size, and Forecast 2026-2030: North America (US, Canada, and Mexico), Europe (Germany, UK, and France), APAC (India, China, and Japan), South America (Brazil and Argentina), Middle East and Africa (Saudi Arabia, UAE, and South Africa), and Rest of World (ROW)

Pure Play Software Testing Services Market Analysis, Size, and Forecast 2026-2030:
North America (US, Canada, and Mexico), Europe (Germany, UK, and France), APAC (India, China, and Japan), South America (Brazil and Argentina), Middle East and Africa (Saudi Arabia, UAE, and South Africa), and Rest of World (ROW)

Published: Mar 2026 304 Pages SKU: IRTNTR43459

Market Overview at a Glance

$20.47 B
Market Opportunity
16.8%
CAGR 2025 - 2030
42.7%
North America Growth
$3.99 B
BFSI segment 2024

Pure Play Software Testing Services Market Size 2026-2030

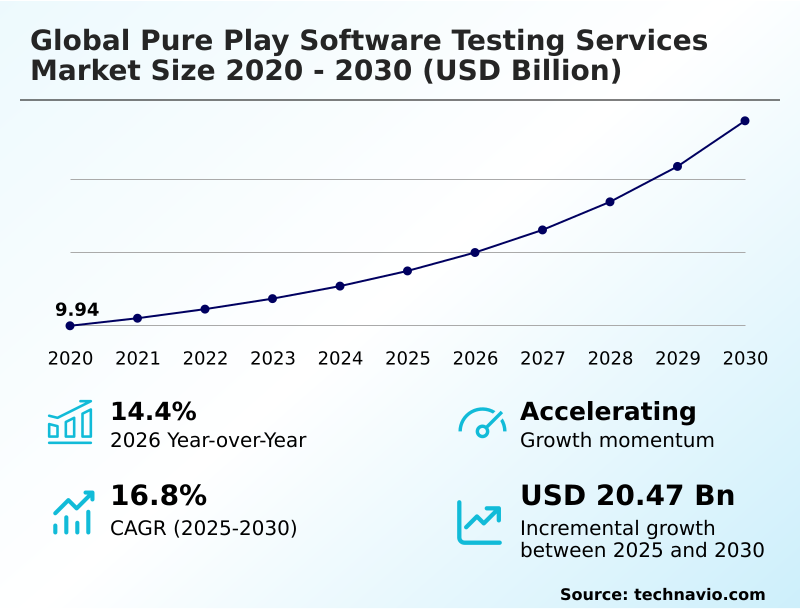
The pure play software testing services market size is valued to increase by USD 20.47 billion, at a CAGR of 16.8% from 2025 to 2030. Growing demand for high quality and bug free software across BFSI, IT, telecom, and retail sectors will drive the pure play software testing services market.

Major Market Trends & Insights

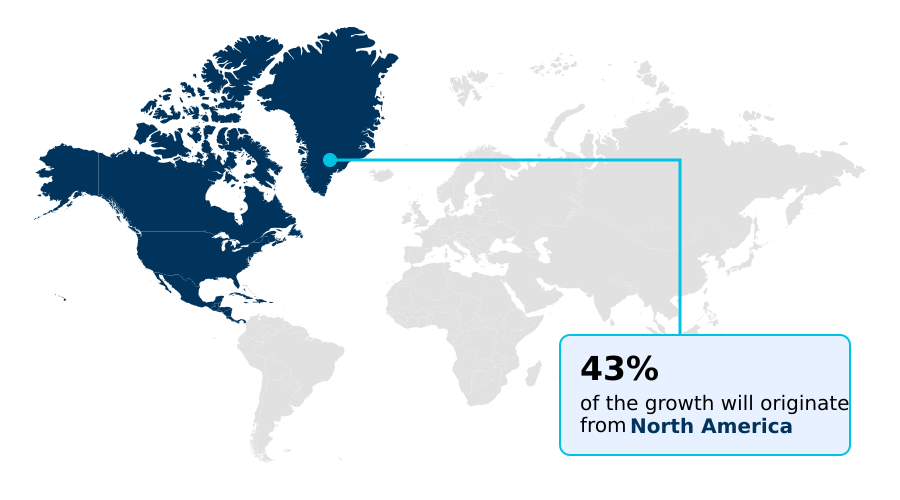
  • North America dominated the market and accounted for a 42.7% growth during the forecast period.
  • By End-user - BFSI segment was valued at USD 3.99 billion in 2024
  • By Deployment - On premises segment accounted for the largest market revenue share in 2024

Market Size & Forecast

  • Market Opportunities: USD 27.95 billion
  • Market Future Opportunities: USD 20.47 billion
  • CAGR from 2025 to 2030 : 16.8%

Market Summary

  • The pure play software testing services market is fundamentally shaped by the enterprise-wide mandate for flawless digital experiences. As organizations accelerate their digital transformation journeys, the complexity of software ecosystems escalates, making specialized quality assurance indispensable. Effective test strategy consulting is crucial for navigating this landscape, ensuring that resources are allocated efficiently.
  • A prime business scenario involves the retail sector's adoption of omnichannel platforms; here, a single glitch in the inventory system's API validation can cause widespread stock discrepancies, leading to lost sales and diminished customer trust. Consequently, businesses are prioritizing end-to-end quality engineering, integrating practices like shift-left testing to embed quality checks early in the software development lifecycle (SDLC).
  • This proactive approach, supported by robust bug tracking systems and continuous integration testing, not only ensures software reliability engineering but also aligns technological performance with strategic business objectives, safeguarding brand reputation and revenue in a fiercely competitive digital arena. This makes QA outsourcing a strategic decision for many firms.

What will be the Size of the Pure Play Software Testing Services Market during the forecast period?

Get Key Insights on Market Forecast (PDF) Request Free Sample

How is the Pure Play Software Testing Services Market Segmented?

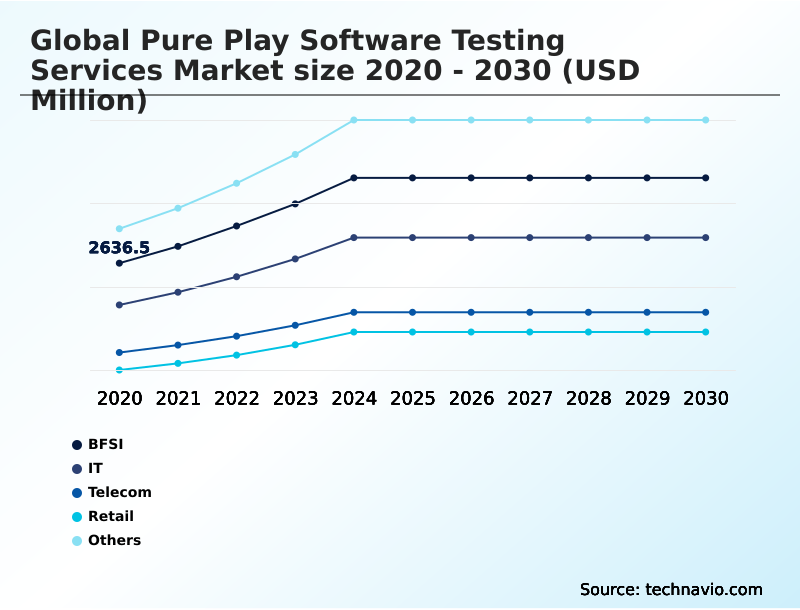
The pure play software testing services industry research report provides comprehensive data (region-wise segment analysis), with forecasts and estimates in "USD million" for the period 2026-2030, as well as historical data from 2020-2024 for the following segments.

  • End-user
    • BFSI
    • IT
    • Telecom
    • Retail
    • Others
  • Deployment
    • On premises
    • Cloud based
  • Product type
    • Compatibility
    • Usability
    • Application
    • Security performance
    • Others
  • Geography
    • North America
      • US
      • Canada
      • Mexico
    • Europe
      • Germany
      • UK
      • France
    • APAC
      • India
      • China
      • Japan
    • South America
      • Brazil
      • Argentina
    • Middle East and Africa
      • Saudi Arabia
      • UAE
      • South Africa
    • Rest of World (ROW)

By End-user Insights

The bfsi segment is estimated to witness significant growth during the forecast period.

The BFSI segment's reliance on pure play software testing services is intensifying as institutions prioritize digital-first engagement and stringent regulatory adherence.

The integration of complex technologies requires robust software validation and verification to mitigate risks associated with financial transactions and data security. A focus on continuous integration testing within DevOps pipelines has become standard, ensuring rapid, yet secure, deployment of new features.

This necessitates advanced test data management and thorough API validation to maintain system integrity.

A targeted approach using specialized test automation frameworks has demonstrated the ability to improve critical defect detection rates by over 15% pre-release, significantly reducing the risk of service disruptions and supporting end-to-end quality engineering.

Request Free Sample

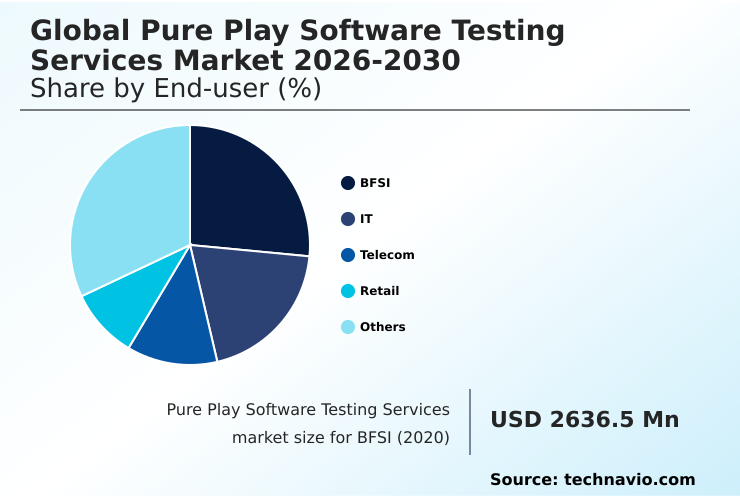
The BFSI segment was valued at USD 3.99 billion in 2024 and showed a gradual increase during the forecast period.

Request Free Sample

Regional Analysis

North America is estimated to contribute 42.7% to the growth of the global market during the forecast period.Technavio’s analysts have elaborately explained the regional trends and drivers that shape the market during the forecast period.

See How Pure Play Software Testing Services Market Demand is Rising in North America Request Free Sample

The geographic landscape of the pure play software testing services market is characterized by distinct regional dynamics and levels of maturity.

North America remains a dominant force, driven by a high concentration of technology innovators and a stringent regulatory environment that mandates rigorous software validation and verification.

This region's adoption of advanced methodologies contributes to its market leadership, with firms achieving a 25% faster bug resolution time compared to the global average.

In APAC, rapid digitalization, particularly in the BFSI and retail sectors in countries like India and China, is fueling unprecedented demand for mobile application testing and agile methodology support.

European markets, led by Germany and the UK, prioritize security and data privacy, leading to significant investment in DevSecOps and compliance-related testing, which helps reduce data breach risks by over 30%.

Market Dynamics

Our researchers analyzed the data with 2025 as the base year, along with the key drivers, trends, and challenges. A holistic analysis of drivers will help companies refine their marketing strategies to gain a competitive advantage.

  • Strategic implementation of specialized testing methodologies is becoming a critical differentiator for businesses aiming to excel in the digital-first economy. Adopting automated testing for agile development is no longer optional but a baseline requirement for maintaining pace with rapid iteration cycles.
  • For high-stakes industries, security testing for financial applications and compliance testing for healthcare software are non-negotiable mandates to protect sensitive data and meet regulatory requirements. As e-commerce continues to dominate retail, robust performance testing for e-commerce platforms is essential to prevent system failures during peak traffic, an area where failures can be twice as costly as in non-peak times.
  • The complexity of modern software architecture demands a nuanced approach, where API testing for microservices architecture and software testing for IoT devices ensure that interconnected components function seamlessly. Enterprises are increasingly turning to managed QA services for startups and established firms alike to gain access to expertise in areas like cross-browser compatibility testing services and AI in software quality assurance.
  • Establishing a cohesive QA strategy for SaaS products, incorporating best practices for automated regression testing, and ensuring functional testing for enterprise applications are foundational for long-term success. These targeted efforts in quality assurance deliver a superior end-user experience and drive significant business value.

What are the key market drivers leading to the rise in the adoption of Pure Play Software Testing Services Industry?

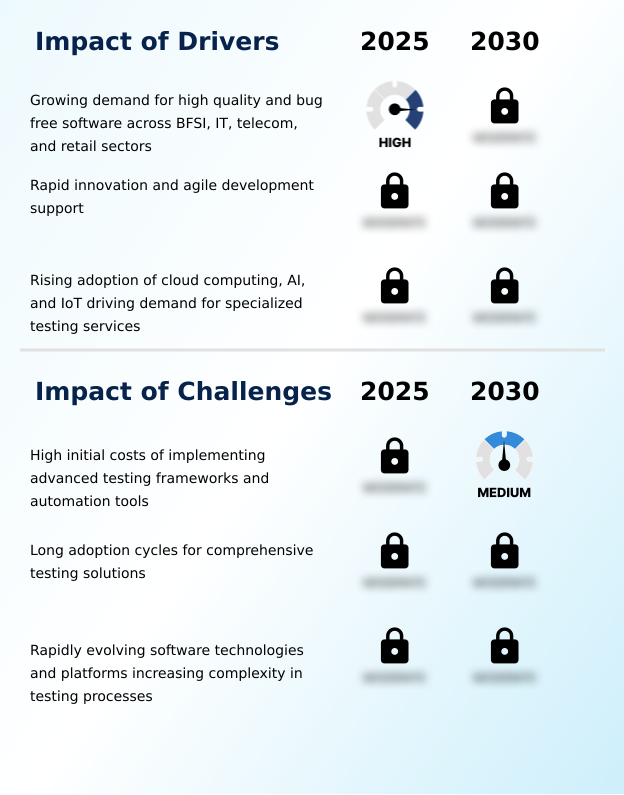
  • The growing demand for high-quality, bug-free software across the BFSI, IT, telecom, and retail sectors is a key driver for market growth.

  • The demand for high-quality, bug-free software is a primary driver fueling the growth of the pure play software testing services market. In high-stakes sectors, the performance and reliability of digital interfaces are directly tied to brand reputation and revenue.
  • This has elevated quality assurance from a technical check to a strategic business imperative, impacting customer retention and lifetime value, with studies showing that a positive user experience can improve customer loyalty by up to 25%.
  • The proliferation of mobile applications and the rise of IoT have intensified this need, demanding continuous integration testing and rigorous performance load testing.
  • As software becomes the main channel for customer interaction, organizations are focusing on shift-left testing and DevSecOps to ensure the integrity of complex digital ecosystems.
  • This cultural shift, demanding specialized non-functional testing and API validation, ensures a steady demand for professional pure play firms that can guarantee resilience and performance.

What are the market trends shaping the Pure Play Software Testing Services Industry?

  • The rapid adoption of AI-enabled and automated testing solutions is becoming a significant market trend, driven by the ongoing need for enhanced efficiency and accuracy.

  • The evolution of pure play software testing services is increasingly shaped by intelligent automation and cloud-native solutions. The rapid adoption of AI-driven testing is a primary trend, where machine learning algorithms automate test case generation and enable self-healing automation, addressing the high maintenance costs of traditional regression testing suites.
  • This shift allows for predictive analytics, identifying code areas prone to defects with over 70% accuracy. Concurrently, the use of cloud-based testing environments and real device cloud platforms supports distributed agile methodology, enabling seamless collaboration.
  • Access to test environment provisioning on demand eliminates hardware bottlenecks, with some teams reporting a 3x increase in test execution speed, while service virtualization decouples dependencies. This trend, supported by effective test data management and bug tracking systems, is moving the industry toward a more autonomous and proactive quality management model, enhancing both efficiency and accuracy.

What challenges does the Pure Play Software Testing Services Industry face during its growth?

  • High initial costs associated with implementing advanced testing frameworks and automation tools pose a key challenge to industry growth.

  • Key challenges in the pure play software testing services market stem from escalating complexity and the high costs of advanced tool adoption. The initial investment in test automation frameworks and the infrastructure for continuous deployment pipelines presents a significant barrier, particularly for small to medium enterprises. These initial setup costs can be 50% higher than traditional manual testing budgets.
  • Furthermore, the rapidly evolving technology landscape, with the rise of microservices testing and AI-driven applications, increases the complexity of testing processes. This requires a constant race to develop expertise in areas like dynamic application security testing (DAST) and chaos engineering. The shortage of skilled professionals, such as software development engineers in test, further exacerbates this issue.
  • Long adoption cycles in large organizations, often due to bureaucratic inertia and resistance to change, also delay the implementation of modern end-to-end quality engineering practices, hindering the realization of efficiency gains.

Exclusive Technavio Analysis on Customer Landscape

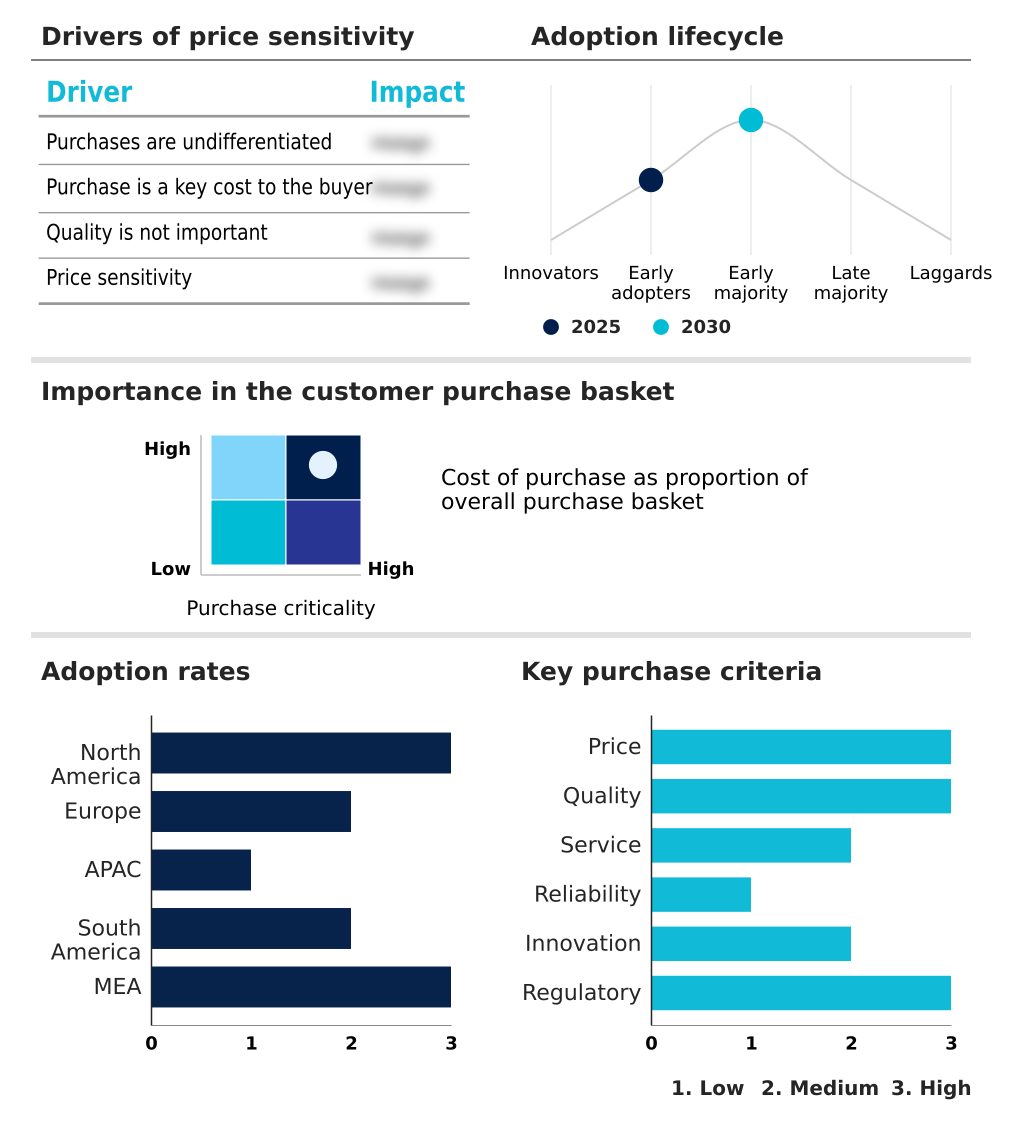
The pure play software testing services market forecasting report includes the adoption lifecycle of the market, covering from the innovator’s stage to the laggard’s stage. It focuses on adoption rates in different regions based on penetration. Furthermore, the pure play software testing services market report also includes key purchase criteria and drivers of price sensitivity to help companies evaluate and develop their market growth analysis strategies.

Customer Landscape of Pure Play Software Testing Services Industry

Competitive Landscape

Companies are implementing various strategies, such as strategic alliances, pure play software testing services market forecast, partnerships, mergers and acquisitions, geographical expansion, and product/service launches, to enhance their presence in the industry.

a1qa software testing co. - Core offerings include specialized pure play software testing services, encompassing digital assurance, comprehensive functional testing, and advanced security testing to ensure application reliability and performance.

The industry research and growth report includes detailed analyses of the competitive landscape of the market and information about key companies, including:

  • a1qa software testing co.
  • Applause App Quality Inc.
  • AppSierra
  • Cigniti Technologies Ltd.
  • DeviQA Solutions
  • Global App Testing
  • Indium Software India Ltd.
  • Kualitatem Inc.
  • Planit Test Management Solutions
  • QA Mentor Inc.
  • QA TestLab Solutions Ltd.
  • QASource
  • QualiTest Group
  • QualityLogic Inc.
  • ScienceSoft USA Corp.
  • Test Yantra Software
  • Testfort
  • TestingXperts
  • Testlio Inc.
  • Testrig Technologies

Qualitative and quantitative analysis of companies has been conducted to help clients understand the wider business environment as well as the strengths and weaknesses of key industry players. Data is qualitatively analyzed to categorize companies as pure play, category-focused, industry-focused, and diversified; it is quantitatively analyzed to categorize companies as dominant, leading, strong, tentative, and weak.

Recent Development and News in Pure play software testing services market

  • In January 2025, TCS announced a strategic partnership with a major European investment firm to provide comprehensive testing for their next-generation trading platform, utilizing advanced synthetic data generation.
  • In February 2025, Capgemini revealed a major collaboration with a leading North American software provider to automate their entire regression suite using generative AI, reducing product launch times by 40%.
  • In March 2025, Amdocs announced the successful implementation of an autonomous testing framework for a major Asian telecommunications operator, which used machine learning to predict and prevent network outages.
  • In May 2025, Cognizant was awarded a contract by a national health agency to perform comprehensive security and performance testing on its new centralized patient data portal.

Dive into Technavio’s robust research methodology, blending expert interviews, extensive data synthesis, and validated models for unparalleled Pure Play Software Testing Services Market insights. See full methodology.

Market Scope
Page number 304
Base year 2025
Historic period 2020-2024
Forecast period 2026-2030
Growth momentum & CAGR Accelerate at a CAGR of 16.8%
Market growth 2026-2030 USD 20474.3 million
Market structure Fragmented
YoY growth 2025-2026(%) 14.4%
Key countries US, Canada, Mexico, Germany, UK, France, Italy, Spain, The Netherlands, India, China, Japan, South Korea, Australia, Indonesia, Brazil, Argentina, Chile, Saudi Arabia, UAE, South Africa, Israel and Turkey
Competitive landscape Leading Companies, Market Positioning of Companies, Competitive Strategies, and Industry Risks

Request Free Sample

Research Analyst Overview

  • The pure play software testing services market is driven by the critical need for software integrity in an increasingly complex digital ecosystem. The adoption of test automation frameworks and comprehensive regression testing suites is fundamental for organizations implementing an agile methodology.
  • For boardroom-level strategy, the focus on security penetration testing and DevSecOps is paramount, as a single vulnerability can have severe financial and reputational consequences. Organizations that integrate shift-left testing and continuous integration testing into their software development lifecycle (SDLC) have been shown to reduce post-release defects by up to 40%.
  • The market is also seeing a rise in specialized services, including performance load testing, API validation for microservices testing, and mobile application testing. Effective test data management and the use of service virtualization are key to creating reliable testing environments.
  • As applications become more sophisticated, non-functional testing areas like usability testing, accessibility compliance testing, and cross-browser testing are becoming standard requirements, ensuring a seamless user experience and broadening market reach for digital products.

What are the Key Data Covered in this Pure Play Software Testing Services Market Research and Growth Report?

  • What is the expected growth of the Pure Play Software Testing Services Market between 2026 and 2030?

    • USD 20.47 billion, at a CAGR of 16.8%

  • What segmentation does the market report cover?

    • The report is segmented by End-user (BFSI, IT, Telecom, Retail, and Others), Deployment (On premises, and Cloud based), Product Type (Compatibility, Usability, Application, Security performance, and Others) and Geography (North America, Europe, APAC, South America, Middle East and Africa)

  • Which regions are analyzed in the report?

    • North America, Europe, APAC, South America and Middle East and Africa

  • What are the key growth drivers and market challenges?

    • Growing demand for high quality and bug free software across BFSI, IT, telecom, and retail sectors, High initial costs of implementing advanced testing frameworks and automation tools

  • Who are the major players in the Pure Play Software Testing Services Market?

    • a1qa software testing co., Applause App Quality Inc., AppSierra, Cigniti Technologies Ltd., DeviQA Solutions, Global App Testing, Indium Software India Ltd., Kualitatem Inc., Planit Test Management Solutions, QA Mentor Inc., QA TestLab Solutions Ltd., QASource, QualiTest Group, QualityLogic Inc., ScienceSoft USA Corp., Test Yantra Software, Testfort, TestingXperts, Testlio Inc. and Testrig Technologies

Market Research Insights

  • Market dynamics are increasingly influenced by the strategic adoption of advanced quality assurance practices that deliver measurable business outcomes. Organizations leveraging managed testing services report up to a 30% acceleration in release management cycles, directly impacting time-to-market. The implementation of sophisticated bug triage process optimizations has been shown to improve development resource efficiency by over 20%.
  • Furthermore, a commitment to comprehensive software composition analysis enables firms to reduce security vulnerabilities from third-party code by more than 40%. This emphasis on quantifiable improvements is driving demand for test strategy consulting that aligns QA outsourcing with core business objectives, ensuring that investments in quality translate into tangible competitive advantages and enhanced software reliability engineering.

We can help! Our analysts can customize this pure play software testing services market research report to meet your requirements.

Get in touch

1. Executive Summary

1.1 Market overview

Executive Summary - Chart on Market Overview
Executive Summary - Data Table on Market Overview
Executive Summary - Chart on Global Market Characteristics
Executive Summary - Chart on Market by Geography
Executive Summary - Chart on Market Segmentation by End-user
Executive Summary - Chart on Market Segmentation by Deployment
Executive Summary - Chart on Market Segmentation by Product Type
Executive Summary - Chart on Incremental Growth
Executive Summary - Data Table on Incremental Growth
Executive Summary - Chart on Company Market Positioning

2. Technavio Analysis

2.1 Analysis of price sensitivity, lifecycle, customer purchase basket, adoption rates, and purchase criteria

2.2 Criticality of inputs and Factors of differentiation

Chart on Overview on criticality of inputs and factors of differentiation

2.3 Factors of disruption

Chart on Overview on factors of disruption

2.4 Impact of drivers and challenges

Chart on Impact of drivers and challenges in 2025 and 2030

3. Market Landscape

3.1 Market ecosystem

Chart on Parent Market
Data Table on - Parent Market

3.2 Market characteristics

Chart on Market characteristics analysis

3.3 Value chain analysis

Chart on Value chain analysis

4. Market Sizing

4.1 Market definition

Data Table on Offerings of companies included in the market definition

4.2 Market segment analysis

Market segments

4.3 Market size 2025

4.4 Market outlook: Forecast for 2025-2030

Chart on Global - Market size and forecast 2025-2030 ($ million)
Data Table on Global - Market size and forecast 2025-2030 ($ million)
Chart on Global Market: Year-over-year growth 2025-2030 (%)
Data Table on Global Market: Year-over-year growth 2025-2030 (%)

5. Historic Market Size

5.1 Global Pure Play Software Testing Services Market 2020 - 2024

Historic Market Size - Data Table on Global Pure Play Software Testing Services Market 2020 - 2024 ($ million)

5.2 End-user segment analysis 2020 - 2024

Historic Market Size - End-user Segment 2020 - 2024 ($ million)

5.3 Deployment segment analysis 2020 - 2024

Historic Market Size - Deployment Segment 2020 - 2024 ($ million)

5.4 Product Type segment analysis 2020 - 2024

Historic Market Size - Product Type Segment 2020 - 2024 ($ million)

5.5 Geography segment analysis 2020 - 2024

Historic Market Size - Geography Segment 2020 - 2024 ($ million)

5.6 Country segment analysis 2020 - 2024

Historic Market Size - Country Segment 2020 - 2024 ($ million)

6. Qualitative Analysis

6.1 Impact of AI on Global Pure Play Software Testing Services Market

6.2 Impact of Geopolitical Conflicts on Global Pure Play Software Testing Services Market

7. Five Forces Analysis

7.1 Five forces summary

Five forces analysis - Comparison between 2025 and 2030

7.2 Bargaining power of buyers

Bargaining power of buyers - Impact of key factors 2025 and 2030

7.3 Bargaining power of suppliers

Bargaining power of suppliers - Impact of key factors in 2025 and 2030

7.4 Threat of new entrants

Threat of new entrants - Impact of key factors in 2025 and 2030

7.5 Threat of substitutes

Threat of substitutes - Impact of key factors in 2025 and 2030

7.6 Threat of rivalry

Threat of rivalry - Impact of key factors in 2025 and 2030

7.7 Market condition

Chart on Market condition - Five forces 2025 and 2030

8. Market Segmentation by End-user

8.1 Market segments

Chart on End-user - Market share 2025-2030 (%)
Data Table on End-user - Market share 2025-2030 (%)

8.2 Comparison by End-user

Chart on Comparison by End-user
Data Table on Comparison by End-user

8.3 BFSI - Market size and forecast 2025-2030

Chart on BFSI - Market size and forecast 2025-2030 ($ million)
Data Table on BFSI - Market size and forecast 2025-2030 ($ million)
Chart on BFSI - Year-over-year growth 2025-2030 (%)
Data Table on BFSI - Year-over-year growth 2025-2030 (%)

8.4 IT - Market size and forecast 2025-2030

Chart on IT - Market size and forecast 2025-2030 ($ million)
Data Table on IT - Market size and forecast 2025-2030 ($ million)
Chart on IT - Year-over-year growth 2025-2030 (%)
Data Table on IT - Year-over-year growth 2025-2030 (%)

8.5 Telecom - Market size and forecast 2025-2030

Chart on Telecom - Market size and forecast 2025-2030 ($ million)
Data Table on Telecom - Market size and forecast 2025-2030 ($ million)
Chart on Telecom - Year-over-year growth 2025-2030 (%)
Data Table on Telecom - Year-over-year growth 2025-2030 (%)

8.6 Retail - Market size and forecast 2025-2030

Chart on Retail - Market size and forecast 2025-2030 ($ million)
Data Table on Retail - Market size and forecast 2025-2030 ($ million)
Chart on Retail - Year-over-year growth 2025-2030 (%)
Data Table on Retail - Year-over-year growth 2025-2030 (%)

8.7 Others - Market size and forecast 2025-2030

Chart on Others - Market size and forecast 2025-2030 ($ million)
Data Table on Others - Market size and forecast 2025-2030 ($ million)
Chart on Others - Year-over-year growth 2025-2030 (%)
Data Table on Others - Year-over-year growth 2025-2030 (%)

8.8 Market opportunity by End-user

Market opportunity by End-user ($ million)
Data Table on Market opportunity by End-user ($ million)

9. Market Segmentation by Deployment

9.1 Market segments

Chart on Deployment - Market share 2025-2030 (%)
Data Table on Deployment - Market share 2025-2030 (%)

9.2 Comparison by Deployment

Chart on Comparison by Deployment
Data Table on Comparison by Deployment

9.3 On premises - Market size and forecast 2025-2030

Chart on On premises - Market size and forecast 2025-2030 ($ million)
Data Table on On premises - Market size and forecast 2025-2030 ($ million)
Chart on On premises - Year-over-year growth 2025-2030 (%)
Data Table on On premises - Year-over-year growth 2025-2030 (%)

9.4 Cloud based - Market size and forecast 2025-2030

Chart on Cloud based - Market size and forecast 2025-2030 ($ million)
Data Table on Cloud based - Market size and forecast 2025-2030 ($ million)
Chart on Cloud based - Year-over-year growth 2025-2030 (%)
Data Table on Cloud based - Year-over-year growth 2025-2030 (%)

9.5 Market opportunity by Deployment

Market opportunity by Deployment ($ million)
Data Table on Market opportunity by Deployment ($ million)

10. Market Segmentation by Product Type

10.1 Market segments

Chart on Product Type - Market share 2025-2030 (%)
Data Table on Product Type - Market share 2025-2030 (%)

10.2 Comparison by Product Type

Chart on Comparison by Product Type
Data Table on Comparison by Product Type

10.3 Compatibility - Market size and forecast 2025-2030

Chart on Compatibility - Market size and forecast 2025-2030 ($ million)
Data Table on Compatibility - Market size and forecast 2025-2030 ($ million)
Chart on Compatibility - Year-over-year growth 2025-2030 (%)
Data Table on Compatibility - Year-over-year growth 2025-2030 (%)

10.4 Usability - Market size and forecast 2025-2030

Chart on Usability - Market size and forecast 2025-2030 ($ million)
Data Table on Usability - Market size and forecast 2025-2030 ($ million)
Chart on Usability - Year-over-year growth 2025-2030 (%)
Data Table on Usability - Year-over-year growth 2025-2030 (%)

10.5 Application - Market size and forecast 2025-2030

Chart on Application - Market size and forecast 2025-2030 ($ million)
Data Table on Application - Market size and forecast 2025-2030 ($ million)
Chart on Application - Year-over-year growth 2025-2030 (%)
Data Table on Application - Year-over-year growth 2025-2030 (%)

10.6 Security performance - Market size and forecast 2025-2030

Chart on Security performance - Market size and forecast 2025-2030 ($ million)
Data Table on Security performance - Market size and forecast 2025-2030 ($ million)
Chart on Security performance - Year-over-year growth 2025-2030 (%)
Data Table on Security performance - Year-over-year growth 2025-2030 (%)

10.7 Others - Market size and forecast 2025-2030

Chart on Others - Market size and forecast 2025-2030 ($ million)
Data Table on Others - Market size and forecast 2025-2030 ($ million)
Chart on Others - Year-over-year growth 2025-2030 (%)
Data Table on Others - Year-over-year growth 2025-2030 (%)

10.8 Market opportunity by Product Type

Market opportunity by Product Type ($ million)
Data Table on Market opportunity by Product Type ($ million)

11. Customer Landscape

11.1 Customer landscape overview

Analysis of price sensitivity, lifecycle, customer purchase basket, adoption rates, and purchase criteria

12. Geographic Landscape

12.1 Geographic segmentation

Chart on Market share by geography 2025-2030 (%)
Data Table on Market share by geography 2025-2030 (%)

12.2 Geographic comparison

Chart on Geographic comparison
Data Table on Geographic comparison

12.3 North America - Market size and forecast 2025-2030

Chart on North America - Market size and forecast 2025-2030 ($ million)
Data Table on North America - Market size and forecast 2025-2030 ($ million)
Chart on North America - Year-over-year growth 2025-2030 (%)
Data Table on North America - Year-over-year growth 2025-2030 (%)
Chart on Regional Comparison - North America
Data Table on Regional Comparison - North America

12.3.1 US - Market size and forecast 2025-2030

Chart on US - Market size and forecast 2025-2030 ($ million)
Data Table on US - Market size and forecast 2025-2030 ($ million)
Chart on US - Year-over-year growth 2025-2030 (%)
Data Table on US - Year-over-year growth 2025-2030 (%)

12.3.2 Canada - Market size and forecast 2025-2030

Chart on Canada - Market size and forecast 2025-2030 ($ million)
Data Table on Canada - Market size and forecast 2025-2030 ($ million)
Chart on Canada - Year-over-year growth 2025-2030 (%)
Data Table on Canada - Year-over-year growth 2025-2030 (%)

12.3.3 Mexico - Market size and forecast 2025-2030

Chart on Mexico - Market size and forecast 2025-2030 ($ million)
Data Table on Mexico - Market size and forecast 2025-2030 ($ million)
Chart on Mexico - Year-over-year growth 2025-2030 (%)
Data Table on Mexico - Year-over-year growth 2025-2030 (%)

12.4 Europe - Market size and forecast 2025-2030

Chart on Europe - Market size and forecast 2025-2030 ($ million)
Data Table on Europe - Market size and forecast 2025-2030 ($ million)
Chart on Europe - Year-over-year growth 2025-2030 (%)
Data Table on Europe - Year-over-year growth 2025-2030 (%)
Chart on Regional Comparison - Europe
Data Table on Regional Comparison - Europe

12.4.1 Germany - Market size and forecast 2025-2030

Chart on Germany - Market size and forecast 2025-2030 ($ million)
Data Table on Germany - Market size and forecast 2025-2030 ($ million)
Chart on Germany - Year-over-year growth 2025-2030 (%)
Data Table on Germany - Year-over-year growth 2025-2030 (%)

12.4.2 UK - Market size and forecast 2025-2030

Chart on UK - Market size and forecast 2025-2030 ($ million)
Data Table on UK - Market size and forecast 2025-2030 ($ million)
Chart on UK - Year-over-year growth 2025-2030 (%)
Data Table on UK - Year-over-year growth 2025-2030 (%)

12.4.3 France - Market size and forecast 2025-2030

Chart on France - Market size and forecast 2025-2030 ($ million)
Data Table on France - Market size and forecast 2025-2030 ($ million)
Chart on France - Year-over-year growth 2025-2030 (%)
Data Table on France - Year-over-year growth 2025-2030 (%)

12.4.4 Italy - Market size and forecast 2025-2030

Chart on Italy - Market size and forecast 2025-2030 ($ million)
Data Table on Italy - Market size and forecast 2025-2030 ($ million)
Chart on Italy - Year-over-year growth 2025-2030 (%)
Data Table on Italy - Year-over-year growth 2025-2030 (%)

12.4.5 Spain - Market size and forecast 2025-2030

Chart on Spain - Market size and forecast 2025-2030 ($ million)
Data Table on Spain - Market size and forecast 2025-2030 ($ million)
Chart on Spain - Year-over-year growth 2025-2030 (%)
Data Table on Spain - Year-over-year growth 2025-2030 (%)

12.4.6 The Netherlands - Market size and forecast 2025-2030

Chart on The Netherlands - Market size and forecast 2025-2030 ($ million)
Data Table on The Netherlands - Market size and forecast 2025-2030 ($ million)
Chart on The Netherlands - Year-over-year growth 2025-2030 (%)
Data Table on The Netherlands - Year-over-year growth 2025-2030 (%)

12.5 APAC - Market size and forecast 2025-2030

Chart on APAC - Market size and forecast 2025-2030 ($ million)
Data Table on APAC - Market size and forecast 2025-2030 ($ million)
Chart on APAC - Year-over-year growth 2025-2030 (%)
Data Table on APAC - Year-over-year growth 2025-2030 (%)
Chart on Regional Comparison - APAC
Data Table on Regional Comparison - APAC

12.5.1 India - Market size and forecast 2025-2030

Chart on India - Market size and forecast 2025-2030 ($ million)
Data Table on India - Market size and forecast 2025-2030 ($ million)
Chart on India - Year-over-year growth 2025-2030 (%)
Data Table on India - Year-over-year growth 2025-2030 (%)

12.5.2 China - Market size and forecast 2025-2030

Chart on China - Market size and forecast 2025-2030 ($ million)
Data Table on China - Market size and forecast 2025-2030 ($ million)
Chart on China - Year-over-year growth 2025-2030 (%)
Data Table on China - Year-over-year growth 2025-2030 (%)

12.5.3 Japan - Market size and forecast 2025-2030

Chart on Japan - Market size and forecast 2025-2030 ($ million)
Data Table on Japan - Market size and forecast 2025-2030 ($ million)
Chart on Japan - Year-over-year growth 2025-2030 (%)
Data Table on Japan - Year-over-year growth 2025-2030 (%)

12.5.4 South Korea - Market size and forecast 2025-2030

Chart on South Korea - Market size and forecast 2025-2030 ($ million)
Data Table on South Korea - Market size and forecast 2025-2030 ($ million)
Chart on South Korea - Year-over-year growth 2025-2030 (%)
Data Table on South Korea - Year-over-year growth 2025-2030 (%)

12.5.5 Australia - Market size and forecast 2025-2030

Chart on Australia - Market size and forecast 2025-2030 ($ million)
Data Table on Australia - Market size and forecast 2025-2030 ($ million)
Chart on Australia - Year-over-year growth 2025-2030 (%)
Data Table on Australia - Year-over-year growth 2025-2030 (%)

12.5.6 Indonesia - Market size and forecast 2025-2030

Chart on Indonesia - Market size and forecast 2025-2030 ($ million)
Data Table on Indonesia - Market size and forecast 2025-2030 ($ million)
Chart on Indonesia - Year-over-year growth 2025-2030 (%)
Data Table on Indonesia - Year-over-year growth 2025-2030 (%)

12.6 South America - Market size and forecast 2025-2030

Chart on South America - Market size and forecast 2025-2030 ($ million)
Data Table on South America - Market size and forecast 2025-2030 ($ million)
Chart on South America - Year-over-year growth 2025-2030 (%)
Data Table on South America - Year-over-year growth 2025-2030 (%)
Chart on Regional Comparison - South America
Data Table on Regional Comparison - South America

12.6.1 Brazil - Market size and forecast 2025-2030

Chart on Brazil - Market size and forecast 2025-2030 ($ million)
Data Table on Brazil - Market size and forecast 2025-2030 ($ million)
Chart on Brazil - Year-over-year growth 2025-2030 (%)
Data Table on Brazil - Year-over-year growth 2025-2030 (%)

12.6.2 Argentina - Market size and forecast 2025-2030

Chart on Argentina - Market size and forecast 2025-2030 ($ million)
Data Table on Argentina - Market size and forecast 2025-2030 ($ million)
Chart on Argentina - Year-over-year growth 2025-2030 (%)
Data Table on Argentina - Year-over-year growth 2025-2030 (%)

12.6.3 Chile - Market size and forecast 2025-2030

Chart on Chile - Market size and forecast 2025-2030 ($ million)
Data Table on Chile - Market size and forecast 2025-2030 ($ million)
Chart on Chile - Year-over-year growth 2025-2030 (%)
Data Table on Chile - Year-over-year growth 2025-2030 (%)

12.7 Middle East and Africa - Market size and forecast 2025-2030

Chart on Middle East and Africa - Market size and forecast 2025-2030 ($ million)
Data Table on Middle East and Africa - Market size and forecast 2025-2030 ($ million)
Chart on Middle East and Africa - Year-over-year growth 2025-2030 (%)
Data Table on Middle East and Africa - Year-over-year growth 2025-2030 (%)
Chart on Regional Comparison - Middle East and Africa
Data Table on Regional Comparison - Middle East and Africa

12.7.1 Saudi Arabia - Market size and forecast 2025-2030

Chart on Saudi Arabia - Market size and forecast 2025-2030 ($ million)
Data Table on Saudi Arabia - Market size and forecast 2025-2030 ($ million)
Chart on Saudi Arabia - Year-over-year growth 2025-2030 (%)
Data Table on Saudi Arabia - Year-over-year growth 2025-2030 (%)

12.7.2 UAE - Market size and forecast 2025-2030

Chart on UAE - Market size and forecast 2025-2030 ($ million)
Data Table on UAE - Market size and forecast 2025-2030 ($ million)
Chart on UAE - Year-over-year growth 2025-2030 (%)
Data Table on UAE - Year-over-year growth 2025-2030 (%)

12.7.3 South Africa - Market size and forecast 2025-2030

Chart on South Africa - Market size and forecast 2025-2030 ($ million)
Data Table on South Africa - Market size and forecast 2025-2030 ($ million)
Chart on South Africa - Year-over-year growth 2025-2030 (%)
Data Table on South Africa - Year-over-year growth 2025-2030 (%)

12.7.4 Israel - Market size and forecast 2025-2030

Chart on Israel - Market size and forecast 2025-2030 ($ million)
Data Table on Israel - Market size and forecast 2025-2030 ($ million)
Chart on Israel - Year-over-year growth 2025-2030 (%)
Data Table on Israel - Year-over-year growth 2025-2030 (%)

12.7.5 Turkey - Market size and forecast 2025-2030

Chart on Turkey - Market size and forecast 2025-2030 ($ million)
Data Table on Turkey - Market size and forecast 2025-2030 ($ million)
Chart on Turkey - Year-over-year growth 2025-2030 (%)
Data Table on Turkey - Year-over-year growth 2025-2030 (%)

12.8 Market opportunity by geography

Market opportunity by geography ($ million)
Data Tables on Market opportunity by geography ($ million)

13. Drivers, Challenges, and Opportunity

13.1 Market drivers

Growing demand for high quality and bug free software across BFSI, IT, telecom, and retail sectors
Rapid innovation and agile development support
Rising adoption of cloud computing, AI, and IoT driving demand for specialized testing services

13.2 Market challenges

High initial costs of implementing advanced testing frameworks and automation tools
Long adoption cycles for comprehensive testing solutions
Rapidly evolving software technologies and platforms increasing complexity in testing processes

13.3 Impact of drivers and challenges

Impact of drivers and challenges in 2025 and 2030

13.4 Market opportunities

Rapid adoption of AI enabled and automated testing solutions for efficiency and accuracy
Use of cloud based and remote testing platforms to support geographically distributed teams
Increasing focus on performance, security, and continuous integration testing in DevOps environments

14. Competitive Landscape

14.1 Overview

14.2

Overview on criticality of inputs and factors of differentiation

14.3 Landscape disruption

Overview on factors of disruption

14.4 Industry risks

Impact of key risks on business

15. Competitive Analysis

15.1 Companies profiled

Companies covered

15.2 Company ranking index

15.3 Market positioning of companies

Matrix on companies position and classification

15.4 Applause App Quality Inc.

Applause App Quality Inc. - Overview
Applause App Quality Inc. - Product / Service
Applause App Quality Inc. - Key offerings
SWOT

15.5 Cigniti Technologies Ltd.

Cigniti Technologies Ltd. - Overview
Cigniti Technologies Ltd. - Product / Service
Cigniti Technologies Ltd. - Key offerings
SWOT

15.6 Global App Testing

Global App Testing - Overview
Global App Testing - Product / Service
Global App Testing - Key offerings
SWOT

15.7 Indium Software India Ltd.

Indium Software India Ltd. - Overview
Indium Software India Ltd. - Product / Service
Indium Software India Ltd. - Key offerings
SWOT

15.8 Kualitatem Inc.

Kualitatem Inc. - Overview
Kualitatem Inc. - Product / Service
Kualitatem Inc. - Key offerings
SWOT

15.9 QA Mentor Inc.

QA Mentor Inc. - Overview
QA Mentor Inc. - Product / Service
QA Mentor Inc. - Key offerings
SWOT

15.10 QA TestLab Solutions Ltd.

QA TestLab Solutions Ltd. - Overview
QA TestLab Solutions Ltd. - Product / Service
QA TestLab Solutions Ltd. - Key offerings
SWOT

15.11 QASource

QASource - Overview
QASource - Product / Service
QASource - Key offerings
SWOT

15.12 QualiTest Group

QualiTest Group - Overview
QualiTest Group - Product / Service
QualiTest Group - Key offerings
SWOT

15.13 QualityLogic Inc.

QualityLogic Inc. - Overview
QualityLogic Inc. - Product / Service
QualityLogic Inc. - Key offerings
SWOT

15.14 ScienceSoft USA Corp.

ScienceSoft USA Corp. - Overview
ScienceSoft USA Corp. - Product / Service
ScienceSoft USA Corp. - Key offerings
SWOT

15.15 Test Yantra Software

Test Yantra Software - Overview
Test Yantra Software - Product / Service
Test Yantra Software - Key offerings
SWOT

15.16 Testfort

Testfort - Overview
Testfort - Product / Service
Testfort - Key offerings
SWOT

15.17 TestingXperts

TestingXperts - Overview
TestingXperts - Product / Service
TestingXperts - Key offerings
SWOT

15.18 Testlio Inc.

Testlio Inc. - Overview
Testlio Inc. - Product / Service
Testlio Inc. - Key offerings
SWOT

16. Appendix

16.1 Scope of the report

Market definition
Objectives
Notes and caveats

16.2 Inclusions and exclusions checklist

Inclusions checklist
Exclusions checklist

16.3 Currency conversion rates for US$

16.4 Research methodology

16.5 Data procurement

Information sources

16.6 Data validation

16.7 Validation techniques employed for market sizing

16.8 Data synthesis

16.9 360 degree market analysis

16.10 List of abbreviations

Research Methodology

Technavio presents a detailed picture of the market by way of study, synthesis, and summation of data from multiple sources. The analysts have presented the various facets of the market with a particular focus on identifying the key industry influencers. The data thus presented is comprehensive, reliable, and the result of extensive research, both primary and secondary.

INFORMATION SOURCES

Primary sources

  • Manufacturers and suppliers
  • Channel partners
  • Industry experts
  • Strategic decision makers

Secondary sources

  • Industry journals and periodicals
  • Government data
  • Financial reports of key industry players
  • Historical data
  • Press releases

DATA ANALYSIS

Data Synthesis

  • Collation of data
  • Estimation of key figures
  • Analysis of derived insights

Data Validation

  • Triangulation with data models
  • Reference against proprietary databases
  • Corroboration with industry experts

REPORT WRITING

Qualitative

  • Market drivers
  • Market challenges
  • Market trends
  • Five forces analysis

Quantitative

  • Market size and forecast
  • Market segmentation
  • Geographical insights
  • Competitive landscape

Interested in this report?

Get your sample now to see our research methodology and insights!

Download Now

Frequently Asked Questions

Pure Play Software Testing Services market growth will increase by USD 20474.3 million during 2026-2030.

The Pure Play Software Testing Services market is expected to grow at a CAGR of 16.8% during 2026-2030.

Pure Play Software Testing Services market is segmented by End-user (BFSI, IT, Telecom, Retail, Others) Deployment (On premises, Cloud based) Product type (Compatibility, Usability, Application, Security performance, Others)

a1qa software testing co., Applause App Quality Inc., AppSierra, Cigniti Technologies Ltd., DeviQA Solutions, Global App Testing, Indium Software India Ltd., Kualitatem Inc., Planit Test Management Solutions, QA Mentor Inc., QA TestLab Solutions Ltd., QASource, QualiTest Group, QualityLogic Inc., ScienceSoft USA Corp., Test Yantra Software, Testfort, TestingXperts, Testlio Inc., Testrig Technologies are a few of the key vendors in the Pure Play Software Testing Services market.

North America will register the highest growth rate of 42.7% among the other regions. Therefore, the Pure Play Software Testing Services market in North America is expected to garner significant business opportunities for the vendors during the forecast period.

US, Canada, Mexico, Germany, UK, France, Italy, Spain, The Netherlands, India, China, Japan, South Korea, Australia, Indonesia, Brazil, Argentina, Chile, Saudi Arabia, UAE, South Africa, Israel, Turkey

  • Growing demand for high quality and bug free software across BFSI, IT, telecom, and retail sectors is the driving factor this market.

The Pure Play Software Testing Services market vendors should focus on grabbing business opportunities from the End-user segment as it accounted for the largest market share in the base year.
RIA - Research AI Assistant
Ask RIA