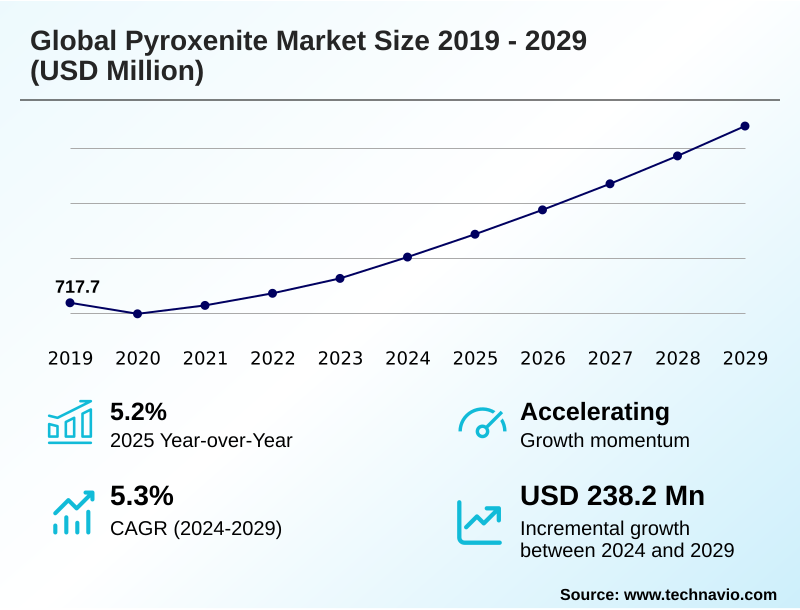
Pyroxenite Market Size 2025-2029
The pyroxenite market size is valued to increase by USD 238.2 million, at a CAGR of 5.3% from 2024 to 2029. Surging demand for platinum group metals in green technologies will drive the pyroxenite market.
Major Market Trends & Insights
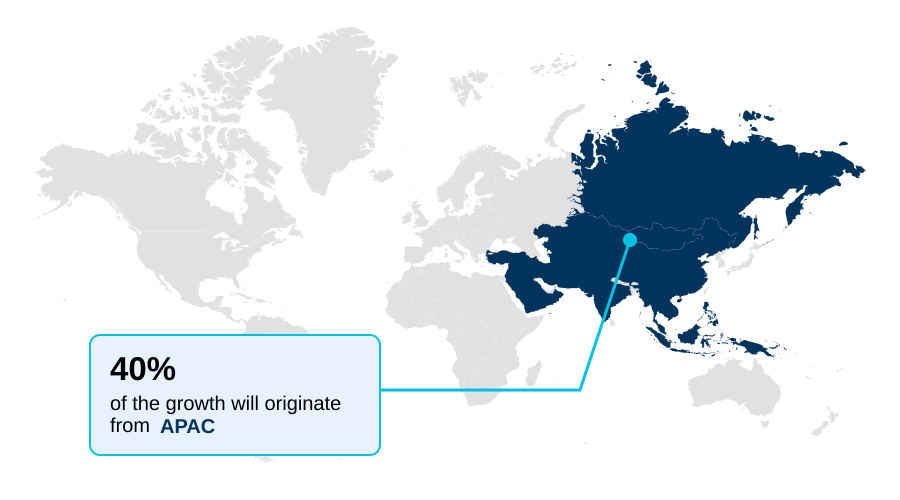
- APAC dominated the market and accounted for a 39.9% growth during the forecast period.
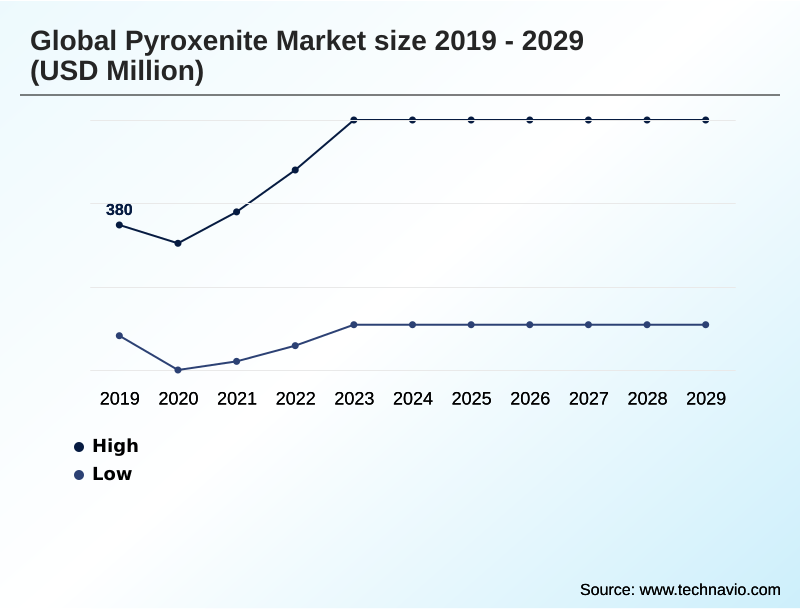
- By Type - High segment was valued at USD 420.1 million in 2023
- By Application - Iron and steel making segment accounted for the largest market revenue share in 2023
Market Size & Forecast
- Market Opportunities: USD 321.3 million
- Market Future Opportunities: USD 238.2 million
- CAGR from 2024 to 2029 : 5.3%
Market Summary
- The pyroxenite market is characterized by its dual role as both a high-volume industrial mineral and a crucial ore source for strategic metals. Demand is fundamentally linked to global industrialization, infrastructure development, and the transition toward a low-carbon economy. As a construction aggregate, its durability is sought for major projects, while in metallurgy, it serves as a vital slag conditioner.
- However, its most significant value is often derived from the critical minerals it hosts, including platinum group metals (PGMs), chromium, and nickel. A mining firm, for instance, might leverage advanced geological modeling to assess the viability of a layered mafic intrusion.
- This involves balancing the high capital expenditure of underground mining against the potential returns from high-grade, pgm-rich pyroxenite reefs, a calculation that underscores the market's complex economic drivers.
- The industry's trajectory is also shaped by a growing focus on sustainability, with emerging applications in carbon mineralization presenting new opportunities for waste rock valorization and environmental remediation, fundamentally altering the long-term value proposition of pyroxenite deposits.
What will be the Size of the Pyroxenite Market during the forecast period?
Get Key Insights on Market Forecast (PDF) Get Free Sample
How is the Pyroxenite Market Segmented?
The pyroxenite industry research report provides comprehensive data (region-wise segment analysis), with forecasts and estimates in "USD million" for the period 2025-2029, as well as historical data from 2019-2023 for the following segments.
- Type
- High
- Low
- Application
- Iron and steel making
- Building materials
- Dimension stone
- Others
- End-user
- Metallurgy
- Construction
- Architecture
- Others
- Geography
- APAC
- China
- Japan
- India
- North America
- US
- Canada
- Mexico
- Europe
- Germany
- UK
- France
- South America
- Brazil
- Argentina
- Colombia
- Middle East and Africa
- South Africa
- Saudi Arabia
- UAE
- Rest of World (ROW)
- APAC
By Type Insights
The high segment is estimated to witness significant growth during the forecast period.
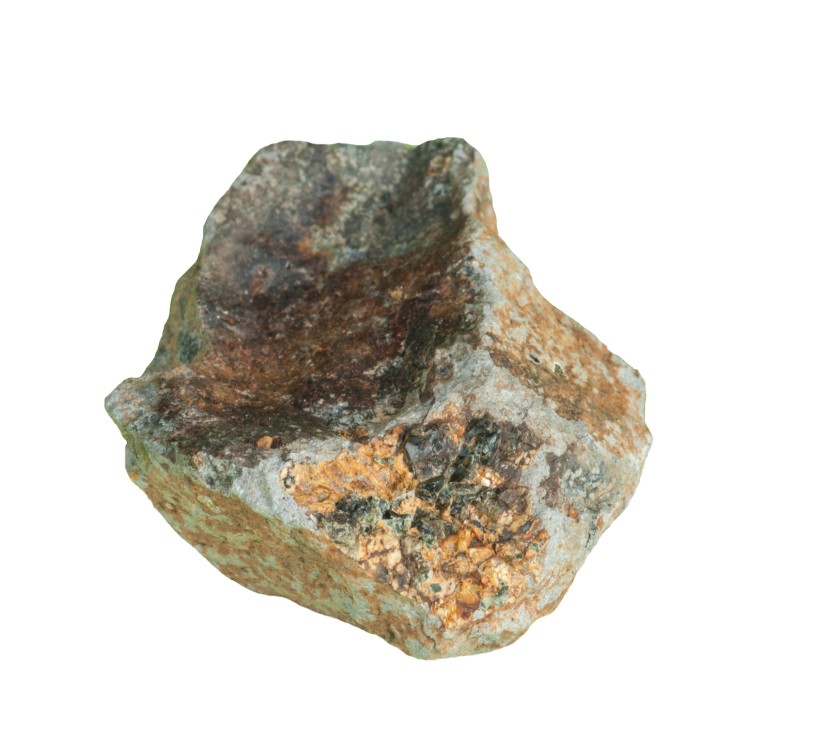
The high-grade segment is defined by pyroxenite with exceptional concentrations of valuable metals or superior aesthetic qualities. This includes ores containing economically significant platinum group metals, chromium, or nickel, often found in PGM-rich pyroxenite reefs.
Mining operations selectively target these ore bodies to maximize profitability. In architectural applications, high-grade refers to pyroxenite extracted in large, unfractured blocks for use as dimension stone, where value is derived from visual appeal.
This value-added approach positions the material as a strategic resource. Advanced geological modeling is crucial for identifying these deposits, with some operations improving metal recovery rates by over 5% through precise ore body delineation.
This segment represents a primary focus for major mining corporations implementing critical mineral strategies, targeting high-performance materials beyond their use as metallurgical flux or in high-strength concrete.
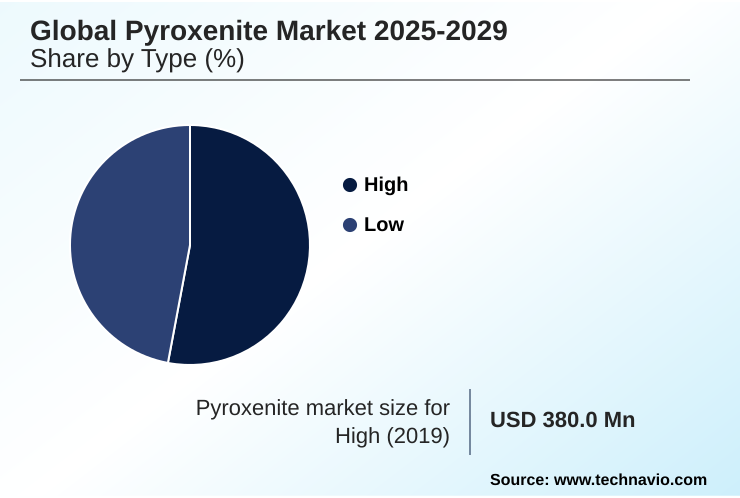
The High segment was valued at USD 420.1 million in 2023 and showed a gradual increase during the forecast period.
Regional Analysis
APAC is estimated to contribute 39.9% to the growth of the global market during the forecast period.Technavio’s analysts have elaborately explained the regional trends and drivers that shape the market during the forecast period.
See How Pyroxenite Market Demand is Rising in APAC Get Free Sample
The geographic landscape is dominated by Southern Africa, where layered mafic intrusions like the Bushveld Complex hold over 80% of the world's PGM resources, making the region a critical node for global supply.
This concentration creates significant supply chain vulnerabilities, prompting other regions to enact critical mineral strategies.
North America, for instance, focuses on securing domestic supply from its own mafic-ultramafic intrusions via underground mining, while APAC serves as the primary demand hub, accounting for over 35% of global consumption.
Advanced exploration technologies are enabling the assessment of ultramafic igneous rock in new frontiers like South America. This diversification is key for industries reliant on these critical minerals for applications ranging from electronics to soil amendment.
Market Dynamics
Our researchers analyzed the data with 2024 as the base year, along with the key drivers, trends, and challenges. A holistic analysis of drivers will help companies refine their marketing strategies to gain a competitive advantage.
- The versatility of pyroxenite is demonstrated across numerous specialized applications. Its role as a fluxing agent in steelmaking is critical for improving furnace efficiency, a process directly related to slag conditioning with pyroxenite in furnaces.
- The economic impetus for its extraction is often driven by PGM extraction from pyroxenite ore bodies, a practice central to evaluating pyroxenite for critical mineral potential and assessing pyroxenite for pgm content. This is especially true when exploring pyroxenite in layered mafic intrusions, where chromite extraction from pyroxenitic layers also occurs.
- In construction, pyroxenite application in high-strength concrete and its use as pyroxenite aggregates for durable road construction are standard. For more demanding projects, pyroxenite for high-speed railway ballast is specified.
- This contrasts with its use for coastal defense armorstone, where logistical challenges of transporting pyroxenite aggregates can be a major cost factor, sometimes exceeding the material cost by a 2:1 ratio. Emerging uses include its role in the green hydrogen economy and the growing interest in pyroxenite as a soil remineralization agent.
- Further innovation is seen in carbon mineralization using pyroxenite tailings and enhanced weathering with finely ground pyroxenite. Even niche segments, such as pyroxenite use as architectural dimension stone and its application in refractory brick manufacturing, contribute to its diverse market profile. Managing the environmental impact of pyroxenite mining remains a key consideration across all these uses.
What are the key market drivers leading to the rise in the adoption of Pyroxenite Industry?
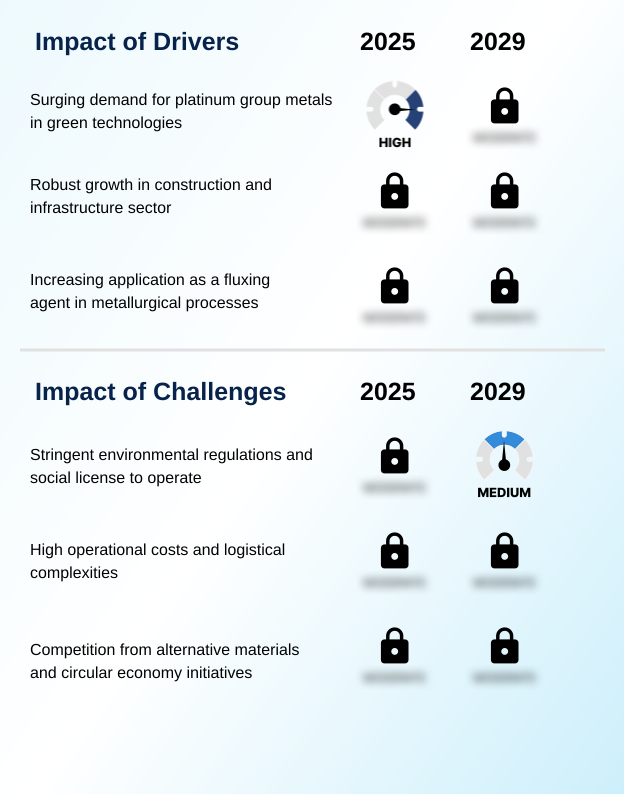
- The surging demand for platinum group metals in green technologies is a key driver propelling market growth.
- Demand for pyroxenite is increasingly driven by its role in green technologies and the global push for decarbonization.
- As a primary source for platinum, it is essential for the hydrogen economy, with projections indicating a fivefold increase in demand for its use in PEM electrolyzers and PEM fuel cells for green hydrogen production.
- This demand complements its established use in emissions control systems for vehicles, which require palladium and rhodium. Concurrently, massive infrastructure spending fuels its application as a durable construction aggregate and railway ballast.
- The use of such sustainable aggregates can extend infrastructure lifecycles by over 40%, directly addressing supply chain vulnerabilities in construction materials and reinforcing its strategic importance.
What are the market trends shaping the Pyroxenite Industry?
- The market is witnessing an intensified focus on pyroxenite as a primary source for critical minerals and platinum group metals, marking a significant upcoming trend.
- An emerging trend is the repositioning of pyroxenite as a tool for environmental remediation through carbon mineralization, leveraging the geochemical reactivity of pyroxene group minerals. Pilot projects in sustainable mining demonstrate that this coarse-grained rock can sequester up to 25 kilograms of CO2 per ton via enhanced rock weathering.
- This aligns with a broader shift toward carbon-negative mines and other climate solutions. This innovation is creating new value streams, with some ex-situ mineralization techniques improving carbon capture efficiency by 30% compared to passive methods.
- Beyond this, pyroxenite is gaining traction in niche applications as a functional filler in composites and as a base for high-performance refractory materials, moving beyond its traditional roles.
What challenges does the Pyroxenite Industry face during its growth?
- Stringent environmental regulations and the need to maintain a social license to operate represent a key challenge affecting industry growth.
- Key challenges include navigating stringent environmental regulations and securing a social license to operate for mineral extraction and quarrying operations. Permitting delays have increased by 50% in some jurisdictions, complicating project timelines for extracting minerals like diopside and enstatite.
- Furthermore, competition from circular economy initiatives is intensifying, with secondary supply from recycling now meeting over 30% of annual demand for certain metals. This push for a closed-loop supply chain challenges primary extraction models. The market also faces pressure from substitute materials in applications like slag engineering, where alternatives can be used as a slag conditioner.
- These dynamics necessitate a focus on waste rock valorization and advanced exploration technologies to maintain competitiveness.
Exclusive Technavio Analysis on Customer Landscape
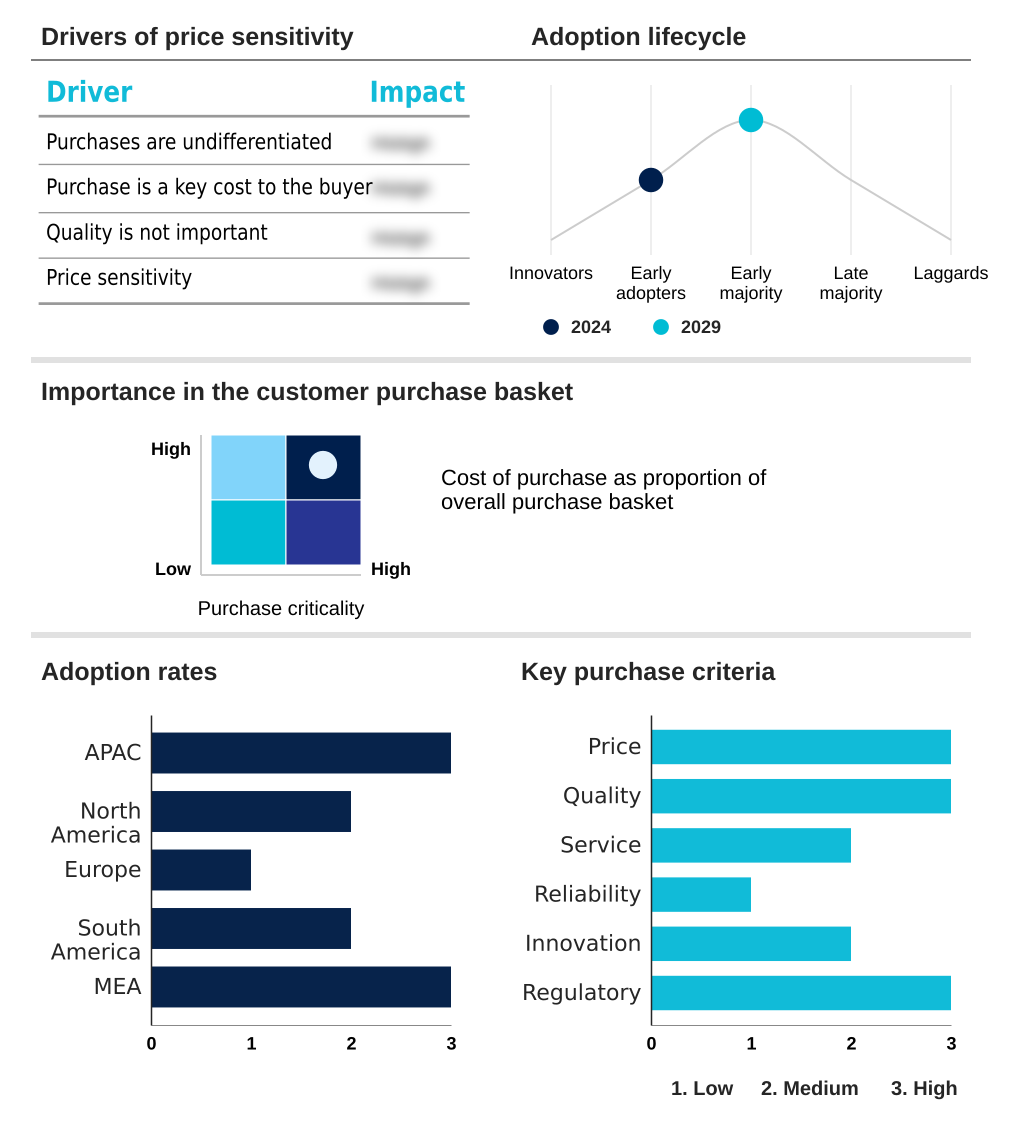
The pyroxenite market forecasting report includes the adoption lifecycle of the market, covering from the innovator’s stage to the laggard’s stage. It focuses on adoption rates in different regions based on penetration. Furthermore, the pyroxenite market report also includes key purchase criteria and drivers of price sensitivity to help companies evaluate and develop their market growth analysis strategies.
Customer Landscape of Pyroxenite Industry
Competitive Landscape
Companies are implementing various strategies, such as strategic alliances, pyroxenite market forecast, partnerships, mergers and acquisitions, geographical expansion, and product/service launches, to enhance their presence in the industry.
Anglo American plc - Delivers pyroxenite from its mineral extraction and processing operations, targeting key industrial and metallurgical sectors.
The industry research and growth report includes detailed analyses of the competitive landscape of the market and information about key companies, including:
- Anglo American plc
- Bharat Mining Company
- Bushveld Minerals
- Foskor Ltd
- Glencore Plc
- Imerys S.A.
- Martin Marietta Materials Inc.
- Mineracao Candonga
- Omya International AG
- PJSC MMC Norilsk Nickel
- Rio Tinto Ltd.
- SCR Sibelco NV
- Tata Steel Ltd.
- TVI Pacific Inc.
- Vulcan Materials Co.
Qualitative and quantitative analysis of companies has been conducted to help clients understand the wider business environment as well as the strengths and weaknesses of key industry players. Data is qualitatively analyzed to categorize companies as pure play, category-focused, industry-focused, and diversified; it is quantitatively analyzed to categorize companies as dominant, leading, strong, tentative, and weak.
Recent Development and News in Pyroxenite market
- In August, 2024, Verde Minerals announced it secured a multi-year contract to supply high-strength pyroxenite aggregates for the construction of a major high-speed rail network, highlighting the material's importance in critical infrastructure projects.
- In November, 2024, GeoCatalyst Innovations launched a pilot project focused on carbon mineralization using pyroxenite tailings from its mining operations, aiming to create a verifiable carbon credit stream and advance its ESG goals.
- In January, 2025, Platinum Strategies Corp. received a significant government grant to advance its research into more efficient platinum extraction from low-grade pyroxenite ores, directly supporting the domestic hydrogen economy supply chain.
- In April, 2025, Global Mining Ventures completed the acquisition of Andean Explorers Inc., a junior mining firm with promising PGM exploration assets in South America, signaling ongoing consolidation and a strategic push to diversify supply chains.
Dive into Technavio’s robust research methodology, blending expert interviews, extensive data synthesis, and validated models for unparalleled Pyroxenite Market insights. See full methodology.
| Market Scope | |
|---|---|
| Page number | 302 |
| Base year | 2024 |
| Historic period | 2019-2023 |
| Forecast period | 2025-2029 |
| Growth momentum & CAGR | Accelerate at a CAGR of 5.3% |
| Market growth 2025-2029 | USD 238.2 million |
| Market structure | Fragmented |
| YoY growth 2024-2025(%) | 5.2% |
| Key countries | China, Japan, India, South Korea, Australia, Indonesia, US, Canada, Mexico, Germany, UK, France, Spain, Italy, The Netherlands, Brazil, Argentina, Colombia, South Africa, Saudi Arabia, UAE, Turkey and Israel |
| Competitive landscape | Leading Companies, Market Positioning of Companies, Competitive Strategies, and Industry Risks |
Research Analyst Overview
- The pyroxenite market is defined by its strategic importance as an ultramafic igneous rock hosting a suite of critical minerals. Composed of pyroxene group minerals such as augite, diopside, and enstatite, this coarse-grained rock is central to multiple value chains.
- Its role as a metallurgical flux and slag conditioner is vital for improving furnace lining durability through precise slag engineering, leveraging its high magnesium oxide content. Beyond metallurgy, it is a key construction aggregate for high-strength concrete and railway ballast.
- Certain layered mafic intrusions and mafic-ultramafic intrusions are prime targets for mineral extraction, as they are ore bodies for platinum group metals like platinum, palladium, and rhodium. The rise of green technologies has amplified its significance, with PGMs being essential for PEM electrolyzers and PEM fuel cells.
- This has spurred exploration of PGM-rich pyroxenite reefs, with firms using advanced modeling to improve resource identification accuracy by over 20%. This shift forces board-level decisions on asset valuation, moving beyond simple extraction to consider pyroxenite's potential in applications like soil amendment and as a functional filler or rock armor, turning a traditional industrial mineral into a multifaceted strategic asset.
What are the Key Data Covered in this Pyroxenite Market Research and Growth Report?
-
What is the expected growth of the Pyroxenite Market between 2025 and 2029?
-
USD 238.2 million, at a CAGR of 5.3%
-
-
What segmentation does the market report cover?
-
The report is segmented by Type (High, and Low), Application (Iron and steel making, Building materials, Dimension stone, and Others), End-user (Metallurgy, Construction, Architecture, and Others) and Geography (APAC, North America, Europe, South America, Middle East and Africa)
-
-
Which regions are analyzed in the report?
-
APAC, North America, Europe, South America and Middle East and Africa
-
-
What are the key growth drivers and market challenges?
-
Surging demand for platinum group metals in green technologies, Stringent environmental regulations and social license to operate
-
-
Who are the major players in the Pyroxenite Market?
-
Anglo American plc, Bharat Mining Company, Bushveld Minerals, Foskor Ltd, Glencore Plc, Imerys S.A., Martin Marietta Materials Inc., Mineracao Candonga, Omya International AG, PJSC MMC Norilsk Nickel, Rio Tinto Ltd., SCR Sibelco NV, Tata Steel Ltd., TVI Pacific Inc. and Vulcan Materials Co.
-
Market Research Insights
- Market dynamics are shaped by the convergence of industrial demand and sustainability imperatives. The strategic shift toward a hydrogen economy and green hydrogen production elevates pyroxenite’s value as a source for critical catalysts, complementing its role in traditional emissions control systems. This is creating new revenue opportunities beyond its use as a standard industrial mineral.
- For instance, enhanced rock weathering techniques using pyroxenite can improve soil nutrient availability by up to 15%, creating value in the agricultural sector. Furthermore, in metallurgical applications, optimized slag conditioning with pyroxenite-derived fluxes can reduce furnace energy consumption by as much as 10%. These efficiencies are crucial as operators navigate supply chain vulnerabilities and increasing competition from circular economy initiatives.
- The ability to pivot between bulk material supply and high-value environmental and technological applications defines the market's resilience.
We can help! Our analysts can customize this pyroxenite market research report to meet your requirements.
 RIA -
RIA - 
