Railway Network Cables Market Size 2025-2029
The railway network cables market size is forecast to increase by USD 3.06 billion at a CAGR of 5.8% between 2024 and 2029.
- The market is experiencing significant growth, driven by the increasing popularity of smart railways and the emergence of high-speed rail networks. These advancements are leading to an increased demand for efficient and reliable cable solutions to support the integration of advanced technologies such as communication systems, signaling, and power supply. The tourism sector is also driving market growth as high-speed rail networks offer a more convenient and eco-friendly alternative to road transport and air travel. However, the market faces challenges due to the volatile prices of raw materials, which can impact the cost structure of cable manufacturing and, in turn, the overall cost competitiveness of rail projects.
- To capitalize on market opportunities and navigate these challenges effectively, companies must focus on optimizing their supply chain and raw material sourcing strategies, as well as investing in research and development to innovate and differentiate their offerings. By staying agile and responsive to market trends and challenges, players in the market can position themselves for long-term success. The market will experience significant growth in the coming years due to the increasing demand for efficient and reliable transportation systems.
What will be the Size of the Railway Network Cables Market during the forecast period?

Explore in-depth regional segment analysis with market size data - historical 2019-2023 and forecasts 2025-2029 - in the full report.
Request Free Sample
- The market encompasses various applications, including power distribution for renewable energy sources such as wind and solar power, as well as traditional power substations. Energy storage systems, like battery energy storage, play a crucial role in ensuring power quality and stability. However, challenges persist, such as cable repair due to voltage sags, cable tension, and cable vandalism. Cable inspection and testing instruments are essential for identifying issues, including cable de-rating, insulation resistance, and cable fault location. Copper and aluminum conductors are commonly used, but cable aging, cable flooding, and cable fire are ongoing concerns. Cable certification, cable tensioning lubricants, and cable pulling software are key solutions.
- Overhead line structures, including third rail supports, require cable routing and cable bundling to minimize voltage fluctuations and increases. Cable replacement is necessary when cable sag and cable theft occur. Dielectric strength, power converters, and cable simulation software are additional considerations for maintaining optimal power distribution and power quality. Cable trenching and cable theft pose security risks, while cable theft and cable vandalism can disrupt operations. Hydro power and cable theft also impact the market, as hydro power plants rely on cable infrastructure for transmission. Many countries are investing heavily in automated rail systems, including metros and tube trains, to cater to the growing demand for public transportation.
How is this Railway Network Cables Industry segmented?
The railway network cables industry research report provides comprehensive data (region-wise segment analysis), with forecasts and estimates in "USD million" for the period 2025-2029, as well as historical data from 2019-2023 for the following segments.
- Application
- Power cables
- Signal and communication cables
- Installation Sites
- Overhead
- Underground
- Material
- Copper
- Aluminum
- Fiber optic
- Geography
- North America
- US
- Canada
- Europe
- France
- Germany
- Italy
- UK
- APAC
- China
- India
- Japan
- South Korea
- Rest of World (ROW)
- North America
By Application Insights
The power cables segment is estimated to witness significant growth during the forecast period. Power cables play a crucial role in railway systems by transmitting power to various components for optimal functionality and safety. The power supply is essential for railway signaling, including electromechanical interlocking, panel interlocking, route relay interlocking, electronic interlocking, automatic signaling, and centralized traffic control. These systems necessitate different power supply configurations. Power cables are also integral to railway electrification, which includes insulated conductors, cable glands, circuit breakers, increase arresters, and cable termination. Lightning protection, fire resistance, and short circuit protection are critical safety features for these cables. Railway traction systems, such as third rail systems, electric multiple units, and high-speed trains, require high current carrying capacity and thermal rating cables.
Communication systems, cable maintenance, and cable testing are essential for maintaining the railway network's efficiency and reliability. Underground and overhead contact lines, cable trays, cable installation, and cable fault detection are crucial components of the railway cable infrastructure. Environmental impact, safety standards, and energy efficiency are essential considerations for the design and implementation of these systems. High voltage cables, extrusion process, and cable accessories are vital for ensuring the railway network's power requirements. Capacitive and inductive reactance, noise reduction, and corrosion resistance are essential cable properties for effective power transmission. Global positioning systems, traffic management, and train control systems are increasingly integrated into railway networks, requiring advanced cable technologies and infrastructure.
IEEE and IEC standards provide guidelines for cable specifications and installation, ensuring interoperability and safety. In summary, power cables are a critical component of railway systems, enabling the efficient and safe transmission of power to various railway components and systems. The railway cable market is evolving to meet the demands of advanced railway technologies and increasing safety and efficiency requirements.
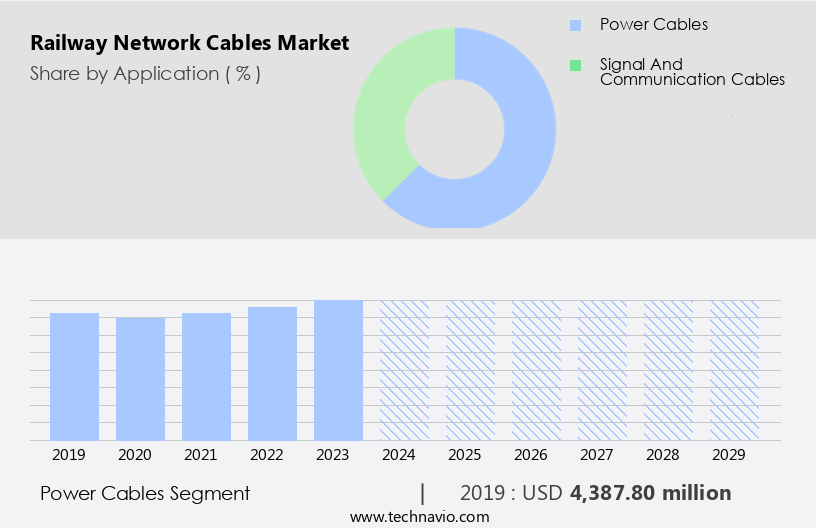
The Power cables segment was valued at USD 4.39 billion in 2019 and showed a gradual increase during the forecast period.
Regional Analysis
APAC is estimated to contribute 47% to the growth of the global market during the forecast period. Technavio’s analysts have elaborately explained the regional trends and drivers that shape the market during the forecast period.

In the evolving global transport landscape, the railway sector is experiencing significant investments, particularly in the Asia-Pacific (APAC) region. With the economic shift towards the East and the expanding Asian economy, railway infrastructure development is gaining momentum. By 2025, trillions of dollars are projected to be invested in this sector in countries like China and India, which rank among the world's leaders in railway network span. The vast geography of these nations necessitates efficient transport solutions, as many areas lack adequate road infrastructure. Railway signaling systems, increase arresters, cable splices, and lightning protection are essential components of railway electrification.
Insulated conductors, cable glands, circuit breakers, and train control systems ensure the safe and efficient operation of trains. Cable duct banks, cable trays, and cable installation are crucial for managing the vast cable networks required for railway electrification. Current carrying capacity, thermal rating, ground fault protection, cable termination, and short circuit protection are critical considerations for high voltage cables used in railway applications. Communication systems, cable testing, and cable fault detection are essential for maintaining the integrity of the cable networks. Fire resistance, protective relays, and cable maintenance are crucial safety features for railway cable systems. Corrosion resistance, traffic management, and energy efficiency are essential considerations for the long-term sustainability of railway infrastructure.
Market Dynamics
Our researchers analyzed the data with 2024 as the base year, along with the key drivers, trends, and challenges. A holistic analysis of drivers will help companies refine their marketing strategies to gain a competitive advantage.
What are the Railway Network Cables market drivers leading to the rise in the adoption of Industry?
- The increasing adoption of smart railways is the primary factor fueling market growth in this sector. Rail transport is experiencing significant growth in both advanced and emerging economies due to increasing air traffic and road transport congestion. Rail infrastructure provides a safer, cleaner, and more competitive alternative to road and air transport, despite challenges such as high initial investment and maintenance costs. Smart railway infrastructure is driving the next phase of growth in the rail transport industry. This technology transforms basic rail networks into complex systems, enhancing passenger comfort. Inductive reactance, a key concept in electrical engineering, plays a crucial role in the efficient operation of third rail systems and electric multiple units.
- Cross-linked polyethylene insulation ensures fire resistance and cable durability. Automatic train protection and protective relays ensure safety, while cable maintenance and cable trays facilitate efficient cable management. Voltage drop and IEEE standards are essential considerations in the design and implementation of overhead contact lines. Environmental impact is a critical factor in the development of sustainable railway networks. Smart railway transport solutions include regenerative braking, which reduces energy consumption and environmental impact. Smart railway infrastructure is a catalyst for growth, offering innovative solutions to address the challenges of initial investment and maintenance costs. The integration of advanced technologies, such as inductive reactance and cross-linked polyethylene insulation, ensures the reliability and longevity of railway networks.
What are the Railway Network Cables market trends shaping the Industry?
- The emergence of high-speed rail networks represents a significant market trend in transportation. This innovative mode of travel offers increased efficiency and reduced travel times compared to traditional rail and roadways. The market has experienced significant growth due to the increasing passenger and freight traffic, particularly in Asia-Pacific and European regions. China, with an annual market volume exceeding USD13 billion, is a major player in the high-speed railway sector, driving market expansion. Europe also presents a promising opportunity, as there is a growing demand to connect various countries such as Poland, Spain, Italy, Germany, the Netherlands, and the UK. High-speed railways require advanced cable technologies for short circuit protection, power factor correction, track maintenance, cable testing, cable fault detection, cable jointing, and communication systems. These cables include high voltage cables and various cable accessories.
- Cable pulling equipment and overload protection are essential for cable installation and ensuring the longevity of the cables. Moreover, the implementation of radio frequency identification (RFID) technology in track circuits enhances safety and efficiency. Communication systems and cable installation techniques have evolved to accommodate the increasing demand for reliable, high-performance railway network cables. The focus on improving cable lifespan and reducing maintenance costs has led to advancements in cable technology and installation methods.
How does Railway Network Cables market face challenges during its growth?
- The volatile pricing of raw materials poses a significant challenge to the industry's growth trajectory. In the market, aluminum and copper are the primary raw materials used for cable production, accounting for approximately 85% of the total production cost. The high melting point and ruggedness of these materials make them ideal for extreme conditions in the rail industry. However, the prices of these metals are subject to volatility due to various factors such as inflation, availability, and production costs. The instability in the cost of raw materials, including fuel and energy, significantly impacts the revenue of cable manufacturers. To mitigate this, companies adjust their final product prices to recover the cost fluctuations. Safety standards are a critical consideration in the production of railway network cables.
- Compliance with international standards, such as IEC, is essential to ensure the safety and reliability of electric locomotives, high-speed trains, and rolling stock. The extrusion process is commonly used to manufacture these cables, ensuring uniformity and consistency in the final product. Noise reduction and corrosion resistance are essential features for railway network cables, particularly for underground applications. Capacitive reactance and traffic management systems help optimize energy efficiency and ensure smooth operation of the railway network. Global Positioning Systems (GPS) are increasingly being integrated into railway networks to enhance safety and improve operational efficiency. The market is driven by the growing demand for energy-efficient and safe railway systems.
Exclusive Customer Landscape
The railway network cables market forecasting report includes the adoption lifecycle of the market, covering from the innovator’s stage to the laggard’s stage. It focuses on adoption rates in different regions based on penetration. Furthermore, the railway network cables market report also includes key purchase criteria and drivers of price sensitivity to help companies evaluate and develop their market growth analysis strategies.

Customer Landscape
Key Companies & Market Insights
Companies are implementing various strategies, such as strategic alliances, railway network cables market forecast, partnerships, mergers and acquisitions, geographical expansion, and product/service launches, to enhance their presence in the industry.
Aberdare Cables - The company specializes in providing a diverse range of railway network cables.
The industry research and growth report includes detailed analyses of the competitive landscape of the market and information about key companies, including:
- Aberdare Cables
- Alma Srl
- Amphenol TPC
- Baosheng Science and Technology Innovation Co. Ltd.
- Bhuwal Insulation Cable Pvt. Ltd.
- Caledonian Cables Ltd.
- Eaton Corp. plc
- Eland Cables
- Hengtong Group Co. Ltd.
- Hitachi Ltd.
- HUBER SUHNER AG
- Lapp Holding SE
- Leoni AG
- Nexans SA
- Prysmian SpA
- SAB Brockskes GmbH and Co. KG
- Schwechater Kabelwerke GmbH
- Siechem Technologies Pvt. Ltd.
- TE Connectivity Ltd.
- Tecnikabel SpA
Qualitative and quantitative analysis of companies has been conducted to help clients understand the wider business environment as well as the strengths and weaknesses of key industry players. Data is qualitatively analyzed to categorize companies as pure play, category-focused, industry-focused, and diversified; it is quantitatively analyzed to categorize companies as dominant, leading, strong, tentative, and weak.
Recent Development and News in Railway Network Cables Market
- In February 2023, ABB, a leading technology provider, announced the launch of its new railway cable portfolio, which includes high-performance cables for signaling, traction power, and telecommunications applications. These cables are designed to enhance railway system reliability and efficiency, with improved fire safety and durability features (ABB Press Release).
- In May 2024, Siemens and Nokia entered into a strategic partnership to jointly develop and deliver integrated communication solutions for railway networks. This collaboration combines Siemens' rail expertise with Nokia's advanced networking technologies, aiming to improve railway connectivity and passenger experience (Siemens Press Release).
- In August 2024, Prysmian Group, a global leader in energy and telecom cable systems, secured a significant contract from the Indian Railways to supply over 3,000 kilometers of high-voltage direct current (HVDC) cables for the Western Dedicated Freight Corridor project. This deal marks a major expansion for Prysmian in the Indian railway market (Prysmian Group Press Release).
Research Analyst Overview
The market is characterized by its continuous evolution and dynamic nature, with ongoing advancements in technology and applications across various sectors. Rail tracks rely on a complex network of cables for signaling, power transmission, and communication systems. These cables are subjected to rigorous demands, necessitating the use of high-performance materials and advanced technologies. Short circuit protection, power factor correction, and track maintenance are essential aspects of railway cable systems. Cable testing and fault detection are crucial for ensuring the reliability and safety of these networks. Cable jointing and installation techniques have evolved to accommodate the increasing demand for longer cable lengths and higher current carrying capacity.
Communication systems, including radio frequency identification and tracking technologies, play a vital role in enhancing railway efficiency and safety. Cable pulling equipment and cable duct banks facilitate the installation and maintenance of these extensive cable networks. High voltage cables, insulated conductors, and circuit breakers are integral components of railway electrification systems. Lightning protection systems safeguard against power increases and electrical disturbances. Cable glands and termination techniques ensure proper cable connection and sealing, while cable trays and cable accessories facilitate cable organization and protection. The ongoing development of safety standards, such as IEEE and IEC, continues to drive innovation in railway cable technologies.
The railway network cables market plays a critical role in modern rail infrastructure, ensuring efficiency and safety. Fiber optic cables enhance connectivity, supporting communication across freight trains and passenger trains. Protective cable sheaths safeguard wiring from environmental stress, while cable pulling lubricants facilitate seamless installation. Advanced cable testing instruments ensure reliability, mitigating risks from voltage increases. A robust third rail system delivers consistent power for train traction, optimizing performance. Precise track gauge measurements ensure compatibility. Innovations in trackside infrastructure enhance railway durability, supporting integration with wind power for sustainable energy solutions.
Rolling stock, including electric multiple units and high-speed trains, require advanced cable systems for traction and energy efficiency. Underground cables and third rail systems enable the expansion of railway networks into urban areas, while overhead contact lines and regenerative braking systems contribute to environmental sustainability. Corrosion resistance, thermal rating, and fire resistance are essential considerations for railway cable design. Traffic management and energy efficiency are increasingly important factors in the market, as the industry strives to optimize operations and reduce environmental impact. The market for railway network cables is poised for continued growth, driven by the evolving demands of the railway sector.
Dive into Technavio’s robust research methodology, blending expert interviews, extensive data synthesis, and validated models for unparalleled Railway Network Cables Market insights. See full methodology.
|
Market Scope |
|
|
Report Coverage |
Details |
|
Page number |
214 |
|
Base year |
2024 |
|
Historic period |
2019-2023 |
|
Forecast period |
2025-2029 |
|
Growth momentum & CAGR |
Accelerate at a CAGR of 5.8% |
|
Market growth 2025-2029 |
USD 3.06 billion |
|
Market structure |
Fragmented |
|
YoY growth 2024-2025(%) |
5.4 |
|
Key countries |
China, US, Germany, Canada, Japan, India, France, South Korea, UK, and Italy |
|
Competitive landscape |
Leading Companies, Market Positioning of Companies, Competitive Strategies, and Industry Risks |
What are the Key Data Covered in this Railway Network Cables Market Research and Growth Report?
- CAGR of the Railway Network Cables industry during the forecast period
- Detailed information on factors that will drive the growth and forecasting between 2025 and 2029
- Precise estimation of the size of the market and its contribution of the industry in focus to the parent market
- Accurate predictions about upcoming growth and trends and changes in consumer behaviour
- Growth of the market across APAC, Europe, North America, Middle East and Africa, and South America
- Thorough analysis of the market’s competitive landscape and detailed information about companies
- Comprehensive analysis of factors that will challenge the railway network cables market growth of industry companies
We can help! Our analysts can customize this railway network cables market research report to meet your requirements.
 RIA -
RIA - 
