Road Freight Transport Market Analysis, Size, and Forecast 2026-2030: APAC (China, India, and Japan), North America (US, Canada, and Mexico), Europe (Germany, France, and UK), Middle East and Africa (Saudi Arabia, South Africa, and UAE), South America (Brazil, Argentina, and Colombia), and Rest of World (ROW)

Road Freight Transport Market Analysis, Size, and Forecast 2026-2030:
APAC (China, India, and Japan), North America (US, Canada, and Mexico), Europe (Germany, France, and UK), Middle East and Africa (Saudi Arabia, South Africa, and UAE), South America (Brazil, Argentina, and Colombia), and Rest of World (ROW)

Published: Mar 2026 292 Pages SKU: IRTNTR74791

Market Overview at a Glance

$222 B
Market Opportunity
8.2%
CAGR 2025 - 2030
40.4%
APAC Growth
$272.4 B
Medium and heavy commercial vehicle segment 2024

Road Freight Transport Market Size 2026-2030

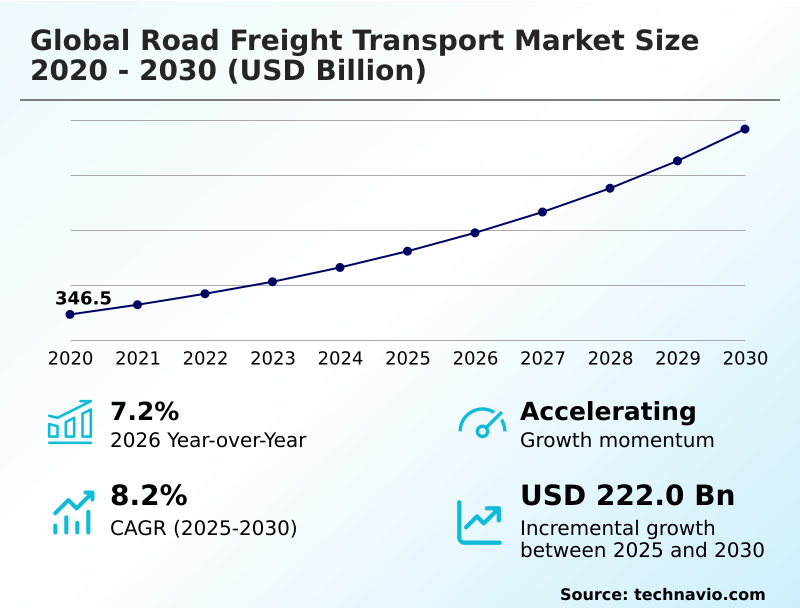
The road freight transport market size is valued to increase by USD 222 billion, at a CAGR of 8.2% from 2025 to 2030. Rising demand from e-commerce and retail sectors will drive the road freight transport market.

Major Market Trends & Insights

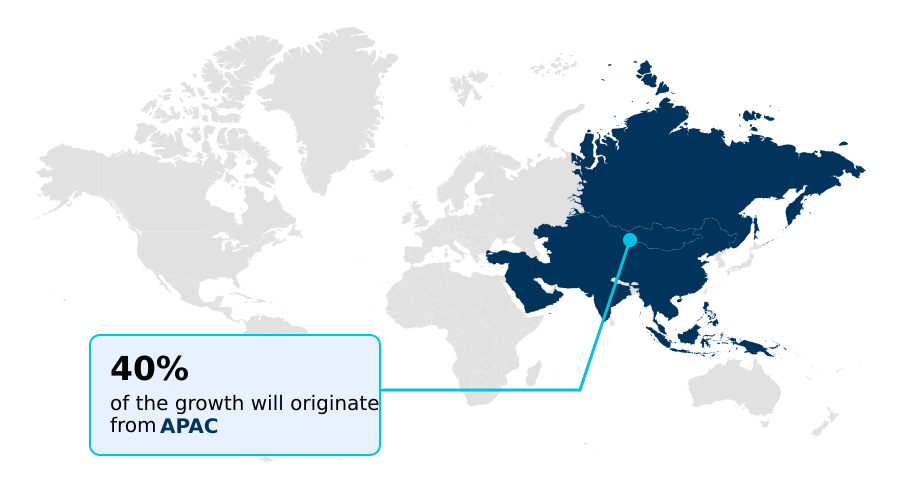
  • APAC dominated the market and accounted for a 40.4% growth during the forecast period.
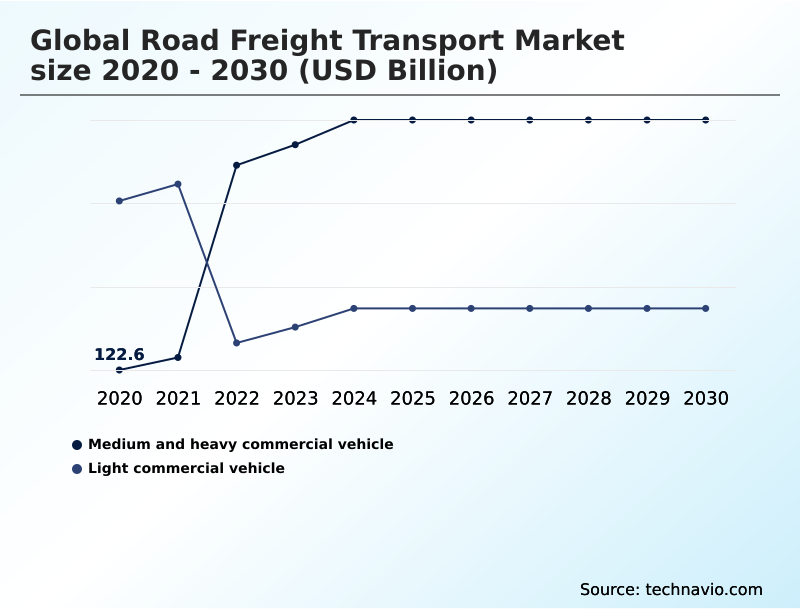
  • By Vehicle Type - Medium and heavy commercial vehicle segment was valued at USD 272.4 billion in 2024
  • By End-user - Manufacturing segment accounted for the largest market revenue share in 2024

Market Size & Forecast

  • Market Opportunities: USD 337 billion
  • Market Future Opportunities: USD 222 billion
  • CAGR from 2025 to 2030 : 8.2%

Market Summary

  • The road freight transport market remains the essential backbone of commerce, facilitating the movement of goods through a complex network of services. Its evolution is driven by the relentless expansion of e-commerce, which has reshaped retail supply chains and intensified the demand for efficient last-mile delivery and middle-mile delivery.
  • This has spurred innovation in logistics network optimization and the adoption of advanced technologies. For instance, a logistics provider managing a just-in-time manufacturing supply chain now relies on a transportation management system (tms) with real-time shipment tracking to synchronize the arrival of components, minimizing inventory and preventing production delays.
  • At the same time, the industry grapples with challenges such as the persistent driver shortage, volatile fuel costs, and increasing regulatory pressures, particularly environmental mandates promoting green logistics initiatives and the use of alternative fuel vehicles.
  • A key trend is the strategic pivot toward building greater supply chain resilience, compelling operators to invest in flexible operational models and enhanced supply chain visibility to navigate disruptions effectively. This dynamic environment fosters continuous transformation, where technology and strategic adaptation are paramount for competitiveness.

What will be the Size of the Road Freight Transport Market during the forecast period?

Get Key Insights on Market Forecast (PDF) Request Free Sample

How is the Road Freight Transport Market Segmented?

The road freight transport industry research report provides comprehensive data (region-wise segment analysis), with forecasts and estimates in "USD billion" for the period 2026-2030, as well as historical data from 2020-2024 for the following segments.

  • Vehicle type
    • Medium and heavy commercial vehicle
    • Light commercial vehicle
  • End-user
    • Manufacturing
    • Automotive
    • Consumer goods
    • Food and beverage
    • Others
  • Type
    • Domestic
    • International
  • Geography
    • APAC
      • China
      • India
      • Japan
    • North America
      • US
      • Canada
      • Mexico
    • Europe
      • Germany
      • France
      • UK
    • Middle East and Africa
      • Saudi Arabia
      • South Africa
      • UAE
    • South America
      • Brazil
      • Argentina
      • Colombia
    • Rest of World (ROW)

By Vehicle Type Insights

The medium and heavy commercial vehicle segment is estimated to witness significant growth during the forecast period.

The medium and heavy commercial vehicle segment is the cornerstone of the road freight industry, vital for full truckload (ftl) services and the line-haul component of consolidated networks.

These vehicles are essential for long-distance and cross-border haulage, connecting manufacturing centers with distribution points and enabling intermodal trucking through drayage transportation. Operators face pressures from strict vehicle weight limitations and the need for effective operational cost management.

Consequently, many are pursuing fleet modernization programs, adopting telematics and gps tracking to improve asset utilization metrics and carrier capacity management.

A key focus is carbon footprint reduction, with some achieving a 15% decrease in emissions through investment in alternative fuel vehicles and partnerships with specialized third-party logistics (3pl) provider for optimized routing.

Request Free Sample

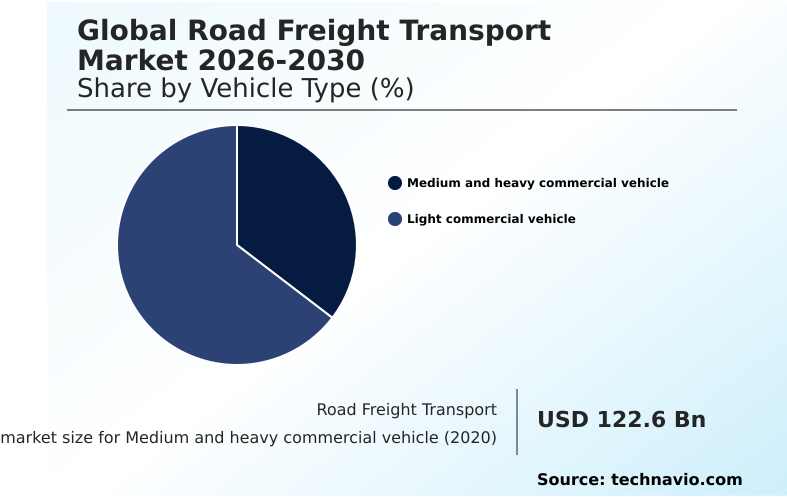
The Medium and heavy commercial vehicle segment was valued at USD 272.4 billion in 2024 and showed a gradual increase during the forecast period.

Request Free Sample

Regional Analysis

APAC is estimated to contribute 40.4% to the growth of the global market during the forecast period.Technavio’s analysts have elaborately explained the regional trends and drivers that shape the market during the forecast period.

See How Road Freight Transport Market Demand is Rising in APAC Request Free Sample

The market's geographic landscape is characterized by diverse operational models and levels of technological adoption. Mature regions demonstrate high integration of intermodal transport and sophisticated urban logistics planning, while emerging markets focus on foundational infrastructure.

The adoption of a transportation management system (tms) is becoming widespread, with some operators reporting a 15% improvement in logistics network optimization. Predictive analytics for logistics are also being used for supply chain risk mitigation.

Specialized services like temperature-controlled transport and oversized cargo transport are concentrated in industrial hubs. The use of asset-light transportation models through non-asset freight brokerage varies significantly, reflecting regional capital investment trends.

Efficient procurement logistics and strict service-level agreements (slas) are now critical differentiators globally.

Market Dynamics

Our researchers analyzed the data with 2025 as the base year, along with the key drivers, trends, and challenges. A holistic analysis of drivers will help companies refine their marketing strategies to gain a competitive advantage.

  • Strategic decision-making in the road freight transport market now hinges on a detailed understanding of nuanced operational trade-offs, such as in ftl vs ltl shipping cost analysis. As companies focus on improving supply chain resilience, they are implementing a transportation management system to gain control over their logistics networks.
  • The persistent impact of driver shortages on freight has accelerated the adoption of technology, including the benefits of digital freight matching platforms that optimize carrier selection. Optimizing last-mile delivery routes has become a critical competitive differentiator, especially for firms engaged in optimizing warehousing for e-commerce fulfillment.
  • Managing fuel price volatility in trucking remains a core financial challenge, pushing fleets toward more efficient practices. Furthermore, technology for enhancing supply chain visibility is no longer a luxury but a necessity for road freight for just-in-time manufacturing. On the compliance front, navigating low emission zone regulations is a key consideration in fleet modernization.
  • Sustainability in road freight transport is a growing priority, with a focus on reducing carbon emissions in logistics. The role of ai in route optimization has demonstrated a capacity to reduce fuel consumption by more than 15% compared to manual methods. Telematics for commercial fleet safety, asset-light vs asset-based trucking models, and addressing cross-border freight compliance challenges are also vital.
  • Finally, specialized sectors face unique issues, such as the challenges in cold chain road transport, while many are exploring intermodal transportation for cost savings.

What are the key market drivers leading to the rise in the adoption of Road Freight Transport Industry?

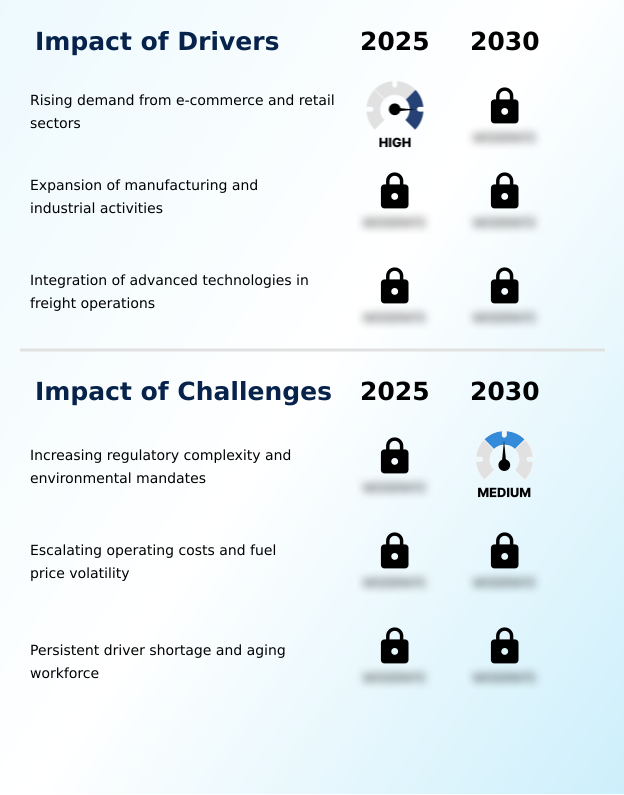
  • Rising demand from the e-commerce and retail sectors is a key driver for market growth.

  • The rapid expansion of e-commerce fulfillment is a primary market driver, escalating demand for omnichannel retail logistics, especially last-mile delivery and middle-mile delivery.
  • This structural shift necessitates sophisticated warehousing and distribution networks and efficient reverse logistics processes, increasing reliance on door-to-door service. Companies leveraging route optimization software are achieving up to a 25% improvement in last mile logistics efficiency.
  • The rise of micro-fulfillment center logistics further fuels demand for final mile services.
  • These dynamics require integrated logistics solutions with real-time shipment tracking to meet consumer expectations for speed and reliability, boosting overall market activity by an estimated 10% in related segments.

What are the market trends shaping the Road Freight Transport Industry?

  • A heightened focus on supply chain resilience and agility is emerging as a defining market trend, prioritizing adaptive logistics networks to mitigate disruptions.

  • A strategic shift toward enhancing supply chain resilience and implementing green logistics initiatives defines current market trends. Shippers are adopting multi-sourcing strategy frameworks, including nearshoring supply chains and reshoring initiatives, for effective supply chain risk mitigation. This drives demand for flexible transport solutions like less-than-truckload (ltl) and dedicated contract services.
  • Technology is crucial, with digital freight matching platforms improving logistics network optimization by 20% for some users. Enhanced supply chain visibility and value-added logistics services offered through freight brokerage are now standard expectations. Efficient freight consolidation techniques have also been shown to reduce empty miles by over 15%, aligning with sustainability goals.

What challenges does the Road Freight Transport Industry face during its growth?

  • Increasing regulatory complexity and environmental mandates present a key challenge affecting industry growth.

  • Navigating escalating operational costs and stringent regulations presents a significant challenge. The fuel price volatility impact and the need for driver shortage mitigation strategies strain carrier profitability, with labor costs increasing over 12% in some areas. Compliance with complex rules governing driver hours of service and specialized freight like hazardous materials transport or cold chain logistics requires significant investment.
  • The proliferation of low emission zones and emerging road usage pricing models complicates logistics, increasing pressure for backhaul optimization. This has accelerated interest in electric commercial vehicles, though high initial costs remain a barrier. Inefficient customs brokerage services can also cause delays of up to 30%, impacting cross-border trade.

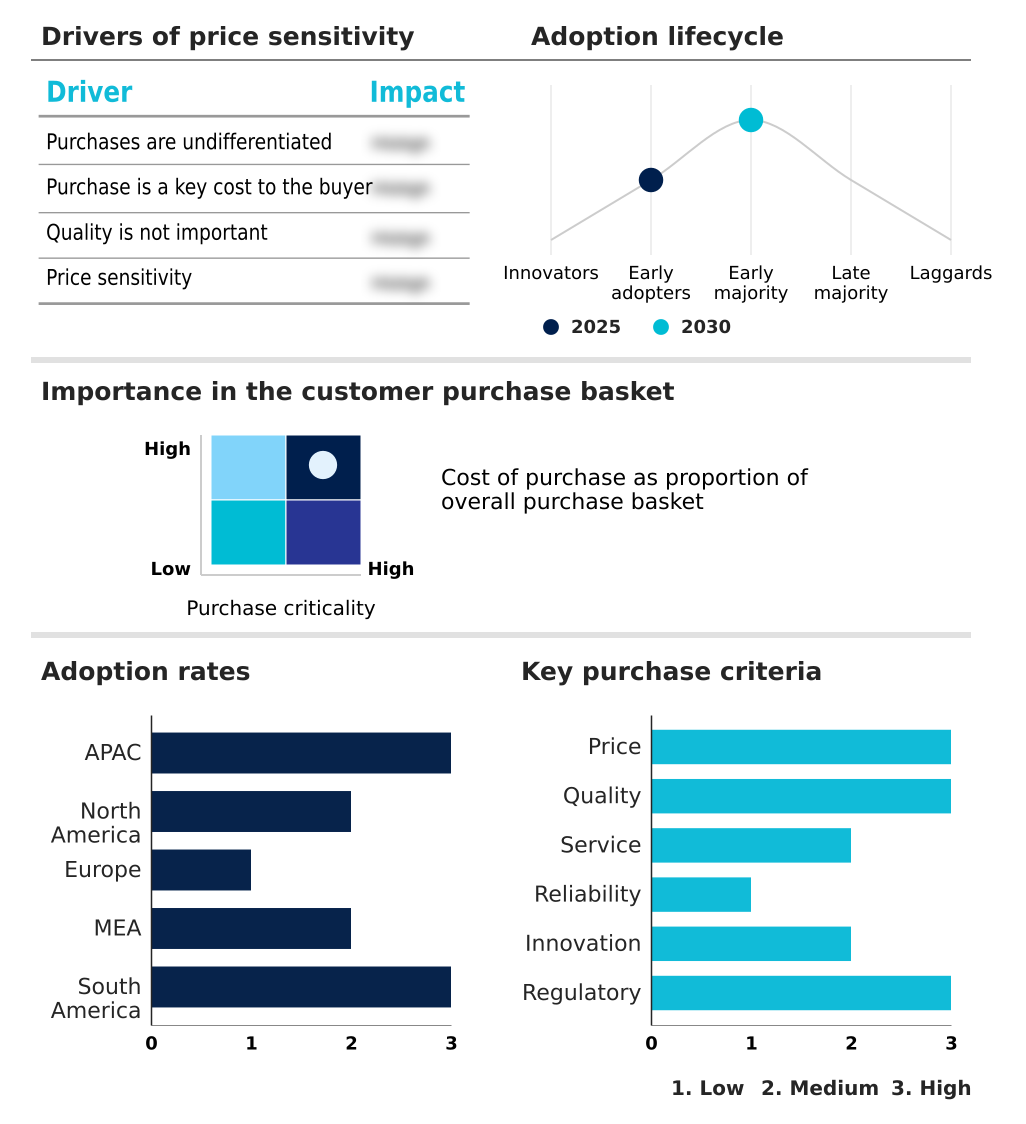
Exclusive Technavio Analysis on Customer Landscape

The road freight transport market forecasting report includes the adoption lifecycle of the market, covering from the innovator’s stage to the laggard’s stage. It focuses on adoption rates in different regions based on penetration. Furthermore, the road freight transport market report also includes key purchase criteria and drivers of price sensitivity to help companies evaluate and develop their market growth analysis strategies.

Customer Landscape of Road Freight Transport Industry

Competitive Landscape

Companies are implementing various strategies, such as strategic alliances, road freight transport market forecast, partnerships, mergers and acquisitions, geographical expansion, and product/service launches, to enhance their presence in the industry.

ArcBest Corp. - Delivers integrated road freight transport services, including asset-based less-than-truckload shipping and asset-light logistics solutions, to diverse commercial clients.

The industry research and growth report includes detailed analyses of the competitive landscape of the market and information about key companies, including:

  • ArcBest Corp.
  • C H Robinson Worldwide Inc.
  • CJ Darcl Logistics Ltd.
  • CMA CGM Group
  • Estes Express Lines
  • FedEx Corp.
  • Hub Group Inc.
  • JB Hunt Transport Services
  • Knight Swift Transportation
  • Landstar System Inc.
  • NFI Industries Inc.
  • Old Dominion Freight Line
  • Penske Corp.
  • R L Carriers Inc.
  • Rhenus SE and Co. KG
  • Ryder System Inc.
  • Schneider National Inc.
  • United Parcel Service Inc.
  • Werner Enterprises Inc.
  • XPO Inc.

Qualitative and quantitative analysis of companies has been conducted to help clients understand the wider business environment as well as the strengths and weaknesses of key industry players. Data is qualitatively analyzed to categorize companies as pure play, category-focused, industry-focused, and diversified; it is quantitatively analyzed to categorize companies as dominant, leading, strong, tentative, and weak.

Recent Development and News in Road freight transport market

  • In March, 2025, United Parcel Service Inc. introduced an advanced road freight services platform incorporating centralized fleet management and AI-driven route optimization.
  • In January, 2025, Union Pacific announced a 16% increase in intermodal truck-rail shipments, underscoring a strategic shift toward integrated transport models.
  • In January, 2025, The Australian Federal Government implemented a new fuel efficiency standard for light commercial vehicles, impacting fleet modernization and procurement decisions.
  • In November, 2024, Knight-Swift Transportation completed the acquisition of a regional LTL carrier, expanding its network capacity and service footprint in key industrial corridors.

Dive into Technavio’s robust research methodology, blending expert interviews, extensive data synthesis, and validated models for unparalleled Road Freight Transport Market insights. See full methodology.

Market Scope
Page number 292
Base year 2025
Historic period 2020-2024
Forecast period 2026-2030
Growth momentum & CAGR Accelerate at a CAGR of 8.2%
Market growth 2026-2030 USD 222.0 billion
Market structure Fragmented
YoY growth 2025-2026(%) 7.2%
Key countries China, India, Japan, South Korea, Australia, Indonesia, US, Canada, Mexico, Germany, France, UK, Russia, Poland, The Netherlands, Saudi Arabia, South Africa, UAE, Nigeria, Egypt, Brazil, Argentina and Colombia
Competitive landscape Leading Companies, Market Positioning of Companies, Competitive Strategies, and Industry Risks

Request Free Sample

Research Analyst Overview

  • The road freight transport market is undergoing a significant operational transformation, driven by technological integration and economic pressures. Core activities like full truckload (ftl) and less-than-truckload (ltl) are being redefined by digital platforms that enable services like digital freight matching and backhaul optimization.
  • The industry's response to the rise of online retail is evident in the focus on e-commerce fulfillment, which demands sophisticated warehousing and distribution networks and efficient last-mile delivery. Boardroom decisions are increasingly influenced by the need for enhanced supply chain visibility and supply chain resilience.
  • For example, investment in a robust transportation management system (tms) has enabled some firms to achieve a 30% reduction in order processing errors. This focus on data-driven efficiency extends to specialized areas, including temperature-controlled transport and intermodal transport, where telematics and gps tracking are now standard for ensuring integrity and optimizing asset movement through effective fleet management solutions.

What are the Key Data Covered in this Road Freight Transport Market Research and Growth Report?

  • What is the expected growth of the Road Freight Transport Market between 2026 and 2030?

    • USD 222 billion, at a CAGR of 8.2%

  • What segmentation does the market report cover?

    • The report is segmented by Vehicle Type (Medium and heavy commercial vehicle, and Light commercial vehicle), End-user (Manufacturing, Automotive, Consumer goods, Food and beverage, and Others), Type (Domestic, and International) and Geography (APAC, North America, Europe, Middle East and Africa, South America)

  • Which regions are analyzed in the report?

    • APAC, North America, Europe, Middle East and Africa and South America

  • What are the key growth drivers and market challenges?

    • Rising demand from e-commerce and retail sectors, Increasing regulatory complexity and environmental mandates

  • Who are the major players in the Road Freight Transport Market?

    • ArcBest Corp., C H Robinson Worldwide Inc., CJ Darcl Logistics Ltd., CMA CGM Group, Estes Express Lines, FedEx Corp., Hub Group Inc., JB Hunt Transport Services, Knight Swift Transportation, Landstar System Inc., NFI Industries Inc., Old Dominion Freight Line, Penske Corp., R L Carriers Inc., Rhenus SE and Co. KG, Ryder System Inc., Schneider National Inc., United Parcel Service Inc., Werner Enterprises Inc. and XPO Inc.

Market Research Insights

  • The market is characterized by dynamic shifts as operators adapt to new economic realities. The fuel price volatility impact has pushed operational cost management to the forefront, with successful firms improving fuel efficiency by up to 15% through advanced routing. Supply chain risk mitigation strategies are now standard, with a reported 25% of shippers diversifying suppliers to avoid disruptions.
  • The focus on last mile logistics efficiency has led to innovations in urban logistics planning, reducing delivery times in dense areas by over 20%. Furthermore, effective carrier capacity management and the use of third-party logistics (3pl) provider partnerships have become critical for maintaining service levels during demand peaks.
  • These data-driven approaches are essential for navigating a competitive landscape where service-level agreements (slas) and asset utilization metrics define success.

We can help! Our analysts can customize this road freight transport market research report to meet your requirements.

Get in touch

1. Executive Summary

1.1 Market overview

Executive Summary - Chart on Market Overview
Executive Summary - Data Table on Market Overview
Executive Summary - Chart on Global Market Characteristics
Executive Summary - Chart on Market by Geography
Executive Summary - Chart on Market Segmentation by Vehicle Type
Executive Summary - Chart on Market Segmentation by End-user
Executive Summary - Chart on Market Segmentation by Type
Executive Summary - Chart on Incremental Growth
Executive Summary - Data Table on Incremental Growth
Executive Summary - Chart on Company Market Positioning

2. Technavio Analysis

2.1 Analysis of price sensitivity, lifecycle, customer purchase basket, adoption rates, and purchase criteria

2.2 Criticality of inputs and Factors of differentiation

Chart on Overview on criticality of inputs and factors of differentiation

2.3 Factors of disruption

Chart on Overview on factors of disruption

2.4 Impact of drivers and challenges

Chart on Impact of drivers and challenges in 2025 and 2030

3. Market Landscape

3.1 Market ecosystem

Chart on Parent Market
Data Table on - Parent Market

3.2 Market characteristics

Chart on Market characteristics analysis

3.3 Value chain analysis

Chart on Value chain analysis

4. Market Sizing

4.1 Market definition

Data Table on Offerings of companies included in the market definition

4.2 Market segment analysis

Market segments

4.3 Market size 2025

4.4 Market outlook: Forecast for 2025-2030

Chart on Global - Market size and forecast 2025-2030 ($ billion)
Data Table on Global - Market size and forecast 2025-2030 ($ billion)
Chart on Global Market: Year-over-year growth 2025-2030 (%)
Data Table on Global Market: Year-over-year growth 2025-2030 (%)

5. Historic Market Size

5.1 Global Road Freight Transport Market 2020 - 2024

Historic Market Size - Data Table on Global Road Freight Transport Market 2020 - 2024 ($ billion)

5.2 Vehicle Type segment analysis 2020 - 2024

Historic Market Size - Vehicle Type Segment 2020 - 2024 ($ billion)

5.3 End-user segment analysis 2020 - 2024

Historic Market Size - End-user Segment 2020 - 2024 ($ billion)

5.4 Type segment analysis 2020 - 2024

Historic Market Size - Type Segment 2020 - 2024 ($ billion)

5.5 Geography segment analysis 2020 - 2024

Historic Market Size - Geography Segment 2020 - 2024 ($ billion)

5.6 Country segment analysis 2020 - 2024

Historic Market Size - Country Segment 2020 - 2024 ($ billion)

6. Qualitative Analysis

6.1 Impact of AI on global road freight transport market

6.2 Impact of geopolitical conflicts on global road freight transport market

7. Five Forces Analysis

7.1 Five forces summary

Five forces analysis - Comparison between 2025 and 2030

7.2 Bargaining power of buyers

Bargaining power of buyers - Impact of key factors 2025 and 2030

7.3 Bargaining power of suppliers

Bargaining power of suppliers - Impact of key factors in 2025 and 2030

7.4 Threat of new entrants

Threat of new entrants - Impact of key factors in 2025 and 2030

7.5 Threat of substitutes

Threat of substitutes - Impact of key factors in 2025 and 2030

7.6 Threat of rivalry

Threat of rivalry - Impact of key factors in 2025 and 2030

7.7 Market condition

Chart on Market condition - Five forces 2025 and 2030

8. Market Segmentation by Vehicle Type

8.1 Market segments

Chart on Vehicle Type - Market share 2025-2030 (%)
Data Table on Vehicle Type - Market share 2025-2030 (%)

8.2 Comparison by Vehicle Type

Chart on Comparison by Vehicle Type
Data Table on Comparison by Vehicle Type

8.3 Medium and heavy commercial vehicle - Market size and forecast 2025-2030

Chart on Medium and heavy commercial vehicle - Market size and forecast 2025-2030 ($ billion)
Data Table on Medium and heavy commercial vehicle - Market size and forecast 2025-2030 ($ billion)
Chart on Medium and heavy commercial vehicle - Year-over-year growth 2025-2030 (%)
Data Table on Medium and heavy commercial vehicle - Year-over-year growth 2025-2030 (%)

8.4 Light commercial vehicle - Market size and forecast 2025-2030

Chart on Light commercial vehicle - Market size and forecast 2025-2030 ($ billion)
Data Table on Light commercial vehicle - Market size and forecast 2025-2030 ($ billion)
Chart on Light commercial vehicle - Year-over-year growth 2025-2030 (%)
Data Table on Light commercial vehicle - Year-over-year growth 2025-2030 (%)

8.5 Market opportunity by Vehicle Type

Market opportunity by Vehicle Type ($ billion)
Data Table on Market opportunity by Vehicle Type ($ billion)

9. Market Segmentation by End-user

9.1 Market segments

Chart on End-user - Market share 2025-2030 (%)
Data Table on End-user - Market share 2025-2030 (%)

9.2 Comparison by End-user

Chart on Comparison by End-user
Data Table on Comparison by End-user

9.3 Manufacturing - Market size and forecast 2025-2030

Chart on Manufacturing - Market size and forecast 2025-2030 ($ billion)
Data Table on Manufacturing - Market size and forecast 2025-2030 ($ billion)
Chart on Manufacturing - Year-over-year growth 2025-2030 (%)
Data Table on Manufacturing - Year-over-year growth 2025-2030 (%)

9.4 Automotive - Market size and forecast 2025-2030

Chart on Automotive - Market size and forecast 2025-2030 ($ billion)
Data Table on Automotive - Market size and forecast 2025-2030 ($ billion)
Chart on Automotive - Year-over-year growth 2025-2030 (%)
Data Table on Automotive - Year-over-year growth 2025-2030 (%)

9.5 Consumer goods - Market size and forecast 2025-2030

Chart on Consumer goods - Market size and forecast 2025-2030 ($ billion)
Data Table on Consumer goods - Market size and forecast 2025-2030 ($ billion)
Chart on Consumer goods - Year-over-year growth 2025-2030 (%)
Data Table on Consumer goods - Year-over-year growth 2025-2030 (%)

9.6 Food and beverage - Market size and forecast 2025-2030

Chart on Food and beverage - Market size and forecast 2025-2030 ($ billion)
Data Table on Food and beverage - Market size and forecast 2025-2030 ($ billion)
Chart on Food and beverage - Year-over-year growth 2025-2030 (%)
Data Table on Food and beverage - Year-over-year growth 2025-2030 (%)

9.7 Others - Market size and forecast 2025-2030

Chart on Others - Market size and forecast 2025-2030 ($ billion)
Data Table on Others - Market size and forecast 2025-2030 ($ billion)
Chart on Others - Year-over-year growth 2025-2030 (%)
Data Table on Others - Year-over-year growth 2025-2030 (%)

9.8 Market opportunity by End-user

Market opportunity by End-user ($ billion)
Data Table on Market opportunity by End-user ($ billion)

10. Market Segmentation by Type

10.1 Market segments

Chart on Type - Market share 2025-2030 (%)
Data Table on Type - Market share 2025-2030 (%)

10.2 Comparison by Type

Chart on Comparison by Type
Data Table on Comparison by Type

10.3 Domestic - Market size and forecast 2025-2030

Chart on Domestic - Market size and forecast 2025-2030 ($ billion)
Data Table on Domestic - Market size and forecast 2025-2030 ($ billion)
Chart on Domestic - Year-over-year growth 2025-2030 (%)
Data Table on Domestic - Year-over-year growth 2025-2030 (%)

10.4 International - Market size and forecast 2025-2030

Chart on International - Market size and forecast 2025-2030 ($ billion)
Data Table on International - Market size and forecast 2025-2030 ($ billion)
Chart on International - Year-over-year growth 2025-2030 (%)
Data Table on International - Year-over-year growth 2025-2030 (%)

10.5 Market opportunity by Type

Market opportunity by Type ($ billion)
Data Table on Market opportunity by Type ($ billion)

11. Customer Landscape

11.1 Customer landscape overview

Analysis of price sensitivity, lifecycle, customer purchase basket, adoption rates, and purchase criteria

12. Geographic Landscape

12.1 Geographic segmentation

Chart on Market share by geography 2025-2030 (%)
Data Table on Market share by geography 2025-2030 (%)

12.2 Geographic comparison

Chart on Geographic comparison
Data Table on Geographic comparison

12.3 APAC - Market size and forecast 2025-2030

Chart on APAC - Market size and forecast 2025-2030 ($ billion)
Data Table on APAC - Market size and forecast 2025-2030 ($ billion)
Chart on APAC - Year-over-year growth 2025-2030 (%)
Data Table on APAC - Year-over-year growth 2025-2030 (%)
Chart on Regional Comparison - APAC
Data Table on Regional Comparison - APAC

12.3.1 China - Market size and forecast 2025-2030

Chart on China - Market size and forecast 2025-2030 ($ billion)
Data Table on China - Market size and forecast 2025-2030 ($ billion)
Chart on China - Year-over-year growth 2025-2030 (%)
Data Table on China - Year-over-year growth 2025-2030 (%)

12.3.2 India - Market size and forecast 2025-2030

Chart on India - Market size and forecast 2025-2030 ($ billion)
Data Table on India - Market size and forecast 2025-2030 ($ billion)
Chart on India - Year-over-year growth 2025-2030 (%)
Data Table on India - Year-over-year growth 2025-2030 (%)

12.3.3 Japan - Market size and forecast 2025-2030

Chart on Japan - Market size and forecast 2025-2030 ($ billion)
Data Table on Japan - Market size and forecast 2025-2030 ($ billion)
Chart on Japan - Year-over-year growth 2025-2030 (%)
Data Table on Japan - Year-over-year growth 2025-2030 (%)

12.3.4 South Korea - Market size and forecast 2025-2030

Chart on South Korea - Market size and forecast 2025-2030 ($ billion)
Data Table on South Korea - Market size and forecast 2025-2030 ($ billion)
Chart on South Korea - Year-over-year growth 2025-2030 (%)
Data Table on South Korea - Year-over-year growth 2025-2030 (%)

12.3.5 Australia - Market size and forecast 2025-2030

Chart on Australia - Market size and forecast 2025-2030 ($ billion)
Data Table on Australia - Market size and forecast 2025-2030 ($ billion)
Chart on Australia - Year-over-year growth 2025-2030 (%)
Data Table on Australia - Year-over-year growth 2025-2030 (%)

12.3.6 Indonesia - Market size and forecast 2025-2030

Chart on Indonesia - Market size and forecast 2025-2030 ($ billion)
Data Table on Indonesia - Market size and forecast 2025-2030 ($ billion)
Chart on Indonesia - Year-over-year growth 2025-2030 (%)
Data Table on Indonesia - Year-over-year growth 2025-2030 (%)

12.4 North America - Market size and forecast 2025-2030

Chart on North America - Market size and forecast 2025-2030 ($ billion)
Data Table on North America - Market size and forecast 2025-2030 ($ billion)
Chart on North America - Year-over-year growth 2025-2030 (%)
Data Table on North America - Year-over-year growth 2025-2030 (%)
Chart on Regional Comparison - North America
Data Table on Regional Comparison - North America

12.4.1 US - Market size and forecast 2025-2030

Chart on US - Market size and forecast 2025-2030 ($ billion)
Data Table on US - Market size and forecast 2025-2030 ($ billion)
Chart on US - Year-over-year growth 2025-2030 (%)
Data Table on US - Year-over-year growth 2025-2030 (%)

12.4.2 Canada - Market size and forecast 2025-2030

Chart on Canada - Market size and forecast 2025-2030 ($ billion)
Data Table on Canada - Market size and forecast 2025-2030 ($ billion)
Chart on Canada - Year-over-year growth 2025-2030 (%)
Data Table on Canada - Year-over-year growth 2025-2030 (%)

12.4.3 Mexico - Market size and forecast 2025-2030

Chart on Mexico - Market size and forecast 2025-2030 ($ billion)
Data Table on Mexico - Market size and forecast 2025-2030 ($ billion)
Chart on Mexico - Year-over-year growth 2025-2030 (%)
Data Table on Mexico - Year-over-year growth 2025-2030 (%)

12.5 Europe - Market size and forecast 2025-2030

Chart on Europe - Market size and forecast 2025-2030 ($ billion)
Data Table on Europe - Market size and forecast 2025-2030 ($ billion)
Chart on Europe - Year-over-year growth 2025-2030 (%)
Data Table on Europe - Year-over-year growth 2025-2030 (%)
Chart on Regional Comparison - Europe
Data Table on Regional Comparison - Europe

12.5.1 Germany - Market size and forecast 2025-2030

Chart on Germany - Market size and forecast 2025-2030 ($ billion)
Data Table on Germany - Market size and forecast 2025-2030 ($ billion)
Chart on Germany - Year-over-year growth 2025-2030 (%)
Data Table on Germany - Year-over-year growth 2025-2030 (%)

12.5.2 France - Market size and forecast 2025-2030

Chart on France - Market size and forecast 2025-2030 ($ billion)
Data Table on France - Market size and forecast 2025-2030 ($ billion)
Chart on France - Year-over-year growth 2025-2030 (%)
Data Table on France - Year-over-year growth 2025-2030 (%)

12.5.3 UK - Market size and forecast 2025-2030

Chart on UK - Market size and forecast 2025-2030 ($ billion)
Data Table on UK - Market size and forecast 2025-2030 ($ billion)
Chart on UK - Year-over-year growth 2025-2030 (%)
Data Table on UK - Year-over-year growth 2025-2030 (%)

12.5.4 Russia - Market size and forecast 2025-2030

Chart on Russia - Market size and forecast 2025-2030 ($ billion)
Data Table on Russia - Market size and forecast 2025-2030 ($ billion)
Chart on Russia - Year-over-year growth 2025-2030 (%)
Data Table on Russia - Year-over-year growth 2025-2030 (%)

12.5.5 Poland - Market size and forecast 2025-2030

Chart on Poland - Market size and forecast 2025-2030 ($ billion)
Data Table on Poland - Market size and forecast 2025-2030 ($ billion)
Chart on Poland - Year-over-year growth 2025-2030 (%)
Data Table on Poland - Year-over-year growth 2025-2030 (%)

12.5.6 The Netherlands - Market size and forecast 2025-2030

Chart on The Netherlands - Market size and forecast 2025-2030 ($ billion)
Data Table on The Netherlands - Market size and forecast 2025-2030 ($ billion)
Chart on The Netherlands - Year-over-year growth 2025-2030 (%)
Data Table on The Netherlands - Year-over-year growth 2025-2030 (%)

12.6 Middle East and Africa - Market size and forecast 2025-2030

Chart on Middle East and Africa - Market size and forecast 2025-2030 ($ billion)
Data Table on Middle East and Africa - Market size and forecast 2025-2030 ($ billion)
Chart on Middle East and Africa - Year-over-year growth 2025-2030 (%)
Data Table on Middle East and Africa - Year-over-year growth 2025-2030 (%)
Chart on Regional Comparison - Middle East and Africa
Data Table on Regional Comparison - Middle East and Africa

12.6.1 Saudi Arabia - Market size and forecast 2025-2030

Chart on Saudi Arabia - Market size and forecast 2025-2030 ($ billion)
Data Table on Saudi Arabia - Market size and forecast 2025-2030 ($ billion)
Chart on Saudi Arabia - Year-over-year growth 2025-2030 (%)
Data Table on Saudi Arabia - Year-over-year growth 2025-2030 (%)

12.6.2 South Africa - Market size and forecast 2025-2030

Chart on South Africa - Market size and forecast 2025-2030 ($ billion)
Data Table on South Africa - Market size and forecast 2025-2030 ($ billion)
Chart on South Africa - Year-over-year growth 2025-2030 (%)
Data Table on South Africa - Year-over-year growth 2025-2030 (%)

12.6.3 UAE - Market size and forecast 2025-2030

Chart on UAE - Market size and forecast 2025-2030 ($ billion)
Data Table on UAE - Market size and forecast 2025-2030 ($ billion)
Chart on UAE - Year-over-year growth 2025-2030 (%)
Data Table on UAE - Year-over-year growth 2025-2030 (%)

12.6.4 Nigeria - Market size and forecast 2025-2030

Chart on Nigeria - Market size and forecast 2025-2030 ($ billion)
Data Table on Nigeria - Market size and forecast 2025-2030 ($ billion)
Chart on Nigeria - Year-over-year growth 2025-2030 (%)
Data Table on Nigeria - Year-over-year growth 2025-2030 (%)

12.6.5 Egypt - Market size and forecast 2025-2030

Chart on Egypt - Market size and forecast 2025-2030 ($ billion)
Data Table on Egypt - Market size and forecast 2025-2030 ($ billion)
Chart on Egypt - Year-over-year growth 2025-2030 (%)
Data Table on Egypt - Year-over-year growth 2025-2030 (%)

12.7 South America - Market size and forecast 2025-2030

Chart on South America - Market size and forecast 2025-2030 ($ billion)
Data Table on South America - Market size and forecast 2025-2030 ($ billion)
Chart on South America - Year-over-year growth 2025-2030 (%)
Data Table on South America - Year-over-year growth 2025-2030 (%)
Chart on Regional Comparison - South America
Data Table on Regional Comparison - South America

12.7.1 Brazil - Market size and forecast 2025-2030

Chart on Brazil - Market size and forecast 2025-2030 ($ billion)
Data Table on Brazil - Market size and forecast 2025-2030 ($ billion)
Chart on Brazil - Year-over-year growth 2025-2030 (%)
Data Table on Brazil - Year-over-year growth 2025-2030 (%)

12.7.2 Argentina - Market size and forecast 2025-2030

Chart on Argentina - Market size and forecast 2025-2030 ($ billion)
Data Table on Argentina - Market size and forecast 2025-2030 ($ billion)
Chart on Argentina - Year-over-year growth 2025-2030 (%)
Data Table on Argentina - Year-over-year growth 2025-2030 (%)

12.7.3 Colombia - Market size and forecast 2025-2030

Chart on Colombia - Market size and forecast 2025-2030 ($ billion)
Data Table on Colombia - Market size and forecast 2025-2030 ($ billion)
Chart on Colombia - Year-over-year growth 2025-2030 (%)
Data Table on Colombia - Year-over-year growth 2025-2030 (%)

12.8 Market opportunity by geography

Market opportunity by geography ($ billion)
Data Tables on Market opportunity by geography ($ billion)

13. Drivers, Challenges, and Opportunity

13.1 Market drivers

Rising demand from e-commerce and retail sectors
Expansion of manufacturing and industrial activities
Integration of advanced technologies in freight operations

13.2 Market challenges

Increasing regulatory complexity and environmental mandates
Escalating operating costs and fuel price volatility
Persistent driver shortage and aging workforce

13.3 Impact of drivers and challenges

Impact of drivers and challenges in 2025 and 2030

13.4 Market opportunities

Heightened focus on supply chain resilience and agility
Increasing emphasis on sustainability and green logistics
Growing usage of AI and ML in freight forwarding

14. Competitive Landscape

14.1 Overview

14.2

Overview on criticality of inputs and factors of differentiation

14.3 Landscape disruption

Overview on factors of disruption

14.4 Industry risks

Impact of key risks on business

15. Competitive Analysis

15.1 Companies profiled

Companies covered

15.2 Company ranking index

15.3 Market positioning of companies

Matrix on companies position and classification

15.4 ArcBest Corp.

ArcBest Corp. - Overview
ArcBest Corp. - Business segments
ArcBest Corp. - Key offerings
ArcBest Corp. - Segment focus
SWOT

15.5 C H Robinson Worldwide Inc.

C H Robinson Worldwide Inc. - Overview
C H Robinson Worldwide Inc. - Business segments
C H Robinson Worldwide Inc. - Key news
C H Robinson Worldwide Inc. - Key offerings
C H Robinson Worldwide Inc. - Segment focus
SWOT

15.6 CMA CGM Group

CMA CGM Group - Overview
CMA CGM Group - Product / Service
CMA CGM Group - Key offerings
SWOT

15.7 FedEx Corp.

FedEx Corp. - Overview
FedEx Corp. - Business segments
FedEx Corp. - Key offerings
FedEx Corp. - Segment focus
SWOT

15.8 Hub Group Inc.

Hub Group Inc. - Overview
Hub Group Inc. - Business segments
Hub Group Inc. - Key offerings
Hub Group Inc. - Segment focus
SWOT

15.9 JB Hunt Transport Services

JB Hunt Transport Services - Overview
JB Hunt Transport Services - Business segments
JB Hunt Transport Services - Key offerings
JB Hunt Transport Services - Segment focus
SWOT

15.10 Knight Swift Transportation

Knight Swift Transportation - Overview
Knight Swift Transportation - Business segments
Knight Swift Transportation - Key offerings
Knight Swift Transportation - Segment focus
SWOT

15.11 Landstar System Inc.

Landstar System Inc. - Overview
Landstar System Inc. - Product / Service
Landstar System Inc. - Key offerings
SWOT

15.12 NFI Industries Inc.

NFI Industries Inc. - Overview
NFI Industries Inc. - Product / Service
NFI Industries Inc. - Key offerings
SWOT

15.13 Rhenus SE and Co. KG

Rhenus SE and Co. KG - Overview
Rhenus SE and Co. KG - Product / Service
Rhenus SE and Co. KG - Key offerings
SWOT

15.14 Ryder System Inc.

Ryder System Inc. - Overview
Ryder System Inc. - Business segments
Ryder System Inc. - Key offerings
Ryder System Inc. - Segment focus
SWOT

15.15 Schneider National Inc.

Schneider National Inc. - Overview
Schneider National Inc. - Business segments
Schneider National Inc. - Key news
Schneider National Inc. - Key offerings
Schneider National Inc. - Segment focus
SWOT

15.16 United Parcel Service Inc.

United Parcel Service Inc. - Overview
United Parcel Service Inc. - Business segments
United Parcel Service Inc. - Key news
United Parcel Service Inc. - Key offerings
United Parcel Service Inc. - Segment focus
SWOT

15.17 Werner Enterprises Inc.

Werner Enterprises Inc. - Overview
Werner Enterprises Inc. - Business segments
Werner Enterprises Inc. - Key offerings
Werner Enterprises Inc. - Segment focus
SWOT

15.18 XPO Inc.

XPO Inc. - Overview
XPO Inc. - Business segments
XPO Inc. - Key news
XPO Inc. - Key offerings
XPO Inc. - Segment focus
SWOT

16. Appendix

16.1 Scope of the report

Market definition
Objectives
Notes and caveats

16.2 Inclusions and exclusions checklist

Inclusions checklist
Exclusions checklist

16.3 Currency conversion rates for US$

16.4 Research methodology

16.5 Data procurement

Information sources

16.6 Data validation

16.7 Validation techniques employed for market sizing

16.8 Data synthesis

16.9 360 degree market analysis

16.10 List of abbreviations

Research Methodology

Technavio presents a detailed picture of the market by way of study, synthesis, and summation of data from multiple sources. The analysts have presented the various facets of the market with a particular focus on identifying the key industry influencers. The data thus presented is comprehensive, reliable, and the result of extensive research, both primary and secondary.

INFORMATION SOURCES

Primary sources

  • Manufacturers and suppliers
  • Channel partners
  • Industry experts
  • Strategic decision makers

Secondary sources

  • Industry journals and periodicals
  • Government data
  • Financial reports of key industry players
  • Historical data
  • Press releases

DATA ANALYSIS

Data Synthesis

  • Collation of data
  • Estimation of key figures
  • Analysis of derived insights

Data Validation

  • Triangulation with data models
  • Reference against proprietary databases
  • Corroboration with industry experts

REPORT WRITING

Qualitative

  • Market drivers
  • Market challenges
  • Market trends
  • Five forces analysis

Quantitative

  • Market size and forecast
  • Market segmentation
  • Geographical insights
  • Competitive landscape

Interested in this report?

Get your sample now to see our research methodology and insights!

Download Now

Frequently Asked Questions

Road Freight Transport market growth will increase by USD 222.0 billion during 2026-2030.

The Road Freight Transport market is expected to grow at a CAGR of 8.2% during 2026-2030.

Road Freight Transport market is segmented by Vehicle type (Medium and heavy commercial vehicle, Light commercial vehicle) End-user (Manufacturing, Automotive, Consumer goods, Food and beverage, Others) Type (Domestic, International)

ArcBest Corp., C H Robinson Worldwide Inc., CJ Darcl Logistics Ltd., CMA CGM Group, Estes Express Lines, FedEx Corp., Hub Group Inc., JB Hunt Transport Services, Knight Swift Transportation, Landstar System Inc., NFI Industries Inc., Old Dominion Freight Line, Penske Corp., R L Carriers Inc., Rhenus SE and Co. KG, Ryder System Inc., Schneider National Inc., United Parcel Service Inc., Werner Enterprises Inc., XPO Inc. are a few of the key vendors in the Road Freight Transport market.

APAC will register the highest growth rate of 40.4% among the other regions. Therefore, the Road Freight Transport market in APAC is expected to garner significant business opportunities for the vendors during the forecast period.

China, India, Japan, South Korea, Australia, Indonesia, US, Canada, Mexico, Germany, France, UK, Russia, Poland, The Netherlands, Saudi Arabia, South Africa, UAE, Nigeria, Egypt, Brazil, Argentina, Colombia

  • Rising demand from e-commerce and retail sectors is the driving factor this market.

The Road Freight Transport market vendors should focus on grabbing business opportunities from the Vehicle type segment as it accounted for the largest market share in the base year.
RIA - Research AI Assistant
Ask RIA