Reefer Container Market Size 2024-2028
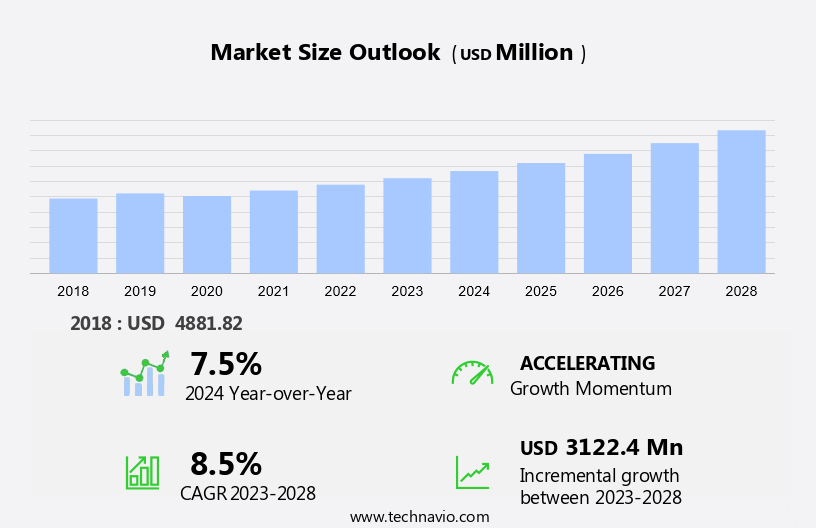
The reefer container market size is forecast to increase by USD 3.12 billion at a CAGR of 8.5% between 2023 and 2028.
- The market is experiencing significant growth due to several key drivers. The increasing demand for fresh food and pharmaceuticals, which require temperature-controlled transportation, is a major factor. Additionally, the global adoption of digital retail spending and the Internet of Things (IoT) is leading to the implementation of remote container management (RCM) systems. These systems utilize Global Positioning System (GPS) technology to monitor and manage container temperatures and locations in real-time, ensuring the integrity of the cargo. As the world's cold chain infrastructure continues to evolve, disruptions in supply chains are becoming less frequent, allowing for more efficient and effective transportation of temperature-sensitive goods. This trend is expected to continue, making the market an attractive investment opportunity for businesses seeking to capitalize on the growing demand for reliable and sustainable cold chain solutions.
What will be the Size of the Market During the Forecast Period?
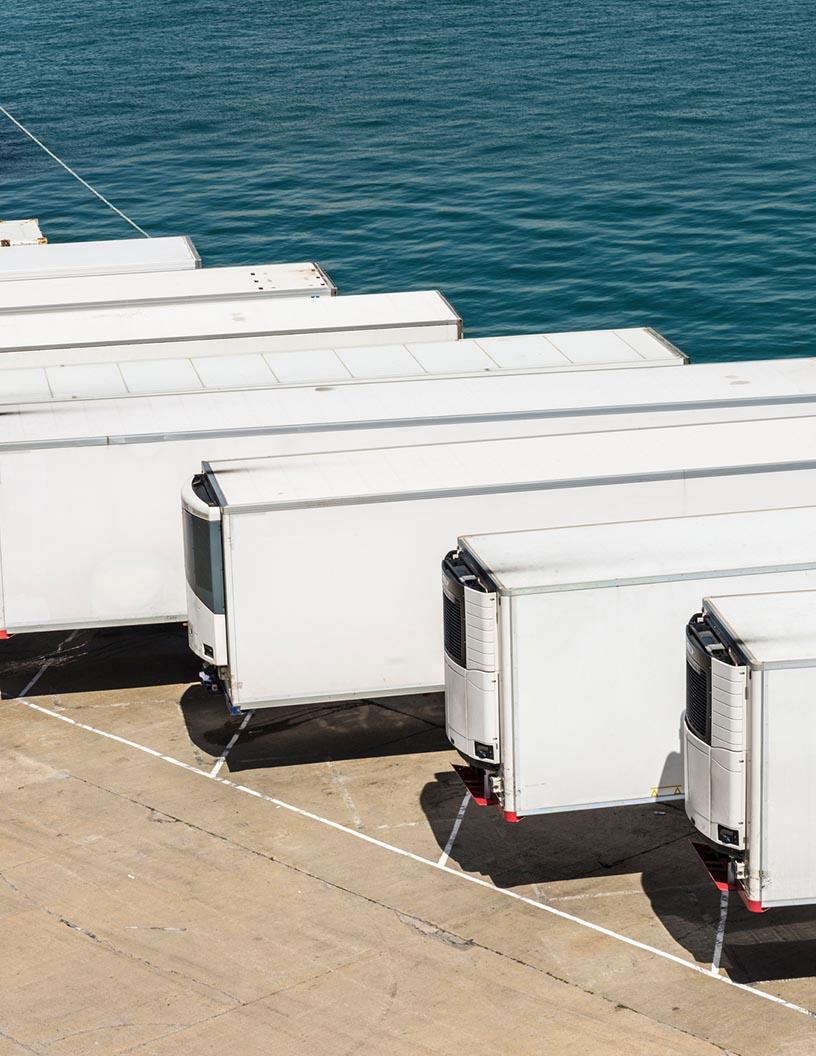
- The market plays a crucial role in the global freight transport industry, particularly for the movement of temperature-sensitive goods. These containers, also known as reefer containers, are essential for maintaining specific temperature ranges during transportation, ensuring the quality and safety of perishable items. Temperature-sensitive goods encompass a wide range of products, including food items, pharmaceuticals, nutraceuticals, and biodegradable goods. The importance of maintaining the correct temperature cannot be overstated, as deviations can lead to spoilage, deterioration, or even contamination. Refrigerated containers are designed with advanced refrigeration systems to maintain the required temperature ranges. These systems can be powered externally using electricity or through diesel-powered generators. .
- Additionally, some containers employ water-cooling systems or redundant refrigeration systems to ensure uninterrupted temperature control. Trade routes for reefer containers are diverse, with significant demand in the transportation of food products, particularly fresh produce and dairy. However, the market also caters to the pharmaceutical, nutraceutical, and biotechnology sectors, where temperature-controlled environments are essential for transporting vaccines, biologics, pharmaceutical drugs, and other sensitive products. The transformation of the retail landscape, driven by e-commerce, has further boosted the demand for reefer containers. Real-time tracking technology allows businesses to monitor the temperature and condition of their goods in transit, ensuring timely delivery and maintaining customer satisfaction.
How is this market segmented and which is the largest segment?
The market research report provides comprehensive data (region-wise segment analysis), with forecasts and estimates in "USD million" for the period 2024-2028, as well as historical data from 2018-2022 for the following segments.
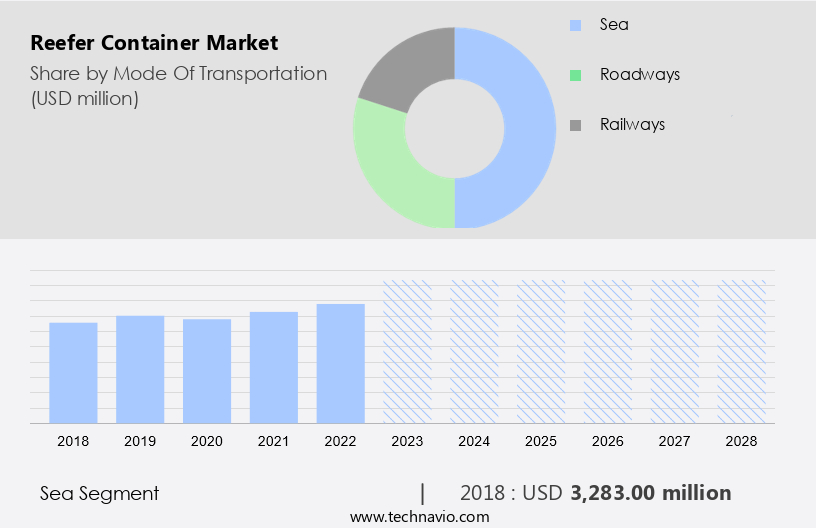
- Mode Of Transportation
- Sea
- Roadways
- Railways
- End-user
- Food and beverage
- Healthcare
- Chemicals
- Geography
- APAC
- China
- India
- Japan
- South Korea
- North America
- Canada
- US
- Europe
- Germany
- South America
- Brazil
- Middle East and Africa
- APAC
By Mode Of Transportation Insights
- The sea segment is estimated to witness significant growth during the forecast period.
The market plays a significant role in facilitating the transportation of temperature-sensitive commodities, including food items such as fruits, meat, fish, vegetables, and dairy products, via seaways. In 2023, maritime trade witnessed a growth of 2.4% compared to the previous year, underscoring the importance of this mode of transportation for perishable goods. Reefer containers enable precise temperature control, ensuring the freshness and safety of these commodities during transit. Moreover, the market caters to various industries, including pharmaceuticals, where temperature-sensitive medicines require temperature-controlled transportation. The integration of supply chain systems and construction costs, along with engineering improvements, have led to the increased adoption of reefer containers. The e-commerce sector's growth has also contributed to the market's expansion, as consumers increasingly demand fresh produce and other perishable goods delivered directly to their doors. Electrical components are a crucial aspect of reefer containers, as they power temperature control systems.
The market for these containers is expected to continue growing due to increasing demand for temperature-controlled transportation and advancements in electrical components and container design. Chemical industries also rely on reefer containers to transport their temperature-sensitive products. Overall, the reefer container market's growth is driven by the need for efficient and reliable transportation of perishable goods across long distances.
Get a glance at the market report of share of various segments Request Free Sample
The sea segment was valued at USD 3.28 billion in 2018 and showed a gradual increase during the forecast period.
Regional Analysis
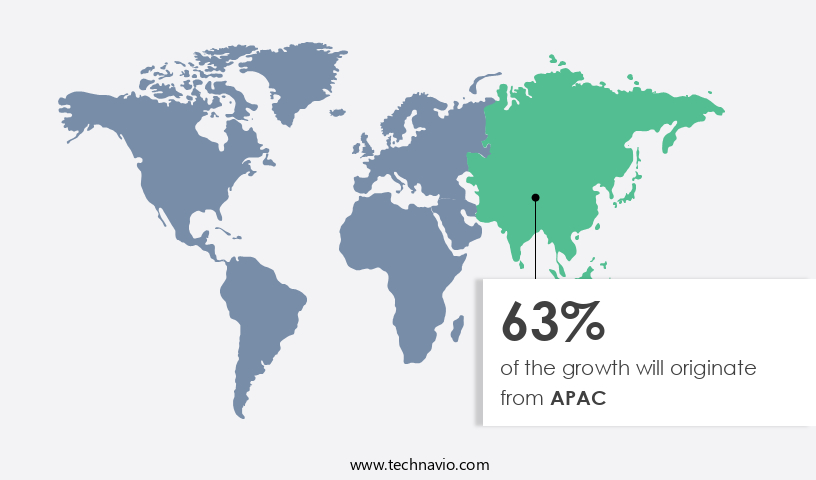
- APAC is estimated to contribute 63% to the growth of the global market during the forecast period.
Technavio's analysts have elaborately explained the regional trends and drivers that shape the market during the forecast period.
For more insights on the market share of various regions Request Free Sample
The Asia Pacific region plays a pivotal role in the market due to the high volume and value of temperature-sensitive goods transported via maritime trade. In India, the maritime sector is a vital component of the country's national trade and economic growth, with approximately 95% of trade by volume and 65% by value being conducted through seaborne transport. This significant reliance on sea transport underscores the importance of efficient and dependable reefer containers to preserve the quality and safety of perishable goods during transit. Reefer containers are essential for maintaining the integrity of temperature-sensitive commodities, including healthcare supplies for mass immunization campaigns and fresh food products.
These containers are equipped with temperature monitoring systems, insulation materials, and energy-efficient cooling to ensure consistent temperatures and prevent cargo failures caused by temperature fluctuations. The integration of Internet of Things (IoT) technology in reefer containers enables real-time temperature monitoring and remote control, enhancing the overall efficiency and reliability of the logistics process. As eCommerce continues to grow and the demand for fast and efficient last-mile delivery increases, the importance of reefer containers in ensuring the timely and high-quality delivery of temperature-sensitive goods becomes even more significant. In conclusion, the Asia Pacific region's extensive use of maritime transport for trade activities highlights the importance of reefer containers in maintaining the quality and safety of temperature-sensitive goods during transit.
Market Dynamics
Our researchers analyzed the data with 2023 as the base year, along with the key drivers, trends, and challenges. A holistic analysis of drivers will help companies refine their marketing strategies to gain a competitive advantage.
What are the key market drivers leading to the rise in adoption of Reefer Container Market?
The rising global food trade is the key driver of the market.
- The market experiences significant growth due to the increasing global trade in perishable goods, particularly agricultural food products. This trend signifies the expanding demand for efficient and reliable transportation solutions for temperature-sensitive items. From January 2019 to June 2023, the global merchandise trade for agricultural food products experienced a substantial increase of 40%. This significant growth highlights the importance of international food trade and the necessity for advanced cold chain logistics to preserve the quality and safety of perishable items during transit.
In addition to food products, the market is also driven by the rise of online grocery shopping and the transportation of temperature-controlled pharmaceutical drugs. Real-time tracking technology and the use of dual-temperature refrigerated containers ensure the safe and efficient transportation of biodegradable goods and other temperature-sensitive items. The market is expected to continue growing as the demand for reliable and efficient logistics infrastructure increases.
What are the market trends shaping the Reefer Container Market?
The adoption of sustainable global cold chains is the upcoming trend in the market.
- The market is experiencing a noteworthy transition towards sustainability, instigated by the emergence of innovative technologies that minimize environmental impact. This groundbreaking technology is instrumental in fostering the development of more eco-friendly global cold chains.
- The Star Cool 1.1 reefer features the climate-conscious refrigerant R1234yf, renowned for its minuscule global warming potential (GWP). This refrigerant plays a pivotal role in diminishing greenhouse gas emissions linked to conventional refrigerants, aligning with global initiatives to combat climate change.
What challenges does Reefer Container Market face during its growth?
Disruptions in supply chain is a key challenge affecting the market growth.
- The market faces substantial hurdles due to disruptions in the global supply chain, notably along the Red Sea, a vital trade connection between Asia, Africa, and Europe. Since the initial attack on an industrial vessel in 2023, security concerns have intensified, causing apprehension within the transportation, logistics, and supply chain industries. These disruptions have resulted in increased freight expenses, prolonged shipping durations, and the reemergence of the bullwhip effect, where minor demand shifts trigger larger fluctuations in supply chain orders. The ongoing Israel-Hamas conflict since October 2023 has intensified these challenges, posing a threat to broaden the disruption of commerce and provisions.
- In the context of the digital age, the Internet of Things (IoT) and Remote Container Management (RCM) systems have emerged as potential solutions to mitigate these issues. Global Positioning System (GPS) tracking in reefer containers enables real-time monitoring of their location and condition, ensuring optimal temperature maintenance for perishable goods such as food and pharmaceuticals. This visibility and control can help reduce freight costs, minimize shipping times, and enhance overall efficiency in the supply chain. In the US market, the demand for fresh food and pharmaceutical transportation remains strong, and implementing advanced container tracking and management systems is increasingly crucial.
Exclusive Customer Landscape
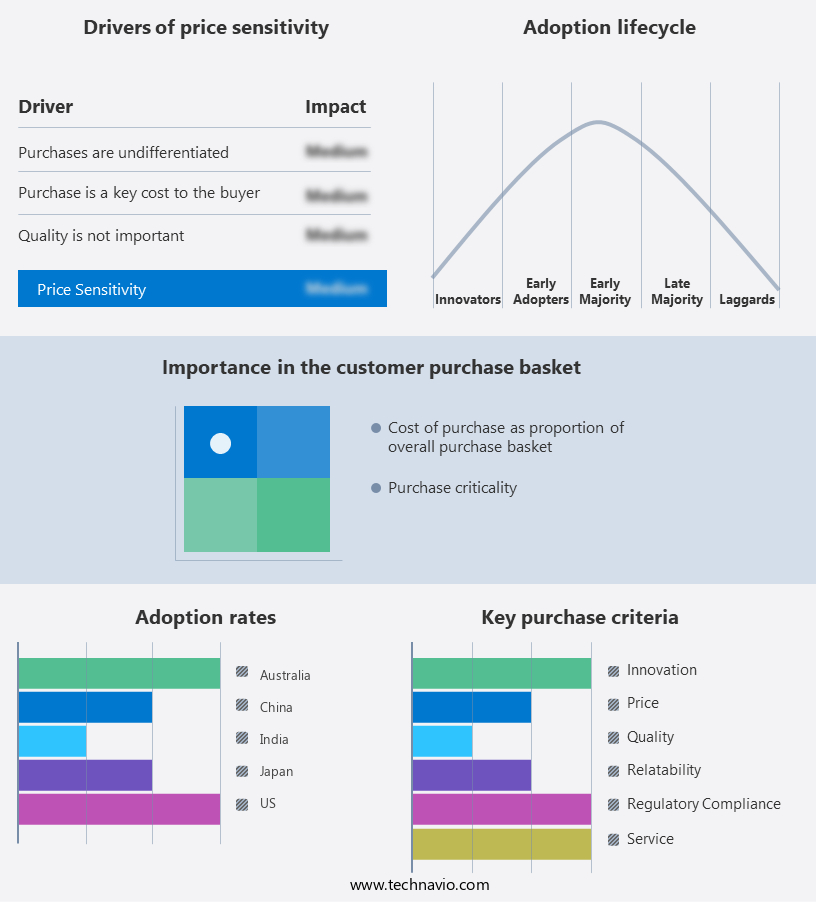
The market forecasting report includes the adoption lifecycle of the market, covering from the innovator's stage to the laggard's stage. It focuses on adoption rates in different regions based on penetration. Furthermore, the market report also includes key purchase criteria and drivers of price sensitivity to help companies evaluate and develop their market growth analysis strategies.
Customer Landscape
Key Companies & Market Insights
Companies are implementing various strategies, such as strategic alliances, market forecast, partnerships, mergers and acquisitions, geographical expansion, and product/service launches, to enhance their presence in the market. The market research and growth report includes detailed analyses of the competitive landscape of the market and information about key companies, including:
- AP Moller Maersk AS
- Carrier Global Corp.
- China International Marine Containers Group Ltd.
- CMA CGM SA Group
- Daikin Industries Ltd.
- Danteco Industries BV
- DSV AS
- Evergreen Marine Corp. Taiwan Ltd.
- Hapag Lloyd AG
- HYUNDAI TRANSLEAD
- Klinge Corp.
- MSC Mediterranean Shipping Co. SA
- NewPort Tank
- Ocean Network Express Pte. Ltd.
- SeaCube Container Leasing Ltd.
- Singamas Container Holdings Ltd.
- Trane Technologies Co. LLC
- Yang Ming Marine Transport Corp.
- ZIM Integrated Shipping Services Ltd.
Qualitative and quantitative analysis of companies has been conducted to help clients understand the wider business environment as well as the strengths and weaknesses of key market players. Data is qualitatively analyzed to categorize companies as pure play, category-focused, industry-focused, and diversified; it is quantitatively analyzed to categorize companies as dominant, leading, strong, tentative, and weak.
Research Analyst Overview
The market plays a crucial role in the transportation of temperature-sensitive goods, including food items and pharmaceutical products. These containers, also known as refrigerated containers, maintain specific temperature ranges to ensure the quality and safety of perishable goods during transit. The market is driven by the increasing demand for fresh foods, exotic foods, and temperature-sensitive medicines, such as vaccines and biologics. Reefer containers use various refrigeration systems, including diesel-powered generators, water-cooling systems, and redundant refrigeration systems, to maintain the required temperature. The market is witnessing significant transformation through engineering improvements, such as the integration of e-commerce and last-mile delivery, temperature monitoring systems, and insulation materials.
Furthermore, the market caters to various trade routes and transportation modes, including seaways, roadways, and railways. The market's growth is influenced by factors such as the construction costs of ports and maritime technology advancements. The market also benefits from the increasing demand for real-time tracking technology, IoT integration, and remote container management systems (RCM). Temperature-sensitive products, such as food, pharmaceutical drugs, and nutraceuticals, require a temperature-controlled environment during transportation. The market's growth is further driven by the increasing digital retail spending, online grocery shopping, and mass immunization campaigns. The use of dual-temperature refrigerated containers and electric field technology is also gaining popularity in the market.
|
Market Scope |
|
|
Report Coverage |
Details |
|
Page number |
207 |
|
Base year |
2023 |
|
Historic period |
2018-2022 |
|
Forecast period |
2024-2028 |
|
Growth momentum & CAGR |
Accelerate at a CAGR of 8.5% |
|
Market growth 2024-2028 |
USD 3.12 billion |
|
Market structure |
Fragmented |
|
YoY growth 2023-2024(%) |
7.5 |
|
Key countries |
China, US, Japan, India, Australia, Brazil, South Korea, Canada, Germany, and The Netherlands |
|
Competitive landscape |
Leading Companies, Market Positioning of Companies, Competitive Strategies, and Industry Risks |
What are the Key Data Covered in this Market Research and Growth Report?
- CAGR of the market during the forecast period
- Detailed information on factors that will drive the market growth and forecasting between 2024 and 2028
- Precise estimation of the size of the market and its contribution of the market in focus to the parent market
- Accurate predictions about upcoming market growth and trends and changes in consumer behaviour
- Growth of the market across APAC, North America, Europe, South America, and Middle East and Africa
- Thorough analysis of the market's competitive landscape and detailed information about companies
- Comprehensive analysis of factors that will challenge the growth of market companies
We can help! Our analysts can customize this market research report to meet your requirements. Get in touch
 RIA -
RIA - 
