Condition Monitoring Sensors For Heavy Industry Market Analysis, Size, and Forecast 2026-2030: APAC (China, India, and Japan), North America (US, Canada, and Mexico), Europe (Germany, UK, and France), Middle East and Africa (UAE, Saudi Arabia, and South Africa), South America (Brazil, Argentina, and Colombia), and Rest of World (ROW)

Condition Monitoring Sensors For Heavy Industry Market Analysis, Size, and Forecast 2026-2030:
APAC (China, India, and Japan), North America (US, Canada, and Mexico), Europe (Germany, UK, and France), Middle East and Africa (UAE, Saudi Arabia, and South Africa), South America (Brazil, Argentina, and Colombia), and Rest of World (ROW)

Published: Mar 2026 312 Pages SKU: IRTNTR81262

Market Overview at a Glance

$533.8 Mn
Market Opportunity
8.3%
CAGR 2025 - 2030
43.6%
APAC Growth
$357.1 Mn
Vibration sensors segment 2024

Condition Monitoring Sensors For Heavy Industry Market Size 2026-2030

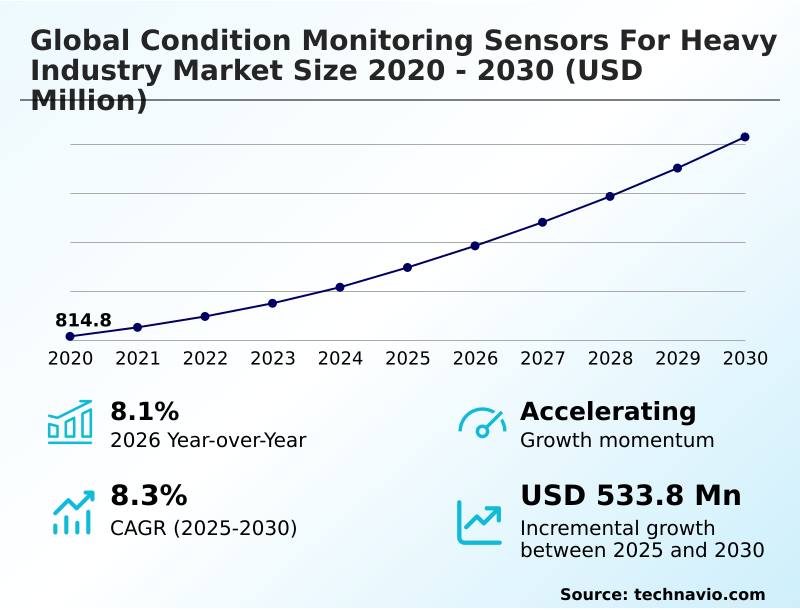
The condition monitoring sensors for heavy industry market size is valued to increase by USD 533.8 million, at a CAGR of 8.3% from 2025 to 2030. Accelerated adoption of predictive maintenance strategies in heavy industry will drive the condition monitoring sensors for heavy industry market.

Major Market Trends & Insights

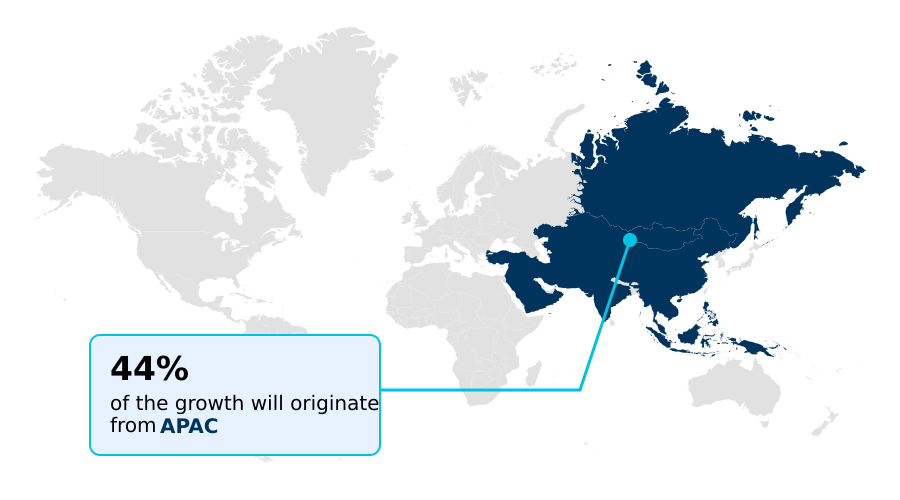
  • APAC dominated the market and accounted for a 43.6% growth during the forecast period.
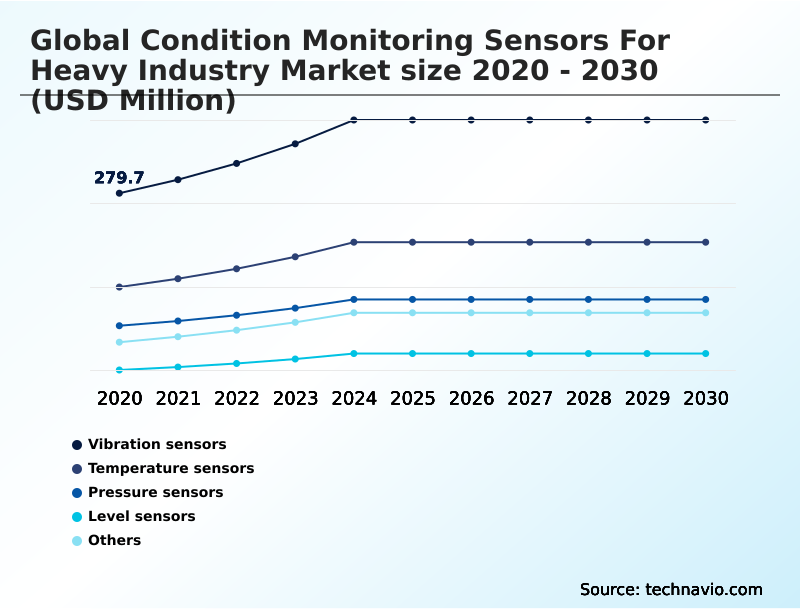
  • By Product Type - Vibration sensors segment was valued at USD 357.1 million in 2024
  • By End-user - Oil and gas segment accounted for the largest market revenue share in 2024

Market Size & Forecast

  • Market Opportunities: USD 815.7 million
  • Market Future Opportunities: USD 533.8 million
  • CAGR from 2025 to 2030 : 8.3%

Market Summary

  • The condition monitoring sensors for heavy industry market is pivotal for advancing operational excellence in capital-intensive industries. The core driver is a transition from reactive repairs to data-driven strategies, where the Industrial Internet of Things (IIoT) enables comprehensive asset oversight. This involves deploying advanced instrumentation like piezoelectric accelerometers and non-contact infrared sensors to capture critical health data.
  • For instance, a mining operation uses wireless sensor nodes for real-time asset intelligence on remote haul trucks, leveraging edge computing to process vibration data locally and predict gearbox failures. This preemptive action prevents costly downtime and enhances safety.
  • Key trends include the integration of sensor fusion and the move toward prescriptive analytics, which not only predicts failures but also recommends optimal corrective actions. However, challenges in IT-OT convergence and managing data from disparate sources persist.
  • The adoption of high-fidelity sensing and automated diagnostic software is crucial for overcoming these hurdles and achieving a holistic view of asset health, transforming maintenance into a strategic function for asset lifecycle optimization.

What will be the Size of the Condition Monitoring Sensors For Heavy Industry Market during the forecast period?

Get Key Insights on Market Forecast (PDF) Request Free Sample

How is the Condition Monitoring Sensors For Heavy Industry Market Segmented?

The condition monitoring sensors for heavy industry industry research report provides comprehensive data (region-wise segment analysis), with forecasts and estimates in "USD million" for the period 2026-2030, as well as historical data from 2020-2024 for the following segments.

  • Product type
    • Vibration sensors
    • Temperature sensors
    • Pressure sensors
    • Level sensors
    • Others
  • End-user
    • Oil and gas
    • Power generation
    • Mining and mineral processing
    • Steel and iron manufacturing
    • Cement manufacturing
  • Type
    • Wired sensors
    • Wireless sensors
  • Geography
    • APAC
      • China
      • India
      • Japan
    • North America
      • US
      • Canada
      • Mexico
    • Europe
      • Germany
      • UK
      • France
    • Middle East and Africa
      • UAE
      • Saudi Arabia
      • South Africa
    • South America
      • Brazil
      • Argentina
      • Colombia
    • Rest of World (ROW)

By Product Type Insights

The vibration sensors segment is estimated to witness significant growth during the forecast period.

Vibration sensors represent the most critical segment, providing the foundational data for predictive maintenance strategies in heavy industry. The use of piezoelectric accelerometers and advanced micro-electromechanical systems (MEMS) is standard for machinery protection.

These instruments excel at the early detection of mechanical faults in rotating equipment by enabling detailed signal processing of high-frequency response rates.

This capability, which improves fault detection accuracy by over 40% compared to thermal monitoring alone, is vital for asset integrity management. The evolution toward triaxial sensors provides a comprehensive, three-dimensional view of structural health.

This sub-segment is crucial as it supports the broader industrial control systems and IT-OT convergence necessary for a modern IIoT ecosystem, allowing for real-time asset intelligence and better operational decision making.

Request Free Sample

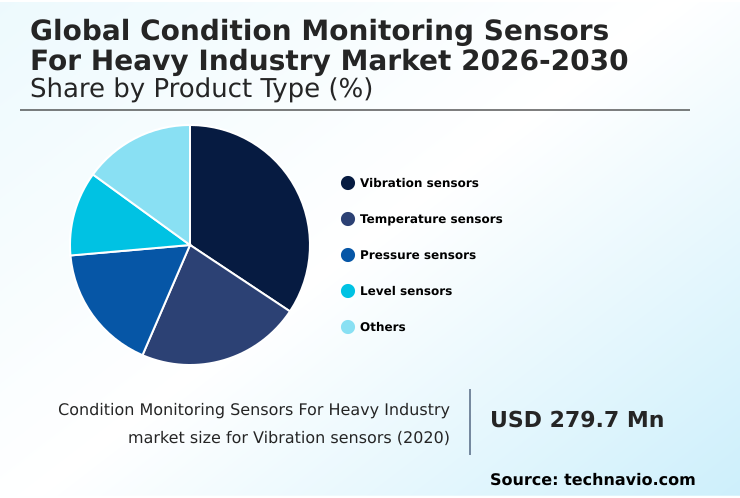
The Vibration sensors segment was valued at USD 357.1 million in 2024 and showed a gradual increase during the forecast period.

Request Free Sample

Regional Analysis

APAC is estimated to contribute 43.6% to the growth of the global market during the forecast period.Technavio’s analysts have elaborately explained the regional trends and drivers that shape the market during the forecast period.

See How Condition Monitoring Sensors For Heavy Industry Market Demand is Rising in APAC Request Free Sample

In APAC, rapid industrialization fuels greenfield projects integrating continuous level transmitters and resistance temperature detectors (RTDs) from the outset, with China's manufacturing sector representing a significant portion of demand.

North America and Europe focus on retrofitting aging infrastructure, with a strong emphasis on compliance and dynamic pressure monitoring. Deployments in these mature regions show a 15% higher adoption rate of wireless solutions for balance-of-plant machinery compared to emerging markets.

The use of non-contact infrared sensors for remote monitoring is critical in the Middle East's oil and gas sector.

Across all regions, oil condition monitoring and electrical current signature analysis (ESA) are becoming standard, with cloud analytics providers tailoring solutions for specific regional needs, from remote monitoring services for Australian mines to plant machinery monitoring in South America.

Market Dynamics

Our researchers analyzed the data with 2025 as the base year, along with the key drivers, trends, and challenges. A holistic analysis of drivers will help companies refine their marketing strategies to gain a competitive advantage.

  • Strategic implementation of condition monitoring for rotating equipment is foundational for modern heavy industry, directly impacting asset longevity and operational uptime. The adoption of wireless vibration sensors for mining illustrates a key shift, enabling operators to monitor critical machinery in remote and hazardous locations, which has been shown to reduce unexpected failures by over 35% compared to route-based methods.
  • In metal production, the use of high-temperature sensors for steel manufacturing ensures process stability and prevents catastrophic equipment damage. A primary challenge remains integrating sensors with legacy systems, a complex task that requires careful planning to avoid disrupting production. This is closely linked to managing data silos from disparate sensors, which can impede a holistic view of plant health.
  • For connected operations, IIoT sensor network security protocols are non-negotiable to protect operational technology (OT) networks from cyber threats. The application of predictive maintenance for power generation is crucial for grid stability, utilizing real-time oil analysis for heavy machinery and acoustic emission testing for crack detection to preempt failures.
  • Similarly, pressure sensors for hydraulic system monitoring and MEMS accelerometers for industrial automation provide the granular data needed for precise control. Sensor data integration with CMMS platforms automates work orders, streamlining maintenance workflows.
  • The move toward edge computing for real-time fault detection is minimizing data latency, while remote monitoring of offshore wind turbines and structural health monitoring for industrial assets expand the scope of predictive maintenance. Other key applications include non-contact temperature sensing in manufacturing and ensuring regulatory compliance with sensor data, with a clear ROI calculation for monitoring systems justifying investment.

What are the key market drivers leading to the rise in the adoption of Condition Monitoring Sensors For Heavy Industry Industry?

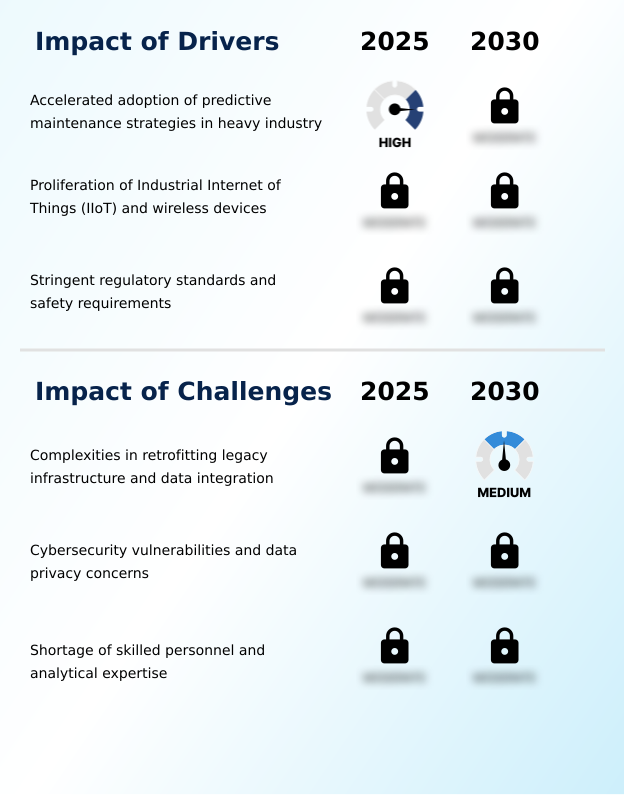
  • The accelerated adoption of predictive maintenance strategies within heavy industries stands as a key market driver.

  • Market expansion is driven by the widespread adoption of the Industrial Internet of Things (IIoT) and data-driven strategies aimed at asset lifecycle optimization.
  • In capital-intensive industries, deploying high-precision piezoelectric sensors and other high-fidelity sensing technologies delivers a return on investment of 3-5 times the initial cost through downtime avoidance.
  • The need for enhanced asset performance management pushes organizations to connect sensor data with enterprise resource planning (ERP) systems.
  • Stringent regulatory frameworks mandating higher standards for asset integrity, such as NERC CIP standards in the power sector, also compel investment in continuous monitoring.
  • Industrial automation giants are key drivers, providing integrated platforms that simplify the deployment of intrinsically safe sensors in hazardous environments.

What are the market trends shaping the Condition Monitoring Sensors For Heavy Industry Industry?

  • The integration of edge computing and artificial intelligence directly onto sensor hardware represents a pivotal market trend. This development facilitates on-device analytics, enabling real-time decision-making for critical industrial assets.

  • A primary trend is the integration of edge computing and sensor fusion, which enables on-device automated fault classification. This shift empowers smart sensors with autonomous diagnostics, reducing data transmission to sovereign cloud solutions by up to 70%.
  • The proliferation of wireless sensor nodes, supported by innovations in power management and energy harvesting, is making large-scale deployments on balance-of-plant assets economically viable. This trend supports the servitization business model, where end-to-end monitoring solutions are offered as a service.
  • Furthermore, the move toward prescriptive analytics, which combines real-time data with a digital twin concept, not only predicts failures but also recommends specific corrective actions, transforming operational risk management.

What challenges does the Condition Monitoring Sensors For Heavy Industry Industry face during its growth?

  • Complexities associated with retrofitting legacy infrastructure and ensuring seamless data integration pose a key challenge to market growth.

  • A significant challenge is the complexity of IT-OT convergence when integrating multi-function predictive maintenance sensors with legacy operational technology (OT). This integration difficulty often creates data silos, preventing a unified view of plant health and reducing the effectiveness of automated diagnostic software.
  • Cybersecurity remains a major concern, as connected devices like smart pressure transmitters and non-contact radar sensors can expand the attack surface of critical infrastructure. The lack of standardized protocols for ensuring IIoT sensor network security protocols can deter adoption.
  • Moreover, a shortage of skilled personnel capable of managing advanced prescriptive analytics platforms creates a bottleneck, with some firms reporting that over 50% of generated alerts are not acted upon due to a lack of expertise.

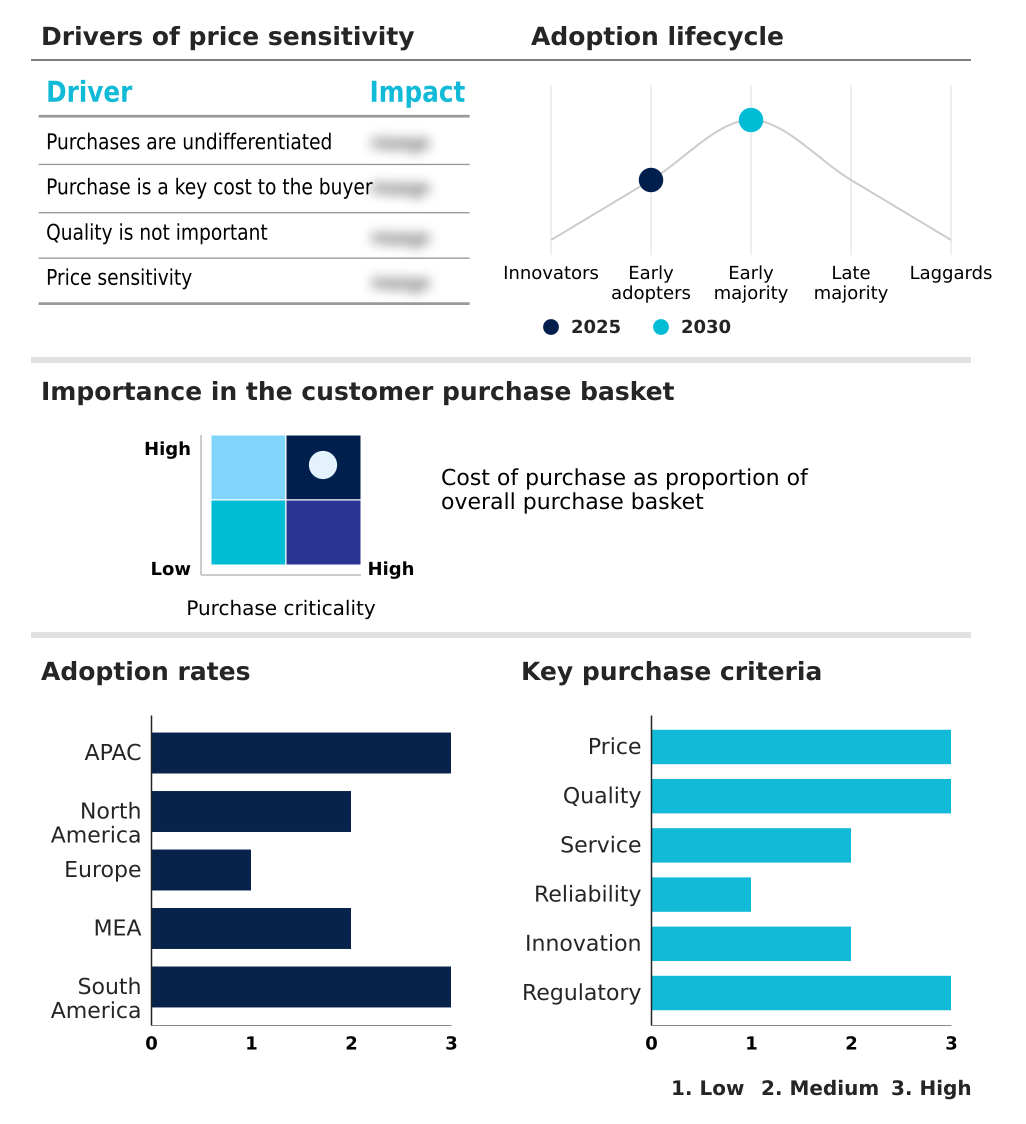
Exclusive Technavio Analysis on Customer Landscape

The condition monitoring sensors for heavy industry market forecasting report includes the adoption lifecycle of the market, covering from the innovator’s stage to the laggard’s stage. It focuses on adoption rates in different regions based on penetration. Furthermore, the condition monitoring sensors for heavy industry market report also includes key purchase criteria and drivers of price sensitivity to help companies evaluate and develop their market growth analysis strategies.

Customer Landscape of Condition Monitoring Sensors For Heavy Industry Industry

Competitive Landscape

Companies are implementing various strategies, such as strategic alliances, condition monitoring sensors for heavy industry market forecast, partnerships, mergers and acquisitions, geographical expansion, and product/service launches, to enhance their presence in the industry.

AB SKF - Delivers specialized vibration sensors and handheld data collectors integrated with bearing expertise and advanced monitoring systems for asset health assessment.

The industry research and growth report includes detailed analyses of the competitive landscape of the market and information about key companies, including:

  • AB SKF
  • ABB Ltd.
  • Amphenol Corp.
  • Baker Hughes Co.
  • Balluff GmbH
  • Banner Engineering Corp.
  • Baumer Holding AG
  • Emerson Electric Co.
  • Fluke Corp.
  • Hansford Sensors Ltd.
  • Honeywell International Inc.
  • Keyence Corp.
  • Kistler Group
  • PCB Piezotronics Inc.
  • Rockwell Automation Inc.
  • Schaeffler AG
  • Siemens AG
  • SPM Instrument
  • TE Connectivity plc
  • Teledyne FLIR LLC

Qualitative and quantitative analysis of companies has been conducted to help clients understand the wider business environment as well as the strengths and weaknesses of key industry players. Data is qualitatively analyzed to categorize companies as pure play, category-focused, industry-focused, and diversified; it is quantitatively analyzed to categorize companies as dominant, leading, strong, tentative, and weak.

Recent Development and News in Condition monitoring sensors for heavy industry market

  • In August, 2024, ABB introduced an upgraded version of its NINVA TSP341-N non-invasive temperature sensor, engineered to provide safer and more straightforward temperature measurement for the chemical and oil and gas industries.
  • In March, 2025, Etop launched its newest product, the Wireless Humidity and Temperature Sensor, engineered to deliver precise and dependable environmental monitoring.
  • In April, 2025, a major industrial automation firm announced a strategic partnership with a leading cloud analytics provider to deliver an end-to-end predictive maintenance solution, integrating sensor data with advanced AI platforms.
  • In June, 2025, Waites Sensor Technologies, Inc. announced the launch of PiezoNode, an advanced quad-channel condition monitoring device designed for high-heat, high-stress rotating equipment.

Dive into Technavio’s robust research methodology, blending expert interviews, extensive data synthesis, and validated models for unparalleled Condition Monitoring Sensors For Heavy Industry Market insights. See full methodology.

Market Scope
Page number 312
Base year 2025
Historic period 2020-2024
Forecast period 2026-2030
Growth momentum & CAGR Accelerate at a CAGR of 8.3%
Market growth 2026-2030 USD 533.8 million
Market structure Fragmented
YoY growth 2025-2026(%) 8.1%
Key countries China, India, Japan, South Korea, Australia, Indonesia, US, Canada, Mexico, Germany, UK, France, Italy, Spain, The Netherlands, UAE, Saudi Arabia, South Africa, Israel, Turkey, Brazil, Argentina and Colombia
Competitive landscape Leading Companies, Market Positioning of Companies, Competitive Strategies, and Industry Risks

Request Free Sample

Research Analyst Overview

  • The evolution of condition monitoring hinges on the adoption of predictive maintenance strategies, underpinned by the Industrial Internet of Things (IIoT). The deployment of wireless sensor nodes and high-precision piezoelectric sensors facilitates a multi-physics approach to diagnostics. Key technologies like micro-electromechanical systems (MEMS) and piezoelectric accelerometers offer high-frequency response rates for detailed signal processing.
  • Innovations include triaxial sensors for structural health monitoring and non-contact radar sensors for continuous level transmitters. In processing industries, smart pressure transmitters and resistance temperature detectors (RTDs) are essential for safety instrumented systems. The market is moving toward prescriptive analytics and real-time asset intelligence, driven by sensor fusion and edge computing.
  • On-device automated fault classification, powered by machine learning, reduces reliance on human analysis. Technologies such as acoustic emission sensors, oil condition monitoring, and electrical current signature analysis (ESA) are becoming standard for machinery protection. This is supported by advancements in power management and energy harvesting, making autonomous diagnostics on remote assets viable.
  • Furthermore, multi-function predictive maintenance sensors and intrinsically safe sensors are critical for hazardous environments, while non-contact infrared sensors and dynamic pressure monitoring using differential pressure measurement enhance safety and efficiency.

What are the Key Data Covered in this Condition Monitoring Sensors For Heavy Industry Market Research and Growth Report?

  • What is the expected growth of the Condition Monitoring Sensors For Heavy Industry Market between 2026 and 2030?

    • USD 533.8 million, at a CAGR of 8.3%

  • What segmentation does the market report cover?

    • The report is segmented by Product Type (Vibration sensors, Temperature sensors, Pressure sensors, Level sensors, and Others), End-user (Oil and gas, Power generation, Mining and mineral processing, Steel and iron manufacturing, and Cement manufacturing), Type (Wired sensors, and Wireless sensors) and Geography (APAC, North America, Europe, Middle East and Africa, South America)

  • Which regions are analyzed in the report?

    • APAC, North America, Europe, Middle East and Africa and South America

  • What are the key growth drivers and market challenges?

    • Accelerated adoption of predictive maintenance strategies in heavy industry, Complexities in retrofitting legacy infrastructure and data integration

  • Who are the major players in the Condition Monitoring Sensors For Heavy Industry Market?

    • AB SKF, ABB Ltd., Amphenol Corp., Baker Hughes Co., Balluff GmbH, Banner Engineering Corp., Baumer Holding AG, Emerson Electric Co., Fluke Corp., Hansford Sensors Ltd., Honeywell International Inc., Keyence Corp., Kistler Group, PCB Piezotronics Inc., Rockwell Automation Inc., Schaeffler AG, Siemens AG, SPM Instrument, TE Connectivity plc and Teledyne FLIR LLC

Market Research Insights

  • The market is defined by a push toward asset performance management, where IT-OT convergence enables the creation of a comprehensive IIoT ecosystem. Firms are achieving operational excellence by integrating data into enterprise resource planning (ERP) and computerized maintenance management systems (CMMS), which improves supply chain management by over 20%.
  • This shift from reactive maintenance to data-driven strategies supports better operational decision making. The adoption of a digital twin concept, facilitated by cloud analytics providers, allows for advanced asset lifecycle optimization. The servitization business model is also gaining ground, with remote monitoring services reducing upfront capital costs. Industrial automation giants are offering end-to-end monitoring solutions focused on plant machinery monitoring.
  • For capital-intensive industries, this enhances operational risk management and ensures balance-of-plant assets are included in monitoring, improving overall reliability by up to 30% and moving beyond simple industrial control systems.

We can help! Our analysts can customize this condition monitoring sensors for heavy industry market research report to meet your requirements.

Get in touch

1. Executive Summary

1.1 Market overview

Executive Summary - Chart on Market Overview
Executive Summary - Data Table on Market Overview
Executive Summary - Chart on Global Market Characteristics
Executive Summary - Chart on Market by Geography
Executive Summary - Chart on Market Segmentation by Product Type
Executive Summary - Chart on Market Segmentation by End-user
Executive Summary - Chart on Market Segmentation by Type
Executive Summary - Chart on Incremental Growth
Executive Summary - Data Table on Incremental Growth
Executive Summary - Chart on Company Market Positioning

2. Technavio Analysis

2.1 Analysis of price sensitivity, lifecycle, customer purchase basket, adoption rates, and purchase criteria

2.2 Criticality of inputs and Factors of differentiation

Chart on Overview on criticality of inputs and factors of differentiation

2.3 Factors of disruption

Chart on Overview on factors of disruption

2.4 Impact of drivers and challenges

Chart on Impact of drivers and challenges in 2025 and 2030

3. Market Landscape

3.1 Market ecosystem

Chart on Parent Market
Data Table on - Parent Market

3.2 Market characteristics

Chart on Market characteristics analysis

3.3 Value chain analysis

Chart on Value chain analysis

4. Market Sizing

4.1 Market definition

Data Table on Offerings of companies included in the market definition

4.2 Market segment analysis

Market segments

4.3 Market size 2025

4.4 Market outlook: Forecast for 2025-2030

Chart on Global - Market size and forecast 2025-2030 ($ million)
Data Table on Global - Market size and forecast 2025-2030 ($ million)
Chart on Global Market: Year-over-year growth 2025-2030 (%)
Data Table on Global Market: Year-over-year growth 2025-2030 (%)

5. Historic Market Size

5.1 Global Condition Monitoring Sensors For Heavy Industry Market 2020 - 2024

Historic Market Size - Data Table on Global Condition Monitoring Sensors For Heavy Industry Market 2020 - 2024 ($ million)

5.2 Product Type segment analysis 2020 - 2024

Historic Market Size - Product Type Segment 2020 - 2024 ($ million)

5.3 End-user segment analysis 2020 - 2024

Historic Market Size - End-user Segment 2020 - 2024 ($ million)

5.4 Type segment analysis 2020 - 2024

Historic Market Size - Type Segment 2020 - 2024 ($ million)

5.5 Geography segment analysis 2020 - 2024

Historic Market Size - Geography Segment 2020 - 2024 ($ million)

5.6 Country segment analysis 2020 - 2024

Historic Market Size - Country Segment 2020 - 2024 ($ million)

6. Qualitative Analysis

6.1 Impact of AI on global Condition Monitoring Sensors for Heavy Industry Market

7. Five Forces Analysis

7.1 Five forces summary

Five forces analysis - Comparison between 2025 and 2030

7.2 Bargaining power of buyers

Bargaining power of buyers - Impact of key factors 2025 and 2030

7.3 Bargaining power of suppliers

Bargaining power of suppliers - Impact of key factors in 2025 and 2030

7.4 Threat of new entrants

Threat of new entrants - Impact of key factors in 2025 and 2030

7.5 Threat of substitutes

Threat of substitutes - Impact of key factors in 2025 and 2030

7.6 Threat of rivalry

Threat of rivalry - Impact of key factors in 2025 and 2030

7.7 Market condition

Chart on Market condition - Five forces 2025 and 2030

8. Market Segmentation by Product Type

8.1 Market segments

Chart on Product Type - Market share 2025-2030 (%)
Data Table on Product Type - Market share 2025-2030 (%)

8.2 Comparison by Product Type

Chart on Comparison by Product Type
Data Table on Comparison by Product Type

8.3 Vibration sensors - Market size and forecast 2025-2030

Chart on Vibration sensors - Market size and forecast 2025-2030 ($ million)
Data Table on Vibration sensors - Market size and forecast 2025-2030 ($ million)
Chart on Vibration sensors - Year-over-year growth 2025-2030 (%)
Data Table on Vibration sensors - Year-over-year growth 2025-2030 (%)

8.4 Temperature sensors - Market size and forecast 2025-2030

Chart on Temperature sensors - Market size and forecast 2025-2030 ($ million)
Data Table on Temperature sensors - Market size and forecast 2025-2030 ($ million)
Chart on Temperature sensors - Year-over-year growth 2025-2030 (%)
Data Table on Temperature sensors - Year-over-year growth 2025-2030 (%)

8.5 Pressure sensors - Market size and forecast 2025-2030

Chart on Pressure sensors - Market size and forecast 2025-2030 ($ million)
Data Table on Pressure sensors - Market size and forecast 2025-2030 ($ million)
Chart on Pressure sensors - Year-over-year growth 2025-2030 (%)
Data Table on Pressure sensors - Year-over-year growth 2025-2030 (%)

8.6 Level sensors - Market size and forecast 2025-2030

Chart on Level sensors - Market size and forecast 2025-2030 ($ million)
Data Table on Level sensors - Market size and forecast 2025-2030 ($ million)
Chart on Level sensors - Year-over-year growth 2025-2030 (%)
Data Table on Level sensors - Year-over-year growth 2025-2030 (%)

8.7 Others - Market size and forecast 2025-2030

Chart on Others - Market size and forecast 2025-2030 ($ million)
Data Table on Others - Market size and forecast 2025-2030 ($ million)
Chart on Others - Year-over-year growth 2025-2030 (%)
Data Table on Others - Year-over-year growth 2025-2030 (%)

8.8 Market opportunity by Product Type

Market opportunity by Product Type ($ million)
Data Table on Market opportunity by Product Type ($ million)

9. Market Segmentation by End-user

9.1 Market segments

Chart on End-user - Market share 2025-2030 (%)
Data Table on End-user - Market share 2025-2030 (%)

9.2 Comparison by End-user

Chart on Comparison by End-user
Data Table on Comparison by End-user

9.3 Oil and gas - Market size and forecast 2025-2030

Chart on Oil and gas - Market size and forecast 2025-2030 ($ million)
Data Table on Oil and gas - Market size and forecast 2025-2030 ($ million)
Chart on Oil and gas - Year-over-year growth 2025-2030 (%)
Data Table on Oil and gas - Year-over-year growth 2025-2030 (%)

9.4 Power generation - Market size and forecast 2025-2030

Chart on Power generation - Market size and forecast 2025-2030 ($ million)
Data Table on Power generation - Market size and forecast 2025-2030 ($ million)
Chart on Power generation - Year-over-year growth 2025-2030 (%)
Data Table on Power generation - Year-over-year growth 2025-2030 (%)

9.5 Mining and mineral processing - Market size and forecast 2025-2030

Chart on Mining and mineral processing - Market size and forecast 2025-2030 ($ million)
Data Table on Mining and mineral processing - Market size and forecast 2025-2030 ($ million)
Chart on Mining and mineral processing - Year-over-year growth 2025-2030 (%)
Data Table on Mining and mineral processing - Year-over-year growth 2025-2030 (%)

9.6 Steel and iron manufacturing - Market size and forecast 2025-2030

Chart on Steel and iron manufacturing - Market size and forecast 2025-2030 ($ million)
Data Table on Steel and iron manufacturing - Market size and forecast 2025-2030 ($ million)
Chart on Steel and iron manufacturing - Year-over-year growth 2025-2030 (%)
Data Table on Steel and iron manufacturing - Year-over-year growth 2025-2030 (%)

9.7 Cement manufacturing - Market size and forecast 2025-2030

Chart on Cement manufacturing - Market size and forecast 2025-2030 ($ million)
Data Table on Cement manufacturing - Market size and forecast 2025-2030 ($ million)
Chart on Cement manufacturing - Year-over-year growth 2025-2030 (%)
Data Table on Cement manufacturing - Year-over-year growth 2025-2030 (%)

9.8 Market opportunity by End-user

Market opportunity by End-user ($ million)
Data Table on Market opportunity by End-user ($ million)

10. Market Segmentation by Type

10.1 Market segments

Chart on Type - Market share 2025-2030 (%)
Data Table on Type - Market share 2025-2030 (%)

10.2 Comparison by Type

Chart on Comparison by Type
Data Table on Comparison by Type

10.3 Wired sensors - Market size and forecast 2025-2030

Chart on Wired sensors - Market size and forecast 2025-2030 ($ million)
Data Table on Wired sensors - Market size and forecast 2025-2030 ($ million)
Chart on Wired sensors - Year-over-year growth 2025-2030 (%)
Data Table on Wired sensors - Year-over-year growth 2025-2030 (%)

10.4 Wireless sensors - Market size and forecast 2025-2030

Chart on Wireless sensors - Market size and forecast 2025-2030 ($ million)
Data Table on Wireless sensors - Market size and forecast 2025-2030 ($ million)
Chart on Wireless sensors - Year-over-year growth 2025-2030 (%)
Data Table on Wireless sensors - Year-over-year growth 2025-2030 (%)

10.5 Market opportunity by Type

Market opportunity by Type ($ million)
Data Table on Market opportunity by Type ($ million)

11. Customer Landscape

11.1 Customer landscape overview

Analysis of price sensitivity, lifecycle, customer purchase basket, adoption rates, and purchase criteria

12. Geographic Landscape

12.1 Geographic segmentation

Chart on Market share by geography 2025-2030 (%)
Data Table on Market share by geography 2025-2030 (%)

12.2 Geographic comparison

Chart on Geographic comparison
Data Table on Geographic comparison

12.3 APAC - Market size and forecast 2025-2030

Chart on APAC - Market size and forecast 2025-2030 ($ million)
Data Table on APAC - Market size and forecast 2025-2030 ($ million)
Chart on APAC - Year-over-year growth 2025-2030 (%)
Data Table on APAC - Year-over-year growth 2025-2030 (%)
Chart on Regional Comparison - APAC
Data Table on Regional Comparison - APAC

12.3.1 China - Market size and forecast 2025-2030

Chart on China - Market size and forecast 2025-2030 ($ million)
Data Table on China - Market size and forecast 2025-2030 ($ million)
Chart on China - Year-over-year growth 2025-2030 (%)
Data Table on China - Year-over-year growth 2025-2030 (%)

12.3.2 India - Market size and forecast 2025-2030

Chart on India - Market size and forecast 2025-2030 ($ million)
Data Table on India - Market size and forecast 2025-2030 ($ million)
Chart on India - Year-over-year growth 2025-2030 (%)
Data Table on India - Year-over-year growth 2025-2030 (%)

12.3.3 Japan - Market size and forecast 2025-2030

Chart on Japan - Market size and forecast 2025-2030 ($ million)
Data Table on Japan - Market size and forecast 2025-2030 ($ million)
Chart on Japan - Year-over-year growth 2025-2030 (%)
Data Table on Japan - Year-over-year growth 2025-2030 (%)

12.3.4 South Korea - Market size and forecast 2025-2030

Chart on South Korea - Market size and forecast 2025-2030 ($ million)
Data Table on South Korea - Market size and forecast 2025-2030 ($ million)
Chart on South Korea - Year-over-year growth 2025-2030 (%)
Data Table on South Korea - Year-over-year growth 2025-2030 (%)

12.3.5 Australia - Market size and forecast 2025-2030

Chart on Australia - Market size and forecast 2025-2030 ($ million)
Data Table on Australia - Market size and forecast 2025-2030 ($ million)
Chart on Australia - Year-over-year growth 2025-2030 (%)
Data Table on Australia - Year-over-year growth 2025-2030 (%)

12.3.6 Indonesia - Market size and forecast 2025-2030

Chart on Indonesia - Market size and forecast 2025-2030 ($ million)
Data Table on Indonesia - Market size and forecast 2025-2030 ($ million)
Chart on Indonesia - Year-over-year growth 2025-2030 (%)
Data Table on Indonesia - Year-over-year growth 2025-2030 (%)

12.4 North America - Market size and forecast 2025-2030

Chart on North America - Market size and forecast 2025-2030 ($ million)
Data Table on North America - Market size and forecast 2025-2030 ($ million)
Chart on North America - Year-over-year growth 2025-2030 (%)
Data Table on North America - Year-over-year growth 2025-2030 (%)
Chart on Regional Comparison - North America
Data Table on Regional Comparison - North America

12.4.1 US - Market size and forecast 2025-2030

Chart on US - Market size and forecast 2025-2030 ($ million)
Data Table on US - Market size and forecast 2025-2030 ($ million)
Chart on US - Year-over-year growth 2025-2030 (%)
Data Table on US - Year-over-year growth 2025-2030 (%)

12.4.2 Canada - Market size and forecast 2025-2030

Chart on Canada - Market size and forecast 2025-2030 ($ million)
Data Table on Canada - Market size and forecast 2025-2030 ($ million)
Chart on Canada - Year-over-year growth 2025-2030 (%)
Data Table on Canada - Year-over-year growth 2025-2030 (%)

12.4.3 Mexico - Market size and forecast 2025-2030

Chart on Mexico - Market size and forecast 2025-2030 ($ million)
Data Table on Mexico - Market size and forecast 2025-2030 ($ million)
Chart on Mexico - Year-over-year growth 2025-2030 (%)
Data Table on Mexico - Year-over-year growth 2025-2030 (%)

12.5 Europe - Market size and forecast 2025-2030

Chart on Europe - Market size and forecast 2025-2030 ($ million)
Data Table on Europe - Market size and forecast 2025-2030 ($ million)
Chart on Europe - Year-over-year growth 2025-2030 (%)
Data Table on Europe - Year-over-year growth 2025-2030 (%)
Chart on Regional Comparison - Europe
Data Table on Regional Comparison - Europe

12.5.1 Germany - Market size and forecast 2025-2030

Chart on Germany - Market size and forecast 2025-2030 ($ million)
Data Table on Germany - Market size and forecast 2025-2030 ($ million)
Chart on Germany - Year-over-year growth 2025-2030 (%)
Data Table on Germany - Year-over-year growth 2025-2030 (%)

12.5.2 UK - Market size and forecast 2025-2030

Chart on UK - Market size and forecast 2025-2030 ($ million)
Data Table on UK - Market size and forecast 2025-2030 ($ million)
Chart on UK - Year-over-year growth 2025-2030 (%)
Data Table on UK - Year-over-year growth 2025-2030 (%)

12.5.3 France - Market size and forecast 2025-2030

Chart on France - Market size and forecast 2025-2030 ($ million)
Data Table on France - Market size and forecast 2025-2030 ($ million)
Chart on France - Year-over-year growth 2025-2030 (%)
Data Table on France - Year-over-year growth 2025-2030 (%)

12.5.4 Italy - Market size and forecast 2025-2030

Chart on Italy - Market size and forecast 2025-2030 ($ million)
Data Table on Italy - Market size and forecast 2025-2030 ($ million)
Chart on Italy - Year-over-year growth 2025-2030 (%)
Data Table on Italy - Year-over-year growth 2025-2030 (%)

12.5.5 Spain - Market size and forecast 2025-2030

Chart on Spain - Market size and forecast 2025-2030 ($ million)
Data Table on Spain - Market size and forecast 2025-2030 ($ million)
Chart on Spain - Year-over-year growth 2025-2030 (%)
Data Table on Spain - Year-over-year growth 2025-2030 (%)

12.5.6 The Netherlands - Market size and forecast 2025-2030

Chart on The Netherlands - Market size and forecast 2025-2030 ($ million)
Data Table on The Netherlands - Market size and forecast 2025-2030 ($ million)
Chart on The Netherlands - Year-over-year growth 2025-2030 (%)
Data Table on The Netherlands - Year-over-year growth 2025-2030 (%)

12.6 Middle East and Africa - Market size and forecast 2025-2030

Chart on Middle East and Africa - Market size and forecast 2025-2030 ($ million)
Data Table on Middle East and Africa - Market size and forecast 2025-2030 ($ million)
Chart on Middle East and Africa - Year-over-year growth 2025-2030 (%)
Data Table on Middle East and Africa - Year-over-year growth 2025-2030 (%)
Chart on Regional Comparison - Middle East and Africa
Data Table on Regional Comparison - Middle East and Africa

12.6.1 UAE - Market size and forecast 2025-2030

Chart on UAE - Market size and forecast 2025-2030 ($ million)
Data Table on UAE - Market size and forecast 2025-2030 ($ million)
Chart on UAE - Year-over-year growth 2025-2030 (%)
Data Table on UAE - Year-over-year growth 2025-2030 (%)

12.6.2 Saudi Arabia - Market size and forecast 2025-2030

Chart on Saudi Arabia - Market size and forecast 2025-2030 ($ million)
Data Table on Saudi Arabia - Market size and forecast 2025-2030 ($ million)
Chart on Saudi Arabia - Year-over-year growth 2025-2030 (%)
Data Table on Saudi Arabia - Year-over-year growth 2025-2030 (%)

12.6.3 South Africa - Market size and forecast 2025-2030

Chart on South Africa - Market size and forecast 2025-2030 ($ million)
Data Table on South Africa - Market size and forecast 2025-2030 ($ million)
Chart on South Africa - Year-over-year growth 2025-2030 (%)
Data Table on South Africa - Year-over-year growth 2025-2030 (%)

12.6.4 Israel - Market size and forecast 2025-2030

Chart on Israel - Market size and forecast 2025-2030 ($ million)
Data Table on Israel - Market size and forecast 2025-2030 ($ million)
Chart on Israel - Year-over-year growth 2025-2030 (%)
Data Table on Israel - Year-over-year growth 2025-2030 (%)

12.6.5 Turkey - Market size and forecast 2025-2030

Chart on Turkey - Market size and forecast 2025-2030 ($ million)
Data Table on Turkey - Market size and forecast 2025-2030 ($ million)
Chart on Turkey - Year-over-year growth 2025-2030 (%)
Data Table on Turkey - Year-over-year growth 2025-2030 (%)

12.7 South America - Market size and forecast 2025-2030

Chart on South America - Market size and forecast 2025-2030 ($ million)
Data Table on South America - Market size and forecast 2025-2030 ($ million)
Chart on South America - Year-over-year growth 2025-2030 (%)
Data Table on South America - Year-over-year growth 2025-2030 (%)
Chart on Regional Comparison - South America
Data Table on Regional Comparison - South America

12.7.1 Brazil - Market size and forecast 2025-2030

Chart on Brazil - Market size and forecast 2025-2030 ($ million)
Data Table on Brazil - Market size and forecast 2025-2030 ($ million)
Chart on Brazil - Year-over-year growth 2025-2030 (%)
Data Table on Brazil - Year-over-year growth 2025-2030 (%)

12.7.2 Argentina - Market size and forecast 2025-2030

Chart on Argentina - Market size and forecast 2025-2030 ($ million)
Data Table on Argentina - Market size and forecast 2025-2030 ($ million)
Chart on Argentina - Year-over-year growth 2025-2030 (%)
Data Table on Argentina - Year-over-year growth 2025-2030 (%)

12.7.3 Colombia - Market size and forecast 2025-2030

Chart on Colombia - Market size and forecast 2025-2030 ($ million)
Data Table on Colombia - Market size and forecast 2025-2030 ($ million)
Chart on Colombia - Year-over-year growth 2025-2030 (%)
Data Table on Colombia - Year-over-year growth 2025-2030 (%)

12.8 Market opportunity by geography

Market opportunity by geography ($ million)
Data Tables on Market opportunity by geography ($ million)

13. Drivers, Challenges, and Opportunity

13.1 Market drivers

Accelerated adoption of predictive maintenance strategies in heavy industry
Proliferation of Industrial Internet of Things (IIoT) and wireless devices
Stringent regulatory standards and safety requirements

13.2 Market challenges

Complexities in retrofitting legacy infrastructure and data integration
Cybersecurity vulnerabilities and data privacy concerns
Shortage of skilled personnel and analytical expertise

13.3 Impact of drivers and challenges

Impact of drivers and challenges in 2025 and 2030

13.4 Market opportunities

Integration of edge computing and artificial intelligence on sensor
Proliferation of wireless connectivity and private 5G networks
Shift towards prescriptive analytics

14. Competitive Landscape

14.1 Overview

14.2

Overview on criticality of inputs and factors of differentiation

14.3 Landscape disruption

Overview on factors of disruption

14.4 Industry risks

Impact of key risks on business

15. Competitive Analysis

15.1 Companies profiled

Companies covered

15.2 Company ranking index

15.3 Market positioning of companies

Matrix on companies position and classification

15.4 AB SKF

AB SKF - Overview
AB SKF - Business segments
AB SKF - Key news
AB SKF - Key offerings
AB SKF - Segment focus
SWOT

15.5 ABB Ltd.

ABB Ltd. - Overview
ABB Ltd. - Business segments
ABB Ltd. - Key news
ABB Ltd. - Key offerings
ABB Ltd. - Segment focus
SWOT

15.6 Amphenol Corp.

Amphenol Corp. - Overview
Amphenol Corp. - Business segments
Amphenol Corp. - Key news
Amphenol Corp. - Key offerings
Amphenol Corp. - Segment focus
SWOT

15.7 Baker Hughes Co.

Baker Hughes Co. - Overview
Baker Hughes Co. - Business segments
Baker Hughes Co. - Key news
Baker Hughes Co. - Key offerings
Baker Hughes Co. - Segment focus
SWOT

15.8 Emerson Electric Co.

Emerson Electric Co. - Overview
Emerson Electric Co. - Business segments
Emerson Electric Co. - Key news
Emerson Electric Co. - Key offerings
Emerson Electric Co. - Segment focus
SWOT

15.9 Fluke Corp.

Fluke Corp. - Overview
Fluke Corp. - Product / Service
Fluke Corp. - Key offerings
SWOT

15.10 Hansford Sensors Ltd.

Hansford Sensors Ltd. - Overview
Hansford Sensors Ltd. - Product / Service
Hansford Sensors Ltd. - Key offerings
SWOT

15.11 Honeywell International Inc.

Honeywell International Inc. - Overview
Honeywell International Inc. - Business segments
Honeywell International Inc. - Key news
Honeywell International Inc. - Key offerings
Honeywell International Inc. - Segment focus
SWOT

15.12 Keyence Corp.

Keyence Corp. - Overview
Keyence Corp. - Product / Service
Keyence Corp. - Key offerings
SWOT

15.13 PCB Piezotronics Inc.

PCB Piezotronics Inc. - Overview
PCB Piezotronics Inc. - Product / Service
PCB Piezotronics Inc. - Key offerings
SWOT

15.14 Rockwell Automation Inc.

Rockwell Automation Inc. - Overview
Rockwell Automation Inc. - Business segments
Rockwell Automation Inc. - Key news
Rockwell Automation Inc. - Key offerings
Rockwell Automation Inc. - Segment focus
SWOT

15.15 Schaeffler AG

Schaeffler AG - Overview
Schaeffler AG - Business segments
Schaeffler AG - Key news
Schaeffler AG - Key offerings
Schaeffler AG - Segment focus
SWOT

15.16 Siemens AG

Siemens AG - Overview
Siemens AG - Business segments
Siemens AG - Key news
Siemens AG - Key offerings
Siemens AG - Segment focus
SWOT

15.17 SPM Instrument

SPM Instrument - Overview
SPM Instrument - Product / Service
SPM Instrument - Key offerings
SWOT

15.18 TE Connectivity plc

TE Connectivity plc - Overview
TE Connectivity plc - Business segments
TE Connectivity plc - Key news
TE Connectivity plc - Key offerings
TE Connectivity plc - Segment focus
SWOT

16. Appendix

16.1 Scope of the report

Market definition
Objectives
Notes and caveats

16.2 Inclusions and exclusions checklist

Inclusions checklist
Exclusions checklist

16.3 Currency conversion rates for US$

16.4 Research methodology

16.5 Data procurement

Information sources

16.6 Data validation

16.7 Validation techniques employed for market sizing

16.8 Data synthesis

16.9 360 degree market analysis

16.10 List of abbreviations

Research Methodology

Technavio presents a detailed picture of the market by way of study, synthesis, and summation of data from multiple sources. The analysts have presented the various facets of the market with a particular focus on identifying the key industry influencers. The data thus presented is comprehensive, reliable, and the result of extensive research, both primary and secondary.

INFORMATION SOURCES

Primary sources

  • Manufacturers and suppliers
  • Channel partners
  • Industry experts
  • Strategic decision makers

Secondary sources

  • Industry journals and periodicals
  • Government data
  • Financial reports of key industry players
  • Historical data
  • Press releases

DATA ANALYSIS

Data Synthesis

  • Collation of data
  • Estimation of key figures
  • Analysis of derived insights

Data Validation

  • Triangulation with data models
  • Reference against proprietary databases
  • Corroboration with industry experts

REPORT WRITING

Qualitative

  • Market drivers
  • Market challenges
  • Market trends
  • Five forces analysis

Quantitative

  • Market size and forecast
  • Market segmentation
  • Geographical insights
  • Competitive landscape

Interested in this report?

Get your sample now to see our research methodology and insights!

Download Now

Frequently Asked Questions

Condition Monitoring Sensors For Heavy Industry market growth will increase by USD 533.8 million during 2026-2030.

The Condition Monitoring Sensors For Heavy Industry market is expected to grow at a CAGR of 8.3% during 2026-2030.

Condition Monitoring Sensors For Heavy Industry market is segmented by Product type (Vibration sensors, Temperature sensors, Pressure sensors, Level sensors, Others) End-user (Oil and gas, Power generation, Mining and mineral processing, Steel and iron manufacturing, Cement manufacturing) Type (Wired sensors, Wireless sensors)

AB SKF, ABB Ltd., Amphenol Corp., Baker Hughes Co., Balluff GmbH, Banner Engineering Corp., Baumer Holding AG, Emerson Electric Co., Fluke Corp., Hansford Sensors Ltd., Honeywell International Inc., Keyence Corp., Kistler Group, PCB Piezotronics Inc., Rockwell Automation Inc., Schaeffler AG, Siemens AG, SPM Instrument, TE Connectivity plc, Teledyne FLIR LLC are a few of the key vendors in the Condition Monitoring Sensors For Heavy Industry market.

APAC will register the highest growth rate of 43.6% among the other regions. Therefore, the Condition Monitoring Sensors For Heavy Industry market in APAC is expected to garner significant business opportunities for the vendors during the forecast period.

China, India, Japan, South Korea, Australia, Indonesia, US, Canada, Mexico, Germany, UK, France, Italy, Spain, The Netherlands, UAE, Saudi Arabia, South Africa, Israel, Turkey, Brazil, Argentina, Colombia

  • Accelerated adoption of predictive maintenance strategies in heavy industry is the driving factor this market.

The Condition Monitoring Sensors For Heavy Industry market vendors should focus on grabbing business opportunities from the Product type segment as it accounted for the largest market share in the base year.
RIA - Research AI Assistant
Ask RIA