
Oil Condition Monitoring Market Size 2025-2029
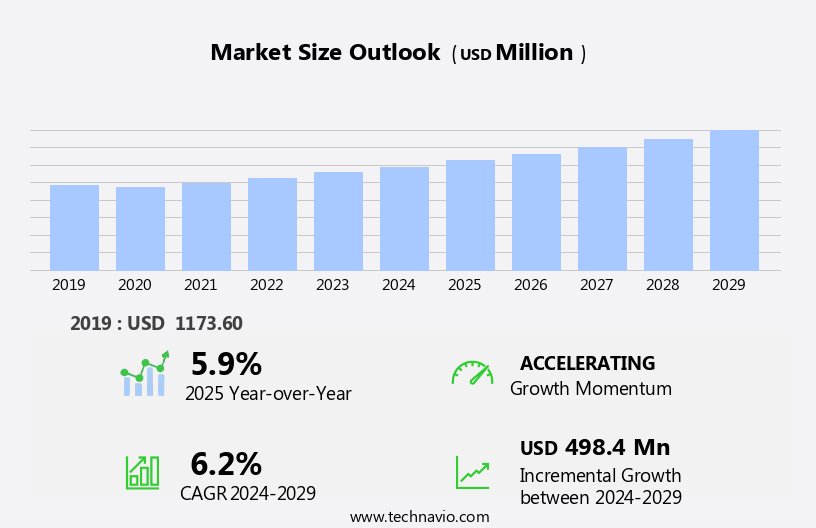
The oil condition monitoring market size is forecast to increase by USD 498.4 million, at a CAGR of 6.2% between 2024 and 2029.
- The market is experiencing significant growth due to the increasing demand for predictive maintenance in various industries. This proactive approach to maintenance enables organizations to identify and address potential equipment issues before they escalate into costly breakdowns. Moreover, the introduction of advanced oil condition monitoring technologies, such as sensors and analytics software, is facilitating real-time monitoring and predictive analysis, further boosting market growth. However, the market faces a notable challenge: the lack of a skilled workforce capable of effectively implementing and utilizing these technologies. As the market continues to evolve, companies must invest in training and development programs to ensure they have the necessary expertise in-house.
- Failure to do so may result in suboptimal system performance and missed opportunities for cost savings and operational efficiency. Additionally, the high initial investment costs associated with implementing oil condition monitoring systems can be a barrier to entry for smaller organizations. Nevertheless, the long-term benefits, including reduced maintenance costs, increased equipment uptime, and improved safety, make it a worthwhile investment for businesses seeking to optimize their operations and remain competitive in their respective industries.
What will be the Size of the Oil Condition Monitoring Market during the forecast period?
The market continues to evolve, driven by the need for machinery reliability and asset management in various sectors, including heavy equipment, chemical processing, power generation, and oil & gas. Real-time monitoring of equipment lubrication and oil degradation is crucial for cost reduction and operational efficiency. Technologies such as wear debris analysis, hydraulic systems, infrared spectroscopy, and failure prevention are integral to this process. Artificial intelligence and machine learning are increasingly being adopted for data analytics, enabling automated reporting and predictive maintenance. Remote monitoring and component life cycle assessment are also gaining traction, allowing for real-time identification of fluid contamination, additive depletion, and other issues.
Oil recycling and oil change management are essential components of the market, with data acquisition and ultrasonic testing playing a key role in optimizing maintenance and reducing downtime. Sensor technology and lubricant performance analysis are also critical for ensuring the health of rotating machinery and engines. Water content, spectrometric analysis, fuel dilution, and acoustic emission monitoring are additional techniques used to improve reliability and prevent failures. Cloud computing enables the collection and analysis of vast amounts of data, further enhancing the capabilities of oil condition monitoring systems. In the ever-changing landscape of industrial equipment maintenance, oil analysis, oil sampling, and condition-based maintenance are key strategies for optimizing performance and reducing operational costs. The market continues to unfold, with new technologies and applications emerging to meet the evolving needs of businesses.
How is this Oil Condition Monitoring Industry segmented?
The oil condition monitoring industry research report provides comprehensive data (region-wise segment analysis), with forecasts and estimates in "USD million" for the period 2025-2029, as well as historical data from 2019-2023 for the following segments.
- Type
- On-site
- Off-site
- End-user
- Transportation
- Industrial
- Power generation
- Mining
- Oil and gas
- Geography
- North America
- US
- Canada
- Europe
- France
- Germany
- Italy
- UK
- APAC
- China
- India
- Japan
- South Korea
- Rest of World (ROW)
- North America
By Type Insights
The on-site segment is estimated to witness significant growth during the forecast period.
On-site oil condition monitoring is a critical aspect of machinery reliability and asset management in various industries, including heavy equipment, oil & gas, power generation, and chemical processing. This approach utilizes IoT-based sensors, portable testing kits, and in-line analyzers to provide real-time insights into oil quality, enabling proactive maintenance and minimizing downtime. Real-time monitoring allows for the early detection of fluid contamination, oil degradation, additive depletion, and other anomalies, which can lead to costly equipment failures. Continuous data acquisition through on-site monitoring also facilitates condition-based maintenance, optimizing maintenance schedules and reducing operational inefficiencies. In the context of heavy equipment, on-site oil analysis is essential for industries where equipment failure can result in significant downtime and financial losses.
For instance, in power generation, real-time monitoring of oil quality in turbines and generators can prevent catastrophic failures, ensuring reliable power supply and minimizing maintenance costs. Moreover, on-site oil condition monitoring is cost-effective for high-value assets, as it eliminates the need for frequent oil sampling and sending samples to external laboratories. This is particularly beneficial for industries such as aerospace and automotive, where the cost of downtime is substantial. Advanced technologies like vibration monitoring, acoustic emission, wear debris analysis, and machine learning algorithms are integrated into on-site oil condition monitoring systems to enhance their capabilities. These technologies enable the detection of subtle changes in oil quality and machine performance, facilitating predictive maintenance and extending component life cycles.
Cloud computing and automated reporting further streamline the oil condition monitoring process, allowing for centralized data management and real-time access to critical information. This enables organizations to make informed decisions regarding maintenance, optimize operational efficiency, and reduce costs.
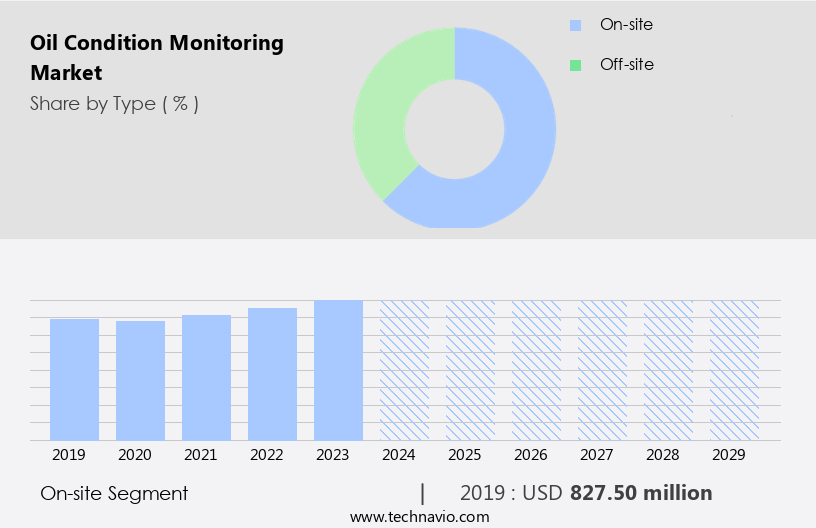
The On-site segment was valued at USD 827.50 million in 2019 and showed a gradual increase during the forecast period.
Regional Analysis
North America is estimated to contribute 34% to the growth of the global market during the forecast period.Technavio's analysts have elaborately explained the regional trends and drivers that shape the market during the forecast period.

The market in North America is experiencing significant growth, driven by the increasing demand for machinery reliability and asset management in sectors such as oil and gas, automotive, aerospace, and mining. In 2023, the US witnessed a surge in oil and natural gas production, averaging 13.3 million barrels per day for oil and 128.8 billion cubic feet per day for natural gas. This growth is attributed to advancements in technology, particularly in the Permian region, leading to enhanced well-level productivity. To maintain the optimal performance and longevity of critical equipment in this expanding production environment, oil condition monitoring solutions are increasingly being adopted.
These solutions enable real-time monitoring of fluid contamination, oil degradation, and additive depletion, among other factors, to prevent failures and minimize production losses. Data analytics plays a crucial role in this process, with machine learning and artificial intelligence enabling predictive maintenance and condition-based maintenance strategies. Oil recycling and filtration systems are also gaining popularity as part of comprehensive oil management strategies, reducing costs and improving operational efficiency. Sensor technology, including vibration monitoring, acoustic emission, and wear debris analysis, is used to detect early signs of component failure and optimize maintenance schedules. Hydraulic systems, engines, and rotating machinery are among the industrial equipment benefiting from these advanced monitoring and analysis techniques.
Power generation and chemical processing industries are also adopting oil condition monitoring to ensure the reliability and efficiency of their operations. Cloud computing and automated reporting enable remote monitoring and real-time data access, while ultrasonic testing and spectrometric analysis provide valuable insights into fluid properties and contaminant levels. Infrared spectroscopy and particle counting are additional tools used to assess engine health and lubricant performance, respectively. Overall, the market in North America is expected to continue growing as industries seek to prevent downtime, reduce costs, and improve operational efficiency through advanced monitoring and analysis of their critical equipment.
Market Dynamics
Our researchers analyzed the data with 2024 as the base year, along with the key drivers, trends, and challenges. A holistic analysis of drivers will help companies refine their marketing strategies to gain a competitive advantage.
What are the key market drivers leading to the rise in the adoption of Oil Condition Monitoring Industry?
- The increasing necessity for predictive maintenance is the primary factor fueling market growth. The market is experiencing significant growth due to the increasing adoption of predictive maintenance (PdM) strategies in various industries, including oil & gas, power generation, and manufacturing. Predictive maintenance utilizes advanced technologies such as data analytics, machine learning, and real-time monitoring to evaluate the health of industrial equipment by analyzing oil samples. This approach enables businesses to detect early signs of wear, contamination, or failure in machinery lubricants, allowing them to optimize maintenance schedules, reduce unplanned downtime, and achieve substantial cost savings. Industries are shifting from reactive and preventive maintenance models towards predictive maintenance strategies, as the latter offers numerous benefits, including improved reliability, operational efficiency, and reduced maintenance costs.
- Predictive maintenance employs various techniques such as data acquisition, vibration monitoring, acoustic emission, and automated reporting to monitor oil degradation and additive depletion in real-time. Additionally, cloud computing technology facilitates the collection, storage, and analysis of vast amounts of data, making predictive maintenance more accessible and cost-effective. By implementing oil condition monitoring systems, businesses can anticipate potential breakdowns, minimize maintenance costs, and enhance overall operational efficiency. The market is expected to continue growing as more industries embrace predictive maintenance and seek to optimize their maintenance strategies.
What are the market trends shaping the Oil Condition Monitoring Industry?
- The introduction of new products is a current market trend. Professionals in various industries are continually innovating and launching new items to meet consumer demands and stay competitive.
- The market is experiencing growth due to the adoption of advanced technologies that enhance equipment performance and reliability. Companies are developing innovative solutions for real-time analysis of oil conditions, enabling proactive maintenance strategies. In March 2024, CM Technologies (CMT) introduced an advanced oil condition monitoring system, the WBS IR Analyser, which utilizes infrared spectroscopy to assess key parameters such as base number, soot, water content, and fuel dilution in cylinder and system oils. This technology offers instant and reliable results without requiring expensive reagents, making it a cost-effective solution for monitoring oil conditions. Wear debris analysis, a crucial aspect of oil condition monitoring, is also gaining popularity due to its ability to predict component life cycle and prevent failures.
- Machine learning and artificial intelligence are being integrated into these solutions to provide predictive maintenance capabilities. Spectrometric analysis is another technique used for oil condition monitoring, providing insights into the chemical composition of the oil, enabling early detection of contamination and potential failures. Remote monitoring capabilities are also becoming increasingly important, allowing operators to monitor oil conditions from anywhere, reducing downtime and maintenance costs.
What challenges does the Oil Condition Monitoring Industry face during its growth?
- The insufficient supply of skilled labor represents a significant obstacle to the expansion and growth of the industry.
- The market encounters a substantial challenge due to the scarcity of skilled labor for interpreting data and implementing predictive maintenance strategies. IoT and AI-driven oil condition monitoring solutions generate vast amounts of data, yet the absence of proficient professionals to analyze this information and make informed decisions limits their effectiveness. In 2024, around 75% of employers globally reported vacancy filling difficulties, with the US experiencing a 70% labor shortage. This labor shortage impacts various industries, including those heavily relying on oil condition monitoring technologies. The intricacy of interpreting oil condition monitoring data necessitates specialized knowledge and expertise, which is currently in limited supply.
- Ultrasonic testing, oil analysis, oil sampling, condition-based maintenance, sensor technology, lubricant performance, oil filtration, and particle counting are integral components of oil condition monitoring. Addressing the labor shortage through training and education initiatives could enhance the market's potential for downtime reduction and optimized lubricant performance.
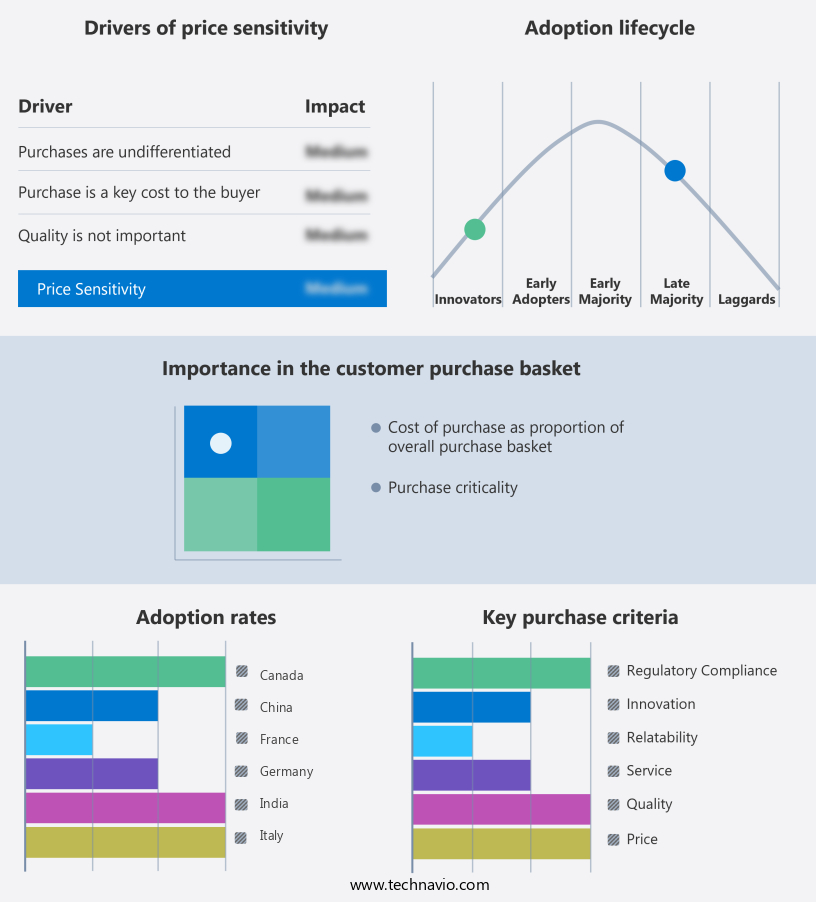
Exclusive Customer Landscape
The oil condition monitoring market forecasting report includes the adoption lifecycle of the market, covering from the innovator's stage to the laggard's stage. It focuses on adoption rates in different regions based on penetration. Furthermore, the oil condition monitoring market report also includes key purchase criteria and drivers of price sensitivity to help companies evaluate and develop their market growth analysis strategies.
Customer Landscape
Key Companies & Market Insights
Companies are implementing various strategies, such as strategic alliances, oil condition monitoring market forecast, partnerships, mergers and acquisitions, geographical expansion, and product/service launches, to enhance their presence in the industry.
Atlaslab - The company specializes in oil condition monitoring solutions, providing advanced programs to optimize fluid performance and streamline maintenance.
The industry research and growth report includes detailed analyses of the competitive landscape of the market and information about key companies, including:
- Atlaslab
- BP Plc
- Bureau Veritas SA
- Chevron Corp.
- Eaton Corp. plc
- eralytics GmbH
- General Electric Co.
- Intertek Group Plc
- KROHNE Messtechnik GmbH
- MAN Energy Solutions SE
- Minimac Systems Pvt. Ltd.
- Parker Hannifin Corp.
- SGS SA
- Shell plc
- Tan Delta Systems PLC
- Techenomics International
- TotalEnergies SE
- TUV NORD GROUP
- Veritas Petroleum Services
- Vickers Oils
Qualitative and quantitative analysis of companies has been conducted to help clients understand the wider business environment as well as the strengths and weaknesses of key industry players. Data is qualitatively analyzed to categorize companies as pure play, category-focused, industry-focused, and diversified; it is quantitatively analyzed to categorize companies as dominant, leading, strong, tentative, and weak.
Recent Development and News in Oil Condition Monitoring Market
- In January 2023, Schneider Electric, a global energy management and automation company, announced the launch of its new EcoStruxure Oil & Gas Asset Intelligence solution, which includes oil condition monitoring capabilities. This innovative offering aims to help oil and gas companies optimize their operations by predicting equipment failures and reducing maintenance costs (Schneider Electric Press Release, 2023).
- In March 2024, Siemens Energy and Baker Hughes, two leading energy technology providers, formed a strategic partnership to integrate Siemens Energy's SinoFuel Oil Condition Monitoring System with Baker Hughes' digital oilfield solutions. This collaboration is expected to enhance the efficiency and reliability of oil and gas production processes (Baker Hughes Press Release, 2024).
- In July 2024, Emerson, a technology and engineering company, completed the acquisition of AspenTech, a leading software company specializing in process optimization and asset performance management. This acquisition is expected to strengthen Emerson's position in the market and expand its offerings to include advanced analytics and machine learning capabilities (Emerson Press Release, 2024).
Research Analyst Overview
- The market encompasses various technologies and approaches to ensure optimal operational performance and equipment life extension. Key components include vibration signature analysis, particle size distribution, oil quality monitoring, and wear metal analysis. Condition-based maintenance programs employ data-driven maintenance strategies, such as advanced analytics and predictive maintenance, to minimize downtime and reduce costs. Oil life management and contamination control are essential for preventing oil degradation products and ensuring lubricant chemistry remains effective.
- Acoustic emission monitoring, oil additives, and machine health monitoring further enhance maintenance strategies. Big data analytics, digital twin, remote asset management, and predictive analytics facilitate operational performance optimization and maintenance scheduling. By integrating these technologies, businesses can effectively manage their assets and extend equipment life.
Dive into Technavio's robust research methodology, blending expert interviews, extensive data synthesis, and validated models for unparalleled Oil Condition Monitoring Market insights. See full methodology.
|
Market Scope |
|
|
Report Coverage |
Details |
|
Page number |
214 |
|
Base year |
2024 |
|
Historic period |
2019-2023 |
|
Forecast period |
2025-2029 |
|
Growth momentum & CAGR |
Accelerate at a CAGR of 6.2% |
|
Market growth 2025-2029 |
USD 498.4 million |
|
Market structure |
Fragmented |
|
YoY growth 2024-2025(%) |
5.9 |
|
Key countries |
US, China, Germany, UK, India, Canada, Japan, France, South Korea, and Italy |
|
Competitive landscape |
Leading Companies, Market Positioning of Companies, Competitive Strategies, and Industry Risks |
What are the Key Data Covered in this Oil Condition Monitoring Market Research and Growth Report?
- CAGR of the Oil Condition Monitoring industry during the forecast period
- Detailed information on factors that will drive the growth and forecasting between 2025 and 2029
- Precise estimation of the size of the market and its contribution of the industry in focus to the parent market
- Accurate predictions about upcoming growth and trends and changes in consumer behaviour
- Growth of the market across North America, Europe, APAC, Middle East and Africa, and South America
- Thorough analysis of the market's competitive landscape and detailed information about companies
- Comprehensive analysis of factors that will challenge the oil condition monitoring market growth of industry companies
We can help! Our analysts can customize this oil condition monitoring market research report to meet your requirements.
 RIA -
RIA - 
