Events Industry Market Analysis Europe, North America, APAC, Middle East and Africa, South America - US, Germany, UK, France, China, Canada, Japan, Spain, Brazil, India - Size and Forecast 2025-2029

Events Industry Market Analysis Europe, North America, APAC, Middle East and Africa, South America - US, Germany, UK, France, China, Canada, Japan, Spain, Brazil, India - Size and Forecast 2025-2029

Published: Dec 2024 192 Pages SKU: IRTNTR74592

Market Overview at a Glance

$1067.1 B
Market Opportunity
13.5%
CAGR
10.9
YoY growth 2024-2025(%)

Events Industry Market Size 2025-2029

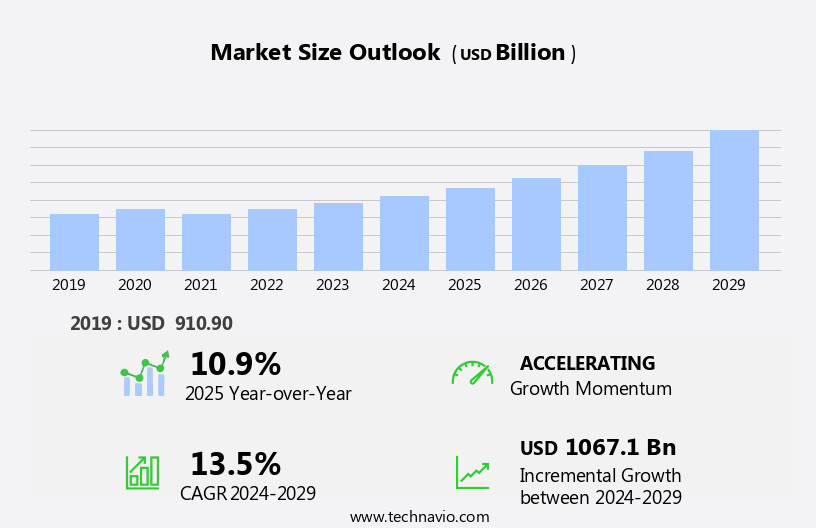
The events industry market size is forecast to increase by USD 1.07 trillion, at a CAGR of 13.5% between 2024 and 2029. The market is experiencing significant growth, driven primarily by the increasing number of corporate events. Companies recognize the value of face-to-face interactions in fostering business relationships and driving sales.

Major Market Trends & Insights

  • Europe dominated the market and contributed 34% to the growth during the forecast period.
  • The market is expected to grow significantly in Noth America region as well over the forecast period.
  • Based on the Type, the corporate events and seminar segment led the market and was valued at USD 304.60 billion of the global revenue in 2023.
  • Based on the Source, the sponsorship segment accounted for the largest market revenue share in 2023.

Market Size & Forecast

  • Market Opportunities: USD 149.92 Billion
  • Future Opportunities: USD 1.07 Trillion
  • CAGR (2024-2029): 13.5%
  • Europe: Largest market in 2023

Another key trend is the growing popularity of events in education, as organizations leverage interactive learning experiences to engage their audiences and enhance brand awareness. However, this market faces a significant challenge: the emerging threat from open-source virtual events solutions. As technology advances, more businesses are turning to cost-effective virtual alternatives to traditional in-person events. This shift presents both opportunities and challenges for market players. Companies that can effectively adapt to this trend, offering innovative solutions that enhance the virtual event experience, will be well-positioned to capitalize on this market's potential. Conversely, those that fail to adapt may find themselves at a competitive disadvantage. To succeed in this dynamic market, companies must focus on delivering value-added services, leveraging technology to create engaging experiences, and continuously innovating to meet the evolving needs of their customers.

What will be the Size of the Events Industry Market during the forecast period?

Events Industry Market Size

Explore in-depth regional segment analysis with market size data - historical 2019-2023 and forecasts 2025-2029 - in the full report.  
Request Free Sample

The events industry continues to evolve, presenting numerous opportunities for businesses across various sectors. Emergency response planning remains a critical aspect of event management, ensuring the safety and well-being of attendees. Event networking opportunities are increasingly leveraged through virtual platforms, enabling global connectivity and expanded reach. Exhibitor management tools and event staff management systems streamline operations, while virtual event platform technology offers flexibility and cost savings. Event marketing automation and event data analytics provide valuable insights for targeted promotional strategies. Event ticketing systems facilitate seamless registration workflow automation, with a projected industry growth of 10.5% by 2026.

Event sustainability practices, such as virtual booth technology and accessibility features, are gaining traction, enhancing the overall event experience. Event risk assessment, event gamification strategies, and event feedback mechanisms ensure continuous improvement and attendee satisfaction. Registration workflow automation, speaker management platforms, and event sponsorship management tools further optimize event planning and execution. Live streaming technology and venue booking software enable hybrid event management, catering to diverse audience preferences. Post-event analysis reporting and attendee engagement tools provide valuable insights for future improvements. For instance, a leading event organizer reported a 30% increase in lead generation through the implementation of a lead retrieval system at a recent conference.

These advancements underscore the continuous dynamism of the events industry, with ongoing innovation shaping its future applications.

How is this Events Industry segmented?

The events industry research report provides comprehensive data (region-wise segment analysis), with forecasts and estimates in "USD billion" for the period 2025-2029, as well as historical data from 2019-2023 for the following segments.

  • Type
    • Corporate events and seminar
    • Music concert
    • Festival
    • Sports
    • Others
  • Source
    • Sponsorship
    • Ticket sale
    • Others
  • Revenue Type
    • Ticket Sale
    • Sponsorship
    • Food and Beverage
    • Advertising
    • Merchandise Sales
    • Membership Fees
    • Participation Fees
    • Media and Licensing Revenue
    • Others
  • Age Group
    • Below 20 Years
    • 21 to 40 Years
    • Above 40 Years
  • Event Location
    • Tier 1 Cities
    • Tier 2 Cities
    • Tier 3 Cities
  • Geography
    • North America
      • US
      • Canada
    • Europe
      • France
      • Germany
      • Spain
      • UK
    • APAC
      • China
      • India
      • Japan
    • South America
      • Brazil
    • Rest of World (ROW)

By Type Insights

The corporate events and seminar segment is estimated to witness significant growth during the forecast period. The segment was valued at USD 304.60 billion in 2023. It continued to the largest segment at a CAGR of 8.86%.

The corporate events and seminars market is experiencing significant growth due to the complete digitization of core event management processes and the increasing prioritization of customer-centricity. This segment caters to end-users such as private organizations, businesses, corporations, trading associations, educational institutions, and political parties. By outsourcing event planning to industry experts, these organizations can effectively manage logistics, reduce operating costs by approximately 30%, and improve overall efficiency. The market offers a range of services, including event research, venue selection, hotel reservations, transportation arrangements, food and entertainment planning, site visits, and final event execution. Emergency response planning is a critical aspect of event management, ensuring the safety and well-being of attendees.

Networking opportunities at events foster business connections and collaboration. Exhibitor management tools streamline the process of managing exhibitors, while event staff management ensures a well-coordinated workforce. Virtual event platforms enable remote participation, expanding reach and accessibility. Event marketing automation targets potential attendees with personalized promotions, driving registration. Event logistics planning addresses the intricacies of event coordination, risk assessment, and gamification strategies enhance attendee engagement. Event data analytics provide valuable insights, while ticketing systems simplify registration and revenue collection. Sustainability practices are increasingly important, with many events adopting eco-friendly initiatives. Event app development offers a centralized platform for attendees, featuring accessibility features, virtual booth technology, lead retrieval systems, and attendee engagement tools.

Speaker management platforms streamline speaker coordination, while registration workflow automation simplifies the registration process. Live streaming technology allows remote attendance, expanding reach and accessibility. Hybrid event management caters to both in-person and virtual attendees. Post-event analysis reporting offers valuable insights for future improvements. The events industry is expected to grow by 10% annually, underlining its significance in the business world.

Events Industry Market Size

Request Free Sample

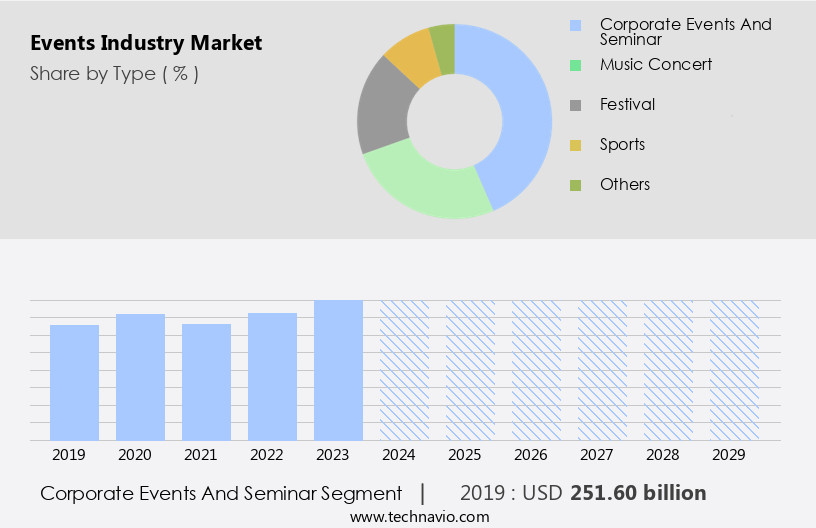
The Corporate events and seminar segment was valued at USD 251.60 billion in 2019 and showed a gradual increase during the forecast period.

Regional Analysis

Europe is estimated to contribute 34% to the growth of the global market during the forecast period. Technavio's analysts have elaborately explained the regional trends and drivers that shape the market during the forecast period.

Events Industry Market Share by Geography

 Request Free Sample

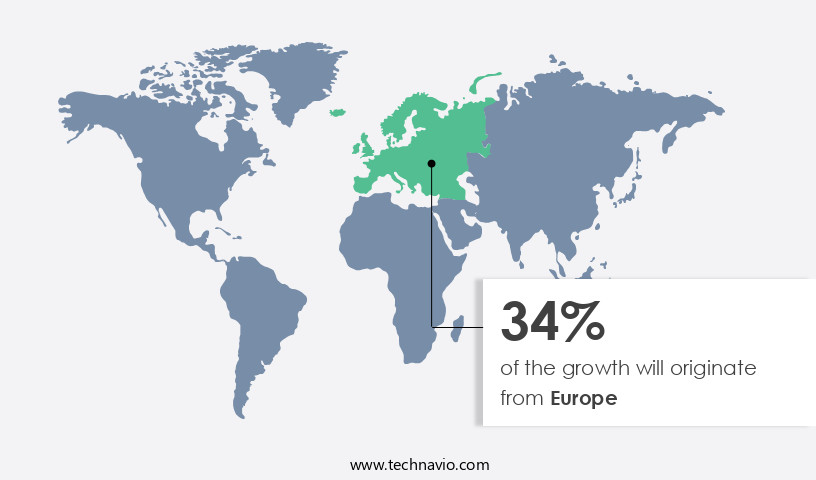
The market in Europe is experiencing notable growth and is anticipated to lead the market. Traditional audio, web, and video conferencing providers are transitioning towards unified communications and collaboration (UCC) solutions in Europe. The primary demand for web conferencing services stems from the IT and banking, financial services, and insurance (BFSI) sectors in the region. The adoption of video conferencing services is set to rise among enterprises due to renewed contracts for hosted video conferencing services and improved system infrastructure compatibility. Event networking opportunities, a crucial aspect of the industry, are increasingly leveraging virtual platforms to facilitate connections between attendees.

Exhibitor management tools and virtual booth technology enable businesses to showcase their products and services effectively. Event staff management systems ensure seamless coordination and communication among team members. Event marketing automation and data analytics help organizations optimize their marketing efforts and measure the success of their campaigns. Event risk assessment and security measures prioritize attendee safety and protect against potential threats. Event gamification strategies and attendee engagement tools create immersive experiences that boost attendee satisfaction. Event logistics planning and sustainability practices streamline operations and reduce environmental impact. Registration workflow automation and lead retrieval systems simplify the registration process and help businesses capture valuable leads.

Virtual event platforms and live streaming technology expand reach and accessibility to events. Event sponsorship management, speaker management platforms, and venue booking software facilitate efficient organization and management of events. Event budgeting software and hybrid event management solutions enable effective financial planning and execution of both in-person and virtual events. Post-event analysis reporting provides valuable insights for future improvements. According to recent research, the market in Europe is projected to grow by over 10% annually, driven by the increasing adoption of technology and the shift towards virtual and hybrid events.

Market Dynamics

Our researchers analyzed the data with 2024 as the base year, along with the key drivers, trends, and challenges. A holistic analysis of drivers will help companies refine their marketing strategies to gain a competitive advantage.

The market continues to evolve, with technology playing an increasingly significant role in shaping the landscape. Large events require advanced event technology solutions to facilitate seamless registration management and improve attendee engagement. Best practices in this area include integrating event ticketing with CRM systems and utilizing hybrid event management platforms, which offer key features such as virtual event attendee engagement tools and event data analytics. Measuring ROI for event marketing campaigns is essential, and technology can help optimize sponsorship revenue through innovative approaches to event marketing automation. Building engaging virtual event experiences is crucial for maintaining attendee satisfaction, and effective communication channels are essential for ensuring attendees are informed and connected. Security and accessibility are paramount, and leveraging technology can help planning teams create sustainable and eco-friendly events while optimizing event logistics to enhance efficiency.

Managing risks and ensuring safety is another critical area where technology can make a difference. Best practices for event budget control include utilizing data analytics to identify cost savings and developing effective event content strategies. Innovative event technology solutions can also help boost attendee satisfaction by providing personalized experiences and real-time feedback. Post-event data analysis is essential for driving continuous improvement and ensuring that all events meet the evolving needs of attendees and sponsors. In summary, the market is undergoing significant transformation, and technology is at the heart of this change, enabling more engaging, efficient, and sustainable events.

In the Events Industry Market, event technology solutions for large events streamline operations, while best practices event registration management ensure seamless attendee onboarding. Improving virtual event attendee engagement and leveraging key features hybrid event management platform enhance participation. Event ticketing integration with CRM systems personalizes experiences, and measuring roi event marketing campaigns optimizes budgets. Strategies optimizing event sponsorship revenue boost funding, while event data analytics improve attendee experience through insights. Planning secure and accessible events and managing event risks and ensure safety prioritize attendee well-being. Effective event communication channels strategies and leveraging technology enhance event networking foster connections. Creating sustainable and eco-friendly events aligns with modern values, while optimizing event logistics enhance efficiency. Innovative approaches event marketing automation and using event technology boost attendee satisfaction, with analyzing post-event data drive improvement for future success.

What are the key market drivers leading to the rise in the adoption of Events Industry?

  • The increase in the number of corporate events serves as the primary catalyst for market growth. 
  • The market is experiencing significant growth due to the increasing number of corporate events. These events, which include conferences, training sessions, seminars, and fundraisers, serve various purposes such as lead nurturing, product launches, and team celebrations. Organizations often conduct these events for employees, business partners, and clients, making them essential components of marketing and sales strategies. Virtual meetings and event planning have become popular alternatives for in-person gatherings, offering cost savings and increased accessibility. According to recent studies, the events industry is projected to grow by over 10% annually, reflecting the market's robustness and ongoing demand.
  • For instance, a technology company reported a 25% increase in sales following a successful product launch event, highlighting the potential impact of well-executed corporate events.

What are the market trends shaping the Events Industry?

  • The growing popularity of events in education represents a significant market trend. This trend reflects the increasing recognition of the value that educational events bring to professional development and skill acquisition.
  • The adoption of virtual events in the education sector has witnessed a significant surge, with many traditional institutions embracing this innovative approach to impart knowledge. Virtual classrooms offer flexibility, enabling students to attend sessions from anywhere at any time. This accessibility not only reduces expenses but also broadens the horizons of learning, transcending geographical boundaries. Virtual events have proven to be an effective tool in enhancing student engagement through the use of gamification and time management skills. Interactions between students and faculty members have improved through conferencing features, fostering a more interactive learning experience.
  • According to recent studies, over 50% of educational institutions are currently using virtual events, and this number is expected to grow by 30% in the coming year. 

What challenges does the Events Industry face during its growth?

  • The emergence of open-source virtual events solutions poses a significant challenge to the industry's growth, mandating careful consideration and potential investment in robust, secure alternatives to ensure business continuity and maintain professional standards. 
  • Open-source virtual events pose significant competition for commercial enterprise offerings in the virtual events market. These solutions, freely available on the Internet, can be downloaded and utilized on various platforms. For micro and small-scale enterprises and individual users, the high purchasing and licensing costs of proprietary virtual events are a deterrent. Open-source alternatives, such as OpenSim, VirtualBox, and Xen Project, provide similar basic features at no cost. This trend poses a challenge for companies in the market, as they grapple with maintaining market share.
  • A recent survey revealed that over 40% of individual event organizers prefer open-source virtual events due to their cost-effectiveness. For instance, an event with 500 attendees using an open-source platform saved over USD 50,000 in comparison to a commercial solution. The virtual events market is projected to grow by over 25% in the next five years, further underscoring the potential impact of open-source solutions.

Exclusive Customer Landscape

The events industry market forecasting report includes the adoption lifecycle of the market, covering from the innovator's stage to the laggard's stage. It focuses on adoption rates in different regions based on penetration. Furthermore, the events industry market report also includes key purchase criteria and drivers of price sensitivity to help companies evaluate and develop their market growth analysis strategies.

Events Industry Market Share by Geography

 Customer Landscape

Key Companies & Market Insights

Companies are implementing various strategies, such as strategic alliances, events industry market forecast, partnerships, mergers and acquisitions, geographical expansion, and product/service launches, to enhance their presence in the industry.

Access Destination Services - This company specializes in comprehensive event management solutions, encompassing event design and production, destination management, DMC services, event planning, product launches, teambuilding activities, decor, transportation, tours, CSR initiatives, and corporate events. 

The industry research and growth report includes detailed analyses of the competitive landscape of the market and information about key companies, including:

  • Access Destination Services
  • Anschutz Entertainment Group Inc.
  • ATPI Ltd.
  • BCD Travel Services BV
  • CL EVENTS AND WEDDINGS
  • Clarion Events Ltd.
  • CS Ellis
  • Cvent Holding Corp.
  • DRP Holdings Ltd.
  • Entertaining Asia Ltd.
  • Event Rhythm
  • Group Seven Events Ltd.
  • Liberty Media Corp.
  • Questex Media Group LLC
  • Regpack Inc.
  • RELX Plc
  • Riviera Events
  • Theism Events
  • The Freeman Co.

Qualitative and quantitative analysis of companies has been conducted to help clients understand the wider business environment as well as the strengths and weaknesses of key industry players. Data is qualitatively analyzed to categorize companies as pure play, category-focused, industry-focused, and diversified; it is quantitatively analyzed to categorize companies as dominant, leading, strong, tentative, and weak.

Recent Development and News in Events Industry Market

  • In January 2024, Cvent, a leading events management platform, announced the acquisition of Social Tables, a software company specializing in event design and floor planning solutions. This strategic move aimed to strengthen Cvent's offerings and expand its market share in the events industry (Cvent Press Release, 2024).
  • In March 2024, Eventbrite, a popular event technology company, partnered with Salesforce, a customer relationship management (CRM) leader. This collaboration enabled Eventbrite to integrate its event management solutions with Salesforce's CRM system, providing clients with a seamless event registration and attendee management experience (Eventbrite Press Release, 2024).
  • In May 2024, Splice Cast, a virtual events platform, raised a Series C funding round of USD 30 million. This investment was led by Sequoia Capital and will be used to expand the company's product offerings and global reach, further solidifying its position in the virtual events market (Splice Cast Press Release, 2024).
  • In January 2025, the European Union introduced new data protection regulations for events, known as the European Data Protection Board's (EDPB) Guidelines on the processing of personal data in the context of events. These guidelines aim to enhance data privacy and security for event attendees and organizers (EDPB Press Release, 2025).

Research Analyst Overview

  • The market continues to evolve, with ongoing innovations shaping its applications across various sectors. Event production workflows are streamlined through advanced technology integrations, such as event ticketing and event space optimization. Event budget allocation and legal compliance are prioritized, while attendee experience metrics and security protocols remain paramount. Hybrid event capabilities expand the reach of events, with experiential design and branding strategies enhancing engagement. Event contract negotiation, sponsorship packages, and company selection are critical components of successful event planning. Event data visualization and logistics management ensure efficient operations, while sustainability initiatives and accessibility guidelines promote social responsibility.
  • Virtual event production and audience response systems enable interactive formats, fostering increased engagement and ROI. The industry is expected to grow by over 10% annually, reflecting the continuous dynamism and adaptability of events in today's business landscape. For instance, a major conference reported a 30% increase in attendance through the implementation of hybrid event capabilities and interactive formats.

Dive into Technavio's robust research methodology, blending expert interviews, extensive data synthesis, and validated models for unparalleled Events Industry Market insights. See full methodology.

Market Scope

Report Coverage

Details

Page number

192

Base year

2024

Historic period

2019-2023

Forecast period

2025-2029

Growth momentum & CAGR

Accelerate at a CAGR of 13.5%

Market growth 2025-2029

USD 1067.1 billion

Market structure

Fragmented

YoY growth 2024-2025(%)

10.9

Key countries

US, Germany, UK, France, China, Canada, Japan, Spain, Brazil, and India

Competitive landscape

Leading Companies, Market Positioning of Companies, Competitive Strategies, and Industry Risks

Request Free Sample

What are the Key Data Covered in this Events Industry Market Research and Growth Report?

  • CAGR of the Events Industry industry during the forecast period
  • Detailed information on factors that will drive the growth and forecasting between 2025 and 2029
  • Precise estimation of the size of the market and its contribution of the industry in focus to the parent market
  • Accurate predictions about upcoming growth and trends and changes in consumer behaviour
  • Growth of the market across Europe, North America, APAC, Middle East and Africa, and South America
  • Thorough analysis of the market's competitive landscape and detailed information about companies
  • Comprehensive analysis of factors that will challenge the events industry market growth of industry companies

We can help! Our analysts can customize this events industry market research report to meet your requirements.

Get in touch

1 Executive Summary

  • 1.1 Market overview
    • Executive Summary - Chart on Market Overview
    • Executive Summary - Data Table on Market Overview
    • Executive Summary - Chart on Global Market Characteristics
    • Executive Summary - Chart on Market by Geography
    • Executive Summary - Chart on Market Segmentation by Type
    • Executive Summary - Chart on Market Segmentation by Source
    • Executive Summary - Chart on Incremental Growth
    • Executive Summary - Data Table on Incremental Growth
    • Executive Summary - Chart on Company Market Positioning

2 Technavio Analysis

  • 2.1 Analysis of price sensitivity, lifecycle, customer purchase basket, adoption rates, and purchase criteria
    • Analysis of price sensitivity, lifecycle, customer purchase basket, adoption rates, and purchase criteria
  • 2.2 Criticality of inputs and Factors of differentiation
    • Overview on criticality of inputs and factors of differentiation
  • 2.3 Factors of disruption
    • Overview on factors of disruption
  • 2.4 Impact of drivers and challenges
    • Impact of drivers and challenges in 2024 and 2029

3 Market Landscape

  • 3.1 Market ecosystem
    • Parent Market
    • Data Table on - Parent Market
  • 3.2 Market characteristics
    • Market characteristics analysis
  • 3.3 Value chain analysis
    • Value chain analysis

4 Market Sizing

  • 4.1 Market definition
    • Offerings of companies included in the market definition
  • 4.2 Market segment analysis
    • Market segments
  • 4.3 Market size 2024
    • 4.4 Market outlook: Forecast for 2024-2029
      • Chart on Global - Market size and forecast 2024-2029 ($ billion)
      • Data Table on Global - Market size and forecast 2024-2029 ($ billion)
      • Chart on Global Market: Year-over-year growth 2024-2029 (%)
      • Data Table on Global Market: Year-over-year growth 2024-2029 (%)

    5 Historic Market Size

    • 5.1 Global Events Industry Market 2019 - 2023
      • Historic Market Size - Data Table on Global Events Industry Market 2019 - 2023 ($ billion)
    • 5.2 Type segment analysis 2019 - 2023
      • Historic Market Size - Type Segment 2019 - 2023 ($ billion)
    • 5.3 Source segment analysis 2019 - 2023
      • Historic Market Size - Source Segment 2019 - 2023 ($ billion)
    • 5.4 Geography segment analysis 2019 - 2023
      • Historic Market Size - Geography Segment 2019 - 2023 ($ billion)
    • 5.5 Country segment analysis 2019 - 2023
      • Historic Market Size - Country Segment 2019 - 2023 ($ billion)

    6 Qualitative Analysis

    • 6.1 Impact of AI in global events industry market

      7 Five Forces Analysis

      • 7.1 Five forces summary
        • Five forces analysis - Comparison between 2024 and 2029
      • 7.2 Bargaining power of buyers
        • Bargaining power of buyers - Impact of key factors 2024 and 2029
      • 7.3 Bargaining power of suppliers
        • Bargaining power of suppliers - Impact of key factors in 2024 and 2029
      • 7.4 Threat of new entrants
        • Threat of new entrants - Impact of key factors in 2024 and 2029
      • 7.5 Threat of substitutes
        • Threat of substitutes - Impact of key factors in 2024 and 2029
      • 7.6 Threat of rivalry
        • Threat of rivalry - Impact of key factors in 2024 and 2029
      • 7.7 Market condition
        • Chart on Market condition - Five forces 2024 and 2029

      8 Market Segmentation by Type

      • 8.1 Market segments
        • Chart on Type - Market share 2024-2029 (%)
        • Data Table on Type - Market share 2024-2029 (%)
      • 8.2 Comparison by Type
        • Chart on Comparison by Type
        • Data Table on Comparison by Type
      • 8.3 Corporate events and seminar - Market size and forecast 2024-2029
        • Chart on Corporate events and seminar - Market size and forecast 2024-2029 ($ billion)
        • Data Table on Corporate events and seminar - Market size and forecast 2024-2029 ($ billion)
        • Chart on Corporate events and seminar - Year-over-year growth 2024-2029 (%)
        • Data Table on Corporate events and seminar - Year-over-year growth 2024-2029 (%)
      • 8.4 Music concert - Market size and forecast 2024-2029
        • Chart on Music concert - Market size and forecast 2024-2029 ($ billion)
        • Data Table on Music concert - Market size and forecast 2024-2029 ($ billion)
        • Chart on Music concert - Year-over-year growth 2024-2029 (%)
        • Data Table on Music concert - Year-over-year growth 2024-2029 (%)
      • 8.5 Festival - Market size and forecast 2024-2029
        • Chart on Festival - Market size and forecast 2024-2029 ($ billion)
        • Data Table on Festival - Market size and forecast 2024-2029 ($ billion)
        • Chart on Festival - Year-over-year growth 2024-2029 (%)
        • Data Table on Festival - Year-over-year growth 2024-2029 (%)
      • 8.6 Sports - Market size and forecast 2024-2029
        • Chart on Sports - Market size and forecast 2024-2029 ($ billion)
        • Data Table on Sports - Market size and forecast 2024-2029 ($ billion)
        • Chart on Sports - Year-over-year growth 2024-2029 (%)
        • Data Table on Sports - Year-over-year growth 2024-2029 (%)
      • 8.7 Others - Market size and forecast 2024-2029
        • Chart on Others - Market size and forecast 2024-2029 ($ billion)
        • Data Table on Others - Market size and forecast 2024-2029 ($ billion)
        • Chart on Others - Year-over-year growth 2024-2029 (%)
        • Data Table on Others - Year-over-year growth 2024-2029 (%)
      • 8.8 Market opportunity by Type
        • Market opportunity by Type ($ billion)
        • Data Table on Market opportunity by Type ($ billion)

      9 Market Segmentation by Source

      • 9.1 Market segments
        • Chart on Source - Market share 2024-2029 (%)
        • Data Table on Source - Market share 2024-2029 (%)
      • 9.2 Comparison by Source
        • Chart on Comparison by Source
        • Data Table on Comparison by Source
      • 9.3 Sponsorship - Market size and forecast 2024-2029
        • Chart on Sponsorship - Market size and forecast 2024-2029 ($ billion)
        • Data Table on Sponsorship - Market size and forecast 2024-2029 ($ billion)
        • Chart on Sponsorship - Year-over-year growth 2024-2029 (%)
        • Data Table on Sponsorship - Year-over-year growth 2024-2029 (%)
      • 9.4 Ticket sale - Market size and forecast 2024-2029
        • Chart on Ticket sale - Market size and forecast 2024-2029 ($ billion)
        • Data Table on Ticket sale - Market size and forecast 2024-2029 ($ billion)
        • Chart on Ticket sale - Year-over-year growth 2024-2029 (%)
        • Data Table on Ticket sale - Year-over-year growth 2024-2029 (%)
      • 9.5 Others - Market size and forecast 2024-2029
        • Chart on Others - Market size and forecast 2024-2029 ($ billion)
        • Data Table on Others - Market size and forecast 2024-2029 ($ billion)
        • Chart on Others - Year-over-year growth 2024-2029 (%)
        • Data Table on Others - Year-over-year growth 2024-2029 (%)
      • 9.6 Market opportunity by Source
        • Market opportunity by Source ($ billion)
        • Data Table on Market opportunity by Source ($ billion)

      10 Market Segmentation by Revenue Type

      • 10.1 Market segments
        • Chart on Revenue Type - Market share (2024-2029) (%)
        • Data Table on Revenue Type - Market share (2024-2029) (%)
        • Chart on Media and Licensing Revenue - Market size and forecast (2024-2029) ($ million)
        • Data Table on Media and Licensing Revenue - Market size and forecast (2024-2029) ($ million)
        • Chart on Media and Licensing Revenue - Year-over-year growth (2024-2029) (%)
        • Data Table on Media and Licensing Revenue - Year-over-year growth (2024-2029) (%)
      • 10.2 Comparison by Revenue Type
        • Chart on Comparison by Revenue Type
        • Data Table on Comparison by Revenue Type
        • Chart on Others - Market size and forecast (2024-2029) ($ million)
        • Data Table on Others - Market size and forecast (2024-2029) ($ million)
        • Chart on Others - Year-over-year growth (2024-2029) (%)
        • Data Table on Others - Year-over-year growth (2024-2029) (%)
      • 10.3 Ticket Sale - Market size and forecast (2024-2029)
        • Chart on Ticket Sale - Market size and forecast (2024-2029) ($ million)
        • Data Table on Ticket Sale - Market size and forecast (2024-2029) ($ million)
        • Chart on Ticket Sale - Year-over-year growth (2024-2029) (%)
        • Data Table on Ticket Sale - Year-over-year growth (2024-2029) (%)
        • Market opportunity by $segment_name ($ million)
        • Data Table on Market opportunity by $segment_name ($ million)
      • 10.4 Sponsorship - Market size and forecast (2024-2029)
        • Chart on Sponsorship - Market size and forecast (2024-2029) ($ million)
        • Data Table on Sponsorship - Market size and forecast (2024-2029) ($ million)
        • Chart on Sponsorship - Year-over-year growth (2024-2029) (%)
        • Data Table on Sponsorship - Year-over-year growth (2024-2029) (%)
      • 10.5 Food and Beverage - Market size and forecast (2024-2029)
        • Chart on Food and Beverage - Market size and forecast (2024-2029) ($ million)
        • Data Table on Food and Beverage - Market size and forecast (2024-2029) ($ million)
        • Chart on Food and Beverage - Year-over-year growth (2024-2029) (%)
        • Data Table on Food and Beverage - Year-over-year growth (2024-2029) (%)
      • 10.6 Advertising - Market size and forecast (2024-2029)
        • Chart on Advertising - Market size and forecast (2024-2029) ($ million)
        • Data Table on Advertising - Market size and forecast (2024-2029) ($ million)
        • Chart on Advertising - Year-over-year growth (2024-2029) (%)
        • Data Table on Advertising - Year-over-year growth (2024-2029) (%)
      • 10.7 Merchandise Sales - Market size and forecast (2024-2029)
        • Chart on Merchandise Sales - Market size and forecast (2024-2029) ($ million)
        • Data Table on Merchandise Sales - Market size and forecast (2024-2029) ($ million)
        • Chart on Merchandise Sales - Year-over-year growth (2024-2029) (%)
        • Data Table on Merchandise Sales - Year-over-year growth (2024-2029) (%)
      • 10.8 Membership Fees - Market size and forecast (2024-2029)
        • Chart on Membership Fees - Market size and forecast (2024-2029) ($ million)
        • Data Table on Membership Fees - Market size and forecast (2024-2029) ($ million)
        • Chart on Membership Fees - Year-over-year growth (2024-2029) (%)
        • Data Table on Membership Fees - Year-over-year growth (2024-2029) (%)
      • 10.9 Participation Fees - Market size and forecast (2024-2029)
        • Chart on Participation Fees - Market size and forecast (2024-2029) ($ million)
        • Data Table on Participation Fees - Market size and forecast (2024-2029) ($ million)
        • Chart on Participation Fees - Year-over-year growth (2024-2029) (%)
        • Data Table on Participation Fees - Year-over-year growth (2024-2029) (%)

      11 Market Segmentation by Age Group

      • 11.1 Market segments
        • Chart on Age Group - Market share (2024-2029) (%)
        • Data Table on Age Group - Market share (2024-2029) (%)
      • 11.2 Comparison by Age Group
        • Chart on Comparison by Age Group
        • Data Table on Comparison by Age Group
      • 11.3 Below 20 Years - Market size and forecast (2024-2029)
        • Chart on Below 20 Years - Market size and forecast (2024-2029) ($ million)
        • Data Table on Below 20 Years - Market size and forecast (2024-2029) ($ million)
        • Chart on Below 20 Years - Year-over-year growth (2024-2029) (%)
        • Data Table on Below 20 Years - Year-over-year growth (2024-2029) (%)
      • 21 to 40 Years - Market size and forecast (2024-2029)
        • Chart on 21 to 40 Years - Market size and forecast (2024-2029) ($ million)
        • Data Table on 21 to 40 Years - Market size and forecast (2024-2029) ($ million)
        • Chart on 21 to 40 Years - Year-over-year growth (2024-2029) (%)
        • Data Table on 21 to 40 Years - Year-over-year growth (2024-2029) (%)
      • 11.5 Above 40 Years - Market size and forecast (2024-2029)
        • Chart on Above 40 Years - Market size and forecast (2024-2029) ($ million)
        • Data Table on Above 40 Years - Market size and forecast (2024-2029) ($ million)
        • Chart on Above 40 Years - Year-over-year growth (2024-2029) (%)
        • Data Table on Above 40 Years - Year-over-year growth (2024-2029) (%)
      • 11.6 Market opportunity by Age Group
        • Market opportunity by $segment_name ($ million)
        • Data Table on Market opportunity by $segment_name ($ million)

      12 Market Segmentation by Event Location

      • 12.1 Market segments
        • Chart on Event Location - Market share (2024-2029) (%)
        • Data Table on Event Location - Market share (2024-2029) (%)
      • 12.2 Comparison by Event Location
        • Chart on Comparison by Event Location
        • Data Table on Comparison by Event Location
      • 12.3 Tier 1 Cities - Market size and forecast (2024-2029)
        • Chart on Tier 1 Cities - Market size and forecast (2024-2029) ($ million)
        • Data Table on Tier 1 Cities - Market size and forecast (2024-2029) ($ million)
        • Chart on Tier 1 Cities - Year-over-year growth (2024-2029) (%)
        • Data Table on Tier 1 Cities - Year-over-year growth (2024-2029) (%)
      • 12.4 Tier 2 Cities - Market size and forecast (2024-2029)
        • Chart on Tier 2 Cities - Market size and forecast (2024-2029) ($ million)
        • Data Table on Tier 2 Cities - Market size and forecast (2024-2029) ($ million)
        • Chart on Tier 2 Cities - Year-over-year growth (2024-2029) (%)
        • Data Table on Tier 2 Cities - Year-over-year growth (2024-2029) (%)
      • 12.5 Tier 3 Cities - Market size and forecast (2024-2029)
        • Chart on Tier 3 Cities - Market size and forecast (2024-2029) ($ million)
        • Data Table on Tier 3 Cities - Market size and forecast (2024-2029) ($ million)
        • Chart on Tier 3 Cities - Year-over-year growth (2024-2029) (%)
        • Data Table on Tier 3 Cities - Year-over-year growth (2024-2029) (%)
      • 12.6 Market opportunity by Event Location
        • Market opportunity by $segment_name ($ million)
        • Data Table on Market opportunity by $segment_name ($ million)

      13 Customer Landscape

      • 13.1 Customer landscape overview
        • Analysis of price sensitivity, lifecycle, customer purchase basket, adoption rates, and purchase criteria

      14 Geographic Landscape

      • 14.1 Geographic segmentation
        • Chart on Market share by geography 2024-2029 (%)
        • Data Table on Market share by geography 2024-2029 (%)
      • 14.2 Geographic comparison
        • Chart on Geographic comparison
        • Data Table on Geographic comparison
      • 14.3 Europe - Market size and forecast 2024-2029
        • Chart on Europe - Market size and forecast 2024-2029 ($ billion)
        • Data Table on Europe - Market size and forecast 2024-2029 ($ billion)
        • Chart on Europe - Year-over-year growth 2024-2029 (%)
        • Data Table on Europe - Year-over-year growth 2024-2029 (%)
      • 14.4 North America - Market size and forecast 2024-2029
        • Chart on North America - Market size and forecast 2024-2029 ($ billion)
        • Data Table on North America - Market size and forecast 2024-2029 ($ billion)
        • Chart on North America - Year-over-year growth 2024-2029 (%)
        • Data Table on North America - Year-over-year growth 2024-2029 (%)
      • 14.5 APAC - Market size and forecast 2024-2029
        • Chart on APAC - Market size and forecast 2024-2029 ($ billion)
        • Data Table on APAC - Market size and forecast 2024-2029 ($ billion)
        • Chart on APAC - Year-over-year growth 2024-2029 (%)
        • Data Table on APAC - Year-over-year growth 2024-2029 (%)
      • 14.6 Middle East and Africa - Market size and forecast 2024-2029
        • Chart on Middle East and Africa - Market size and forecast 2024-2029 ($ billion)
        • Data Table on Middle East and Africa - Market size and forecast 2024-2029 ($ billion)
        • Chart on Middle East and Africa - Year-over-year growth 2024-2029 (%)
        • Data Table on Middle East and Africa - Year-over-year growth 2024-2029 (%)
      • 14.7 South America - Market size and forecast 2024-2029
        • Chart on South America - Market size and forecast 2024-2029 ($ billion)
        • Data Table on South America - Market size and forecast 2024-2029 ($ billion)
        • Chart on South America - Year-over-year growth 2024-2029 (%)
        • Data Table on South America - Year-over-year growth 2024-2029 (%)
      • 14.8 US - Market size and forecast 2024-2029
        • Chart on US - Market size and forecast 2024-2029 ($ billion)
        • Data Table on US - Market size and forecast 2024-2029 ($ billion)
        • Chart on US - Year-over-year growth 2024-2029 (%)
        • Data Table on US - Year-over-year growth 2024-2029 (%)
      • 14.9 Germany - Market size and forecast 2024-2029
        • Chart on Germany - Market size and forecast 2024-2029 ($ billion)
        • Data Table on Germany - Market size and forecast 2024-2029 ($ billion)
        • Chart on Germany - Year-over-year growth 2024-2029 (%)
        • Data Table on Germany - Year-over-year growth 2024-2029 (%)
      • 14.10 UK - Market size and forecast 2024-2029
        • Chart on UK - Market size and forecast 2024-2029 ($ billion)
        • Data Table on UK - Market size and forecast 2024-2029 ($ billion)
        • Chart on UK - Year-over-year growth 2024-2029 (%)
        • Data Table on UK - Year-over-year growth 2024-2029 (%)
      • 14.11 France - Market size and forecast 2024-2029
        • Chart on France - Market size and forecast 2024-2029 ($ billion)
        • Data Table on France - Market size and forecast 2024-2029 ($ billion)
        • Chart on France - Year-over-year growth 2024-2029 (%)
        • Data Table on France - Year-over-year growth 2024-2029 (%)
      • 14.12 China - Market size and forecast 2024-2029
        • Chart on China - Market size and forecast 2024-2029 ($ billion)
        • Data Table on China - Market size and forecast 2024-2029 ($ billion)
        • Chart on China - Year-over-year growth 2024-2029 (%)
        • Data Table on China - Year-over-year growth 2024-2029 (%)
      • 14.13 Canada - Market size and forecast 2024-2029
        • Chart on Canada - Market size and forecast 2024-2029 ($ billion)
        • Data Table on Canada - Market size and forecast 2024-2029 ($ billion)
        • Chart on Canada - Year-over-year growth 2024-2029 (%)
        • Data Table on Canada - Year-over-year growth 2024-2029 (%)
      • 14.14 Japan - Market size and forecast 2024-2029
        • Chart on Japan - Market size and forecast 2024-2029 ($ billion)
        • Data Table on Japan - Market size and forecast 2024-2029 ($ billion)
        • Chart on Japan - Year-over-year growth 2024-2029 (%)
        • Data Table on Japan - Year-over-year growth 2024-2029 (%)
      • 14.15 Spain - Market size and forecast 2024-2029
        • Chart on Spain - Market size and forecast 2024-2029 ($ billion)
        • Data Table on Spain - Market size and forecast 2024-2029 ($ billion)
        • Chart on Spain - Year-over-year growth 2024-2029 (%)
        • Data Table on Spain - Year-over-year growth 2024-2029 (%)
      • 14.16 Brazil - Market size and forecast 2024-2029
        • Chart on Brazil - Market size and forecast 2024-2029 ($ billion)
        • Data Table on Brazil - Market size and forecast 2024-2029 ($ billion)
        • Chart on Brazil - Year-over-year growth 2024-2029 (%)
        • Data Table on Brazil - Year-over-year growth 2024-2029 (%)
      • 14.17 India - Market size and forecast 2024-2029
        • Chart on India - Market size and forecast 2024-2029 ($ billion)
        • Data Table on India - Market size and forecast 2024-2029 ($ billion)
        • Chart on India - Year-over-year growth 2024-2029 (%)
        • Data Table on India - Year-over-year growth 2024-2029 (%)
      • 14.18 Market opportunity by geography
        • Market opportunity by geography ($ billion)
        • Data Tables on Market opportunity by geography ($ billion)

      15 Drivers, Challenges, and Opportunity/Restraints

      • 15.1 Market drivers
        • 15.2 Market challenges
          • 15.3 Impact of drivers and challenges
            • Impact of drivers and challenges in 2024 and 2029
          • 15.4 Market opportunities/restraints

            16 Competitive Landscape

            • 16.1 Overview
              • 16.2 Competitive Landscape
                • Overview on criticality of inputs and factors of differentiation
              • 16.3 Landscape disruption
                • Overview on factors of disruption
              • 16.4 Industry risks
                • Impact of key risks on business

              17 Competitive Analysis

              • 17.1 Companies profiled
                • Companies covered
              • 17.2 Company ranking index
                • Company ranking index
              • 17.3 Market positioning of companies
                • Matrix on companies position and classification
              • 17.4 Access Destination Services
                • Access Destination Services - Overview
                • Access Destination Services - Product / Service
                • Access Destination Services - Key offerings
                • SWOT
              • 17.5 Anschutz Entertainment Group Inc.
                • Anschutz Entertainment Group Inc. - Overview
                • Anschutz Entertainment Group Inc. - Product / Service
                • Anschutz Entertainment Group Inc. - Key offerings
                • SWOT
              • 17.6 ATPI Ltd.
                • ATPI Ltd. - Overview
                • ATPI Ltd. - Product / Service
                • ATPI Ltd. - Key offerings
                • SWOT
              • 17.7 CL EVENTS AND WEDDINGS
                • CL EVENTS AND WEDDINGS - Overview
                • CL EVENTS AND WEDDINGS - Product / Service
                • CL EVENTS AND WEDDINGS - Key offerings
                • SWOT
              • 17.8 Clarion Events Ltd.
                • Clarion Events Ltd. - Overview
                • Clarion Events Ltd. - Product / Service
                • Clarion Events Ltd. - Key offerings
                • SWOT
              • 17.9 CS Ellis
                • CS Ellis - Overview
                • CS Ellis - Product / Service
                • CS Ellis - Key offerings
                • SWOT
              • 17.10 Cvent Holding Corp.
                • Cvent Holding Corp. - Overview
                • Cvent Holding Corp. - Product / Service
                • Cvent Holding Corp. - Key news
                • Cvent Holding Corp. - Key offerings
                • SWOT
              • 17.11 DRP Holdings Ltd.
                • DRP Holdings Ltd. - Overview
                • DRP Holdings Ltd. - Product / Service
                • DRP Holdings Ltd. - Key offerings
                • SWOT
              • 17.12 Entertaining Asia Ltd.
                • Entertaining Asia Ltd. - Overview
                • Entertaining Asia Ltd. - Product / Service
                • Entertaining Asia Ltd. - Key offerings
                • SWOT
              • 17.13 Liberty Media Corp.
                • Liberty Media Corp. - Overview
                • Liberty Media Corp. - Product / Service
                • Liberty Media Corp. - Key offerings
                • SWOT
              • 17.14 Questex Media Group LLC
                • Questex Media Group LLC - Overview
                • Questex Media Group LLC - Product / Service
                • Questex Media Group LLC - Key offerings
                • SWOT
              • 17.15 Regpack Inc.
                • Regpack Inc. - Overview
                • Regpack Inc. - Product / Service
                • Regpack Inc. - Key offerings
                • SWOT
              • 17.16 RELX Plc
                • RELX Plc - Overview
                • RELX Plc - Business segments
                • RELX Plc - Key offerings
                • RELX Plc - Segment focus
                • SWOT
              • 17.17 Riviera Events
                • Riviera Events - Overview
                • Riviera Events - Product / Service
                • Riviera Events - Key offerings
                • SWOT
              • 17.18 The Freeman Co.
                • The Freeman Co. - Overview
                • The Freeman Co. - Product / Service
                • The Freeman Co. - Key offerings
                • SWOT

              18 Appendix

              • 18.1 Scope of the report
                • 18.2 Inclusions and exclusions checklist
                  • Inclusions checklist
                  • Exclusions checklist
                • 18.3 Currency conversion rates for US$
                  • Currency conversion rates for US$
                • 18.4 Research methodology
                  • Research methodology
                • 18.5 Data procurement
                  • Information sources
                • 18.6 Data validation
                  • Data validation
                • 18.7 Validation techniques employed for market sizing
                  • Validation techniques employed for market sizing
                • 18.8 Data synthesis
                  • Data synthesis
                • 18.9 360 degree market analysis
                  • 360 degree market analysis
                • 18.10 List of abbreviations
                  • List of abbreviations

                Research Methodology

                Technavio presents a detailed picture of the market by way of study, synthesis, and summation of data from multiple sources. The analysts have presented the various facets of the market with a particular focus on identifying the key industry influencers. The data thus presented is comprehensive, reliable, and the result of extensive research, both primary and secondary.

                INFORMATION SOURCES

                Primary sources

                • Manufacturers and suppliers
                • Channel partners
                • Industry experts
                • Strategic decision makers

                Secondary sources

                • Industry journals and periodicals
                • Government data
                • Financial reports of key industry players
                • Historical data
                • Press releases

                DATA ANALYSIS

                Data Synthesis

                • Collation of data
                • Estimation of key figures
                • Analysis of derived insights

                Data Validation

                • Triangulation with data models
                • Reference against proprietary databases
                • Corroboration with industry experts

                REPORT WRITING

                Qualitative

                • Market drivers
                • Market challenges
                • Market trends
                • Five forces analysis

                Quantitative

                • Market size and forecast
                • Market segmentation
                • Geographical insights
                • Competitive landscape

                Interested in this report?

                Get your sample now to see our research methodology and insights!

                Download Now

                Frequently Asked Questions

                Events Industry market growth will increase by $ 1067.1 bn during 2025-2029 .

                The Events Industry market is expected to grow at a CAGR of 13.5% during 2025-2029 .

                Events Industry market is segmented by Type( Corporate events and seminar, Music concert, Festival, Sports, Others) Source( Sponsorship, Ticket sale, Others, Middle East and Africa, South America)

                Access Destination Services, Anschutz Entertainment Group Inc., ATPI Ltd., BCD Travel Services BV, CL EVENTS AND WEDDINGS, Clarion Events Ltd., CS Ellis, Cvent Holding Corp., DRP Holdings Ltd., Entertaining Asia Ltd., Event Rhythm, Group Seven Events Ltd., Liberty Media Corp., Questex Media Group LLC, Regpack Inc., RELX Plc, Riviera Events, Theism Events, The Freeman Co. are a few of the key vendors in the Events Industry market.

                Europe will register the highest growth rate of 34% among the other regions. Therefore, the Events Industry market in Europe is expected to garner significant business opportunities for the vendors during the forecast period.

                US, Germany, UK, France, China, Canada, Japan, Spain, Brazil, India

                • Rise in number of corporate eventsThe increasing number of corporate events such as conferences is the driving factor this market.
                • training is the driving factor this market.
                • seminars is the driving factor this market.
                • and fundraisers has been driving the global events industry market. This trend is expected to continue during the forecast period. Corporate events are conducted by organizations for employees is the driving factor this market.
                • business partners is the driving factor this market.
                • and current and future clients. Events are also organized for lead nurturing and lead generation is the driving factor this market.
                • launching or marketing new products is the driving factor this market.
                • and celebrating the success of products and services. In many cases is the driving factor this market.
                • organizations bring together company employees is the driving factor this market.
                • assist larger marketing or sales activities is the driving factor this market.
                • reward team accomplishments is the driving factor this market.
                • or amuse top executives. However is the driving factor this market.
                • not all corporate gatherings must be in person. Virtual meetings and event planning are excellent options for these types of gatherings. Training and internal team meetings will emerge as one of the predominant areas for growth during the forecast period due to budget constraints involved in individual and face-to-face discussions. Thus is the driving factor this market.
                • organizations use corporate events to ensure efficiency and cost-effectiveness is the driving factor this market.
                • save advertising costs is the driving factor this market.
                • and help organizations reach out to many viewers. These factors will drive the growth of the global events industry market during the forecast period. is the driving factor this market.

                The Events Industry market vendors should focus on grabbing business opportunities from the Corporate events and seminar segment as it accounted for the largest market share in the base year.