Liquefied Natural Gas (LNG) Market Analysis North America, Middle East and Africa, Europe, APAC, South America - US, Qatar, Russia, China, Norway, Saudi Arabia, Canada, Japan, UAE, The Netherlands - Size and Forecast 2025-2029

Liquefied Natural Gas (LNG) Market Analysis North America, Middle East and Africa, Europe, APAC, South America - US, Qatar, Russia, China, Norway, Saudi Arabia, Canada, Japan, UAE, The Netherlands - Size and Forecast 2025-2029

Published: Feb 2025 220 Pages SKU: IRTNTR71863

Market Overview at a Glance

$27.79 B
Market Opportunity
8%
CAGR
6.8
YoY growth 2024-2025(%)

Liquefied Natural Gas (LNG) Market Size 2025-2029

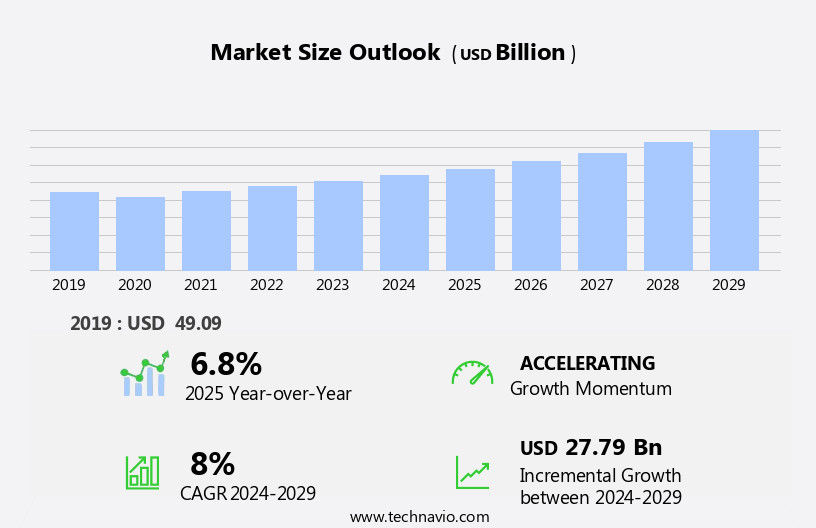
The liquefied natural gas (LNG) market size is forecast to increase by USD 27.79 billion, at a CAGR of 8% between 2024 and 2029.

  • The market is experiencing significant growth, driven by the surge in LNG production and the increasing demand for LNG bunkering. The production increase is due to the expansion of LNG infrastructure in key producing regions, enabling greater access to natural gas resources and facilitating the liquefaction process. Simultaneously, the demand for LNG bunkering is rising as more shipping companies adopt LNG as a cleaner alternative fuel for their vessels, in response to stricter environmental regulations. However, the LNG market faces challenges, including the fluctuations in global oil and gas prices. These price volatilities can impact the profitability of LNG projects, as the price of LNG is closely linked to the price of oil.
  • Additionally, the infrastructure required for LNG production, transportation, and regasification is capital-intensive and complex, posing challenges for companies looking to enter the market. Furthermore, safety concerns and the need for specialized expertise to handle LNG can create operational challenges for companies. To capitalize on market opportunities and navigate these challenges effectively, companies must remain agile, invest in innovative technologies, and collaborate with industry partners to optimize their operations and mitigate risks.

What will be the Size of the Liquefied Natural Gas (LNG) Market during the forecast period?

Liquefied Natural Gas (LNG) Market Size

Explore in-depth regional segment analysis with market size data - historical 2019-2023 and forecasts 2025-2029 - in the full report.  
Request Free Sample

The market continues to evolve, driven by shifting consumer demands, technological advancements, and regulatory changes. LNG metering and insulation technologies are crucial components in ensuring accurate measurement and efficient storage of this cryogenic fuel. LNG derivatives and contracts provide flexibility in managing price risks and securing supply. Industrial applications of LNG span various sectors, including power generation, heavy-duty vehicles, and processing industries. LNG valves, membranes, and pumps are essential components in LNG infrastructure, enabling the safe and efficient handling of this fuel. Carbon capture and utilization are emerging applications, offering potential environmental benefits. LNG pricing remains volatile due to market dynamics, supply and demand imbalances, and geopolitical factors.

Transportation, from production sites to end-users, involves complex logistics, including LNG tankers, pipelines, and terminals. Regulations and safety standards are continually evolving to address emerging challenges and ensure the safe and sustainable use of LNG. LNG vaporization and shipping technologies are essential for converting LNG back into its gaseous state for use as a fuel. LNG bunkering and supply chain optimization are crucial for the growing use of LNG as a marine fuel. LNG utilization in residential applications and export markets is expanding, driven by innovation and evolving consumer preferences. LNG production processes, such as gas-to-liquids (GTL), are advancing to improve efficiency and reduce emissions.

LNG hydrogen and fuel cells are emerging applications, offering potential benefits in decarbonizing energy systems. The LNG market's continuous dynamism underscores the importance of staying informed about the latest trends and developments.

How is this Liquefied Natural Gas (LNG) Industry segmented?

The liquefied natural gas (lng) industry research report provides comprehensive data (region-wise segment analysis), with forecasts and estimates in "USD billion" for the period 2025-2029, as well as historical data from 2019-2023 for the following segments.

  • End-user
    • Power
    • Industry
    • Others
  • Application
    • Off-grid power plants
    • Transportation
    • Industrial and manufacturing
    • Marine fuel
    • Others
  • Geography
    • North America
      • US
      • Canada
    • Europe
      • Norway
      • Russia
      • The Netherlands
    • Middle East and Africa
      • Qatar
      • UAE
    • APAC
      • China
      • Japan
    • Rest of World (ROW)

By End-user Insights

The power segment is estimated to witness significant growth during the forecast period.

Liquefied Natural Gas (LNG) is a critical component of the global energy landscape, with increasing demand driven by various factors. The shift towards cleaner fuels for power generation and industrial applications is a significant trend, as LNG emits fewer greenhouse gases compared to coal and oil. LNG cryogenics technology enables the liquefaction, storage, and transportation of natural gas in its liquid form, making it a versatile fuel for various sectors. LNG infrastructure, including regasification terminals and pipelines, is essential for importing and distributing LNG to consumers. Safety standards are stringently enforced to ensure the safe handling and transportation of LNG.

LNG sensors and metering systems enable accurate measurement and monitoring of LNG quantities. LNG is gaining traction as a marine fuel due to its lower emissions compared to traditional marine fuels. LNG hydrogen blending is an emerging trend, offering potential carbon capture and utilization benefits. LNG derivatives, such as ethane and propane, are used in industrial applications, while LNG contracts and pricing mechanisms provide market stability. LNG production involves the extraction and processing of natural gas into its liquid form. LNG transportation, including tankers and pipelines, ensures the delivery of LNG to consumers. LNG vaporization and regasification enable the conversion of LNG back into its gaseous state for use in power generation, industrial applications, and residential use.

LNG regulations aim to ensure safety and environmental sustainability. LNG utilization in heavy-duty vehicles and power generation is increasing, while LNG fuel cells offer potential for zero-emission transportation. LNG boil-off, or the loss of LNG during storage and transportation, is a challenge being addressed through technological innovations. LNG demand is expected to grow due to its versatility and environmental benefits. LNG market volatility is influenced by various factors, including supply and demand dynamics, geopolitical tensions, and technological advancements. LNG pipelines and gas-to-liquids (GTL) technology are alternative methods for transporting and producing LNG, respectively. Innovations in LNG technology, such as membranes, valves, pumps, and insulation, are driving efficiency and reducing costs.

LNG bunkering and supply chain optimization are essential for ensuring the smooth delivery of LNG to consumers. The environmental impact of LNG production and use is a critical consideration, with efforts being made to reduce emissions and improve sustainability.

Liquefied Natural Gas (LNG) Market Size

Request Free Sample

The Power segment was valued at USD 17.90 billion in 2019 and showed a gradual increase during the forecast period.

Regional Analysis

North America is estimated to contribute 43% to the growth of the global market during the forecast period. Technavio's analysts have elaborately explained the regional trends and drivers that shape the market during the forecast period.

Liquefied Natural Gas (LNG) Market Share by Geography

 Request Free Sample

The LNG market in North America is driven by the increased consumption in countries such as the US, Canada, and Mexico. In the US, the shift from coal to natural gas in the power sector has significantly boosted its demand. Moreover, the competitive pricing of natural gas for industrial applications further fuels its usage. Mexico, which heavily relies on natural gas for primary energy consumption, is another major consumer in the region. The US shale revolution has revolutionized the oil and gas industry, making it the largest producer of natural gas globally during the forecast period.

LNG infrastructure, including regasification terminals and storage facilities, plays a crucial role in the market. Advanced technologies such as LNG cryogenics, sensors, and insulation ensure efficient production, transportation, and utilization of LNG. LNG is increasingly being used as a marine fuel, and safety standards are stringently enforced to ensure safe operations. The LNG market is also witnessing innovation in various areas, such as LNG hydrogen blending, carbon capture, and utilization. LNG derivatives and contracts are essential components of the market, providing price stability and risk management solutions. LNG is finding applications in industrial processes, power generation, and heavy-duty vehicles, among others.

The LNG supply chain involves various players, including producers, processors, transporters, and distributors. LNG pricing is influenced by various factors, including market volatility and transportation costs. LNG transportation is carried out through pipelines, LNG carriers, and bunkering vessels. The environmental impact of LNG is a significant concern, and regulations are being implemented to minimize its carbon footprint. Biomethane and GTL are emerging as alternative sources of LNG. The market is expected to continue its growth trajectory, driven by increasing demand, technological advancements, and regulatory support.

Market Dynamics

Our researchers analyzed the data with 2024 as the base year, along with the key drivers, trends, and challenges. A holistic analysis of drivers will help companies refine their marketing strategies to gain a competitive advantage.

What are the key market drivers leading to the rise in the adoption of Liquefied Natural Gas (LNG) Industry?

  • The significant rise in Liquified Natural Gas (LNG) production serves as the primary catalyst for market growth. 
  • The global LNG market is experiencing significant growth due to the increasing supply of unconventional natural gas resources, such as coalbed methane, shale gas, and tight gas. According to the US Energy Information Administration (EIA), the US has been a major contributor to this trend since 2008, with shale gas production increasing from 68% to 71% between 2018 and 2019. By 2023, the US is expected to continue leading in shale gas production, with the Marcellus and Utica shale plays being the top producers, followed by the Permian Basin. The International Energy Agency (IEA) predicts that the US will account for 49% of global natural gas output growth by 2023.
  • LNG infrastructure, including cryogenics, regasification, storage, and distribution, has been expanding to meet the demand for this cleaner-burning fossil fuel. LNG is increasingly being used as a marine fuel and for hydrogen production. Safety standards are a critical consideration in the LNG industry, with sensors and advanced technologies playing a crucial role in ensuring safe operations. LNG emissions are a focus of ongoing research and development, as the industry seeks to reduce its carbon footprint and meet sustainability goals. LNG import and export have become essential components of the global energy market, with LNG tankers transporting the fuel across the world.
  • Despite the challenges of LNG cryogenics and the need for specialized infrastructure, the benefits of LNG as a cleaner-burning fuel and a reliable energy source are driving its adoption in various industries.

What are the market trends shaping the Liquefied Natural Gas (LNG) Industry?

  • The demand for liquefied natural gas (LNG) bunkering is experiencing significant growth, representing a noteworthy market trend in the maritime industry. This increasing need for LNG as a cleaner fuel source is driving innovation and expansion in the LNG bunkering sector.
  • Liquefied Natural Gas (LNG) is gaining momentum as a sustainable marine fuel, driving the development of LNG bunkering facilities to reduce emissions from shipping activities. According to the International Energy Agency (IEA), heavy fuel oil (HFO) accounted for 79% of marine fuel mix in 2023, making it the most widely used marine fuel. However, the increasing focus on environmental sustainability and the need to reduce sulfur emissions have led to the exploration of cleaner alternatives, such as LNG. LNG utilization in industrial applications is also on the rise, with the demand for insulation, valves, pumps, and membranes driving the market growth.
  • LNG metering, a crucial aspect of LNG infrastructure, ensures accurate measurement and delivery of LNG, contributing to the market's expansion. The LNG market dynamics are influenced by various factors, including LNG pricing, transportation, production, and carbon capture. The development of advanced LNG technologies, such as membrane separation and cryogenic distillation, is expected to further boost the market growth. LNG derivatives, such as LNG options and futures contracts, offer price risk management solutions, providing stability to the LNG market. The integration of LNG into the power sector and its use as a feedstock in the chemical industry are also expanding the market's scope.
  • In conclusion, the LNG market is witnessing significant growth due to its increasing use as a marine fuel and in various industrial applications. The market's expansion is driven by factors such as technological advancements, pricing dynamics, and the need for environmental sustainability.

What challenges does the Liquefied Natural Gas (LNG) Industry face during its growth?

  • The volatility of global oil and gas prices poses a significant challenge to the industry's growth trajectory. 
  • The LNG market is a significant component of the global energy sector, encompassing various aspects such as LNG vaporization, processing, shipping, power generation, and regulations. LNG vaporization converts natural gas into liquid form for transportation and storage. LNG shipping involves transporting this liquid via specialized vessels to various destinations. LNG heavy-duty vehicles utilize this fuel for transportation, contributing to the reduction of greenhouse gas emissions. LNG hedging is a risk management strategy used by market participants to protect against price volatility. LNG power generation is a cleaner alternative to traditional coal-fired power plants, making it an attractive option for energy producers and consumers.
  • LNG processing involves extracting LNG from natural gas through a series of cooling processes. Regulations play a crucial role in the LNG market, with various international and national bodies setting standards for safety, environmental impact, and trade. LNG biomethane, derived from renewable sources, is gaining popularity due to its lower carbon footprint and potential to reduce greenhouse gas emissions. LNG terminals are essential infrastructure for the LNG market, facilitating the loading and unloading of LNG vessels and the transfer of LNG to pipelines or trucks. LNG spot prices reflect the current market conditions and can be volatile due to various factors, including supply and demand imbalances, geopolitical events, and weather conditions.
  • The LNG market's dynamics are influenced by various factors, including production costs, transportation costs, government policies, and technological advancements. Companies in the LNG value chain face challenges such as high capital costs, operational risks, and regulatory compliance. Despite these challenges, the LNG market continues to grow, driven by increasing demand for cleaner energy sources and the need to diversify energy supplies.

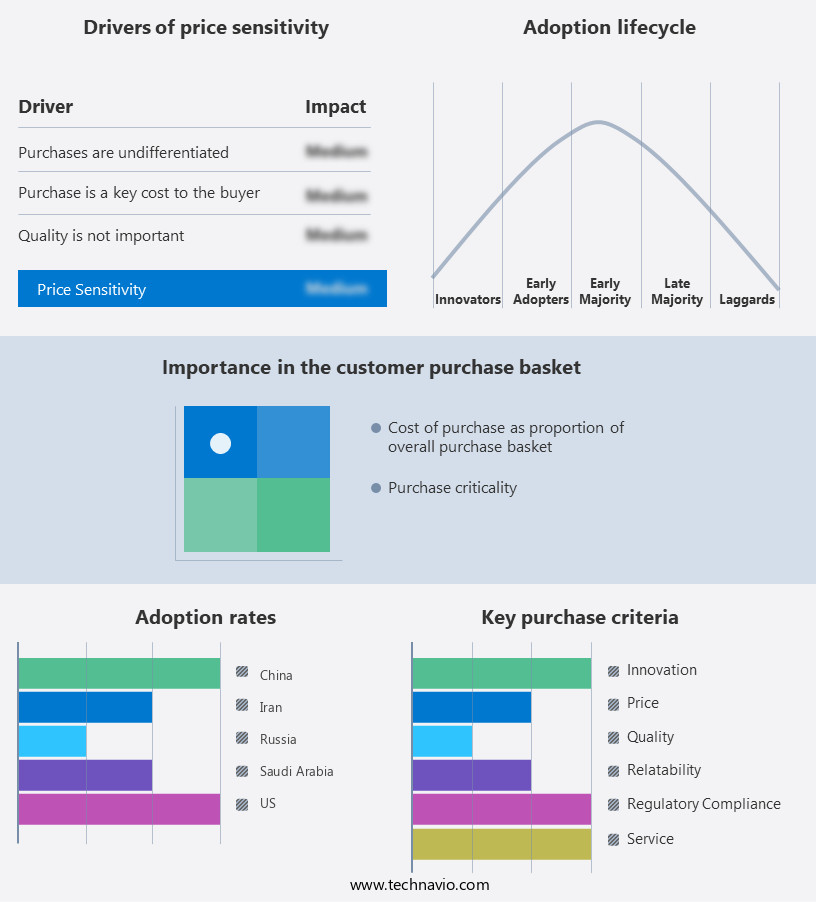
Exclusive Customer Landscape

The liquefied natural gas (LNG) market forecasting report includes the adoption lifecycle of the market, covering from the innovator's stage to the laggard's stage. It focuses on adoption rates in different regions based on penetration. Furthermore, the liquefied natural gas (LNG) market report also includes key purchase criteria and drivers of price sensitivity to help companies evaluate and develop their market growth analysis strategies.

Liquefied Natural Gas (LNG) Market Share by Geography

 Customer Landscape

Key Companies & Market Insights

Companies are implementing various strategies, such as strategic alliances, liquefied natural gas (lng) market forecast, partnerships, mergers and acquisitions, geographical expansion, and product/service launches, to enhance their presence in the industry.

Bechtel Corp. - The company specializes in delivering comprehensive liquefied natural gas (LNG) solutions, encompassing engineering, procurement, and construction (EPC) services, alongside advanced hydrocarbon technology for LNG liquefaction.

The industry research and growth report includes detailed analyses of the competitive landscape of the market and information about key companies, including:

  • Bechtel Corp.
  • BP Plc
  • Cheniere Energy Inc.
  • Chevron Corp.
  • China Petrochemical Corp.
  • Eni SpA
  • Equinor ASA
  • Exxon Mobil Corp.
  • Fluor Corp.
  • Freeport LNG Development LP
  • Gasum Oy
  • INPEX Corp.
  • PAO NOVATEK
  • PetroChina Co. Ltd.
  • Qatargas Operating Co. Ltd.
  • SEFE Energy Ltd.
  • Sempra
  • Shell plc
  • TechnipFMC plc
  • TotalEnergies SE

Qualitative and quantitative analysis of companies has been conducted to help clients understand the wider business environment as well as the strengths and weaknesses of key industry players. Data is qualitatively analyzed to categorize companies as pure play, category-focused, industry-focused, and diversified; it is quantitatively analyzed to categorize companies as dominant, leading, strong, tentative, and weak.

Recent Development and News in Liquefied Natural Gas (LNG) Market

  • In February 2023, Qatar Petroleum and ExxonMobil announced a significant expansion of their global LNG partnership. The two companies signed an agreement to increase their joint venture's production capacity from 7.5 million tons per annum (mtpa) to 11 mtpa at the Goldboro LNG project in Nova Scotia, Canada (ExxonMobil press release, 2023). This strategic collaboration represents a substantial investment in LNG production and underscores the growing demand for cleaner energy sources.
  • In March 2024, Royal Dutch Shell received a crucial regulatory approval from the U.S. Federal Energy Regulatory Commission (FERC) for its proposed LNG export terminal in Texas, known as the Annova LNG Terminal. This approval marks a significant milestone in the project's development and paves the way for the first U.S. LNG export terminal to be owned and operated by an African company (Shell press release, 2024). The terminal, with an initial capacity of 5 mtpa, is expected to contribute significantly to the global LNG market.
  • In May 2024, TotalEnergies and Adani Green Energy Limited signed a memorandum of understanding (MoU) to jointly develop a green hydrogen and LNG project in India. This collaboration represents a significant step towards decarbonizing the energy sector, as it combines renewable energy and LNG to produce green hydrogen (TotalEnergies press release, 2024). The project is expected to have a production capacity of 1 GW for green hydrogen and 5 mtpa for LNG.

Research Analyst Overview

  • The LNG market continues to evolve, shaped by various trends and dynamics. Innovation trends, such as advanced LNG storage solutions and transportation optimization, are enhancing the competitiveness of this fuel in the energy sector. Risk management remains a critical concern for LNG market participants, with risk assessment and pricing strategies playing essential roles in mitigating uncertainties. Demand projections for LNG remain strong, driven by increasing adoption in maritime transportation through LNG-fueled vessels. Environmental regulations and sustainability initiatives are shaping the future trends in the LNG industry, with a growing emphasis on reducing emissions and improving fuel efficiency.
  • LNG market integration and economic impact are significant factors influencing the market's growth. The development of infrastructure, including bunkering infrastructure and LNG-related investments, is crucial for expanding the reach of this cleaner fuel. Geopolitical factors and safety regulations also play a role in shaping the market outlook. Technology advancements continue to drive innovation in the LNG sector, with price forecasting and financial instruments offering new opportunities for risk management. Industry partnerships and collaboration are essential for addressing the challenges of LNG transportation and storage. Overall, the LNG market is poised for continued growth, with various trends and factors shaping its future trajectory.

Dive into Technavio's robust research methodology, blending expert interviews, extensive data synthesis, and validated models for unparalleled Liquefied Natural Gas (LNG) Market insights. See full methodology.

Market Scope

Report Coverage

Details

Page number

220

Base year

2024

Historic period

2019-2023

Forecast period

2025-2029

Growth momentum & CAGR

Accelerate at a CAGR of 8%

Market growth 2025-2029

USD 27.79 billion

Market structure

Fragmented

YoY growth 2024-2025(%)

6.8

Key countries

US, Qatar, Russia, China, Norway, Saudi Arabia, Canada, Japan, UAE, and The Netherlands

Competitive landscape

Leading Companies, Market Positioning of Companies, Competitive Strategies, and Industry Risks

Request Free Sample

What are the Key Data Covered in this Liquefied Natural Gas (LNG) Market Research and Growth Report?

  • CAGR of the Liquefied Natural Gas (LNG) industry during the forecast period
  • Detailed information on factors that will drive the growth and forecasting between 2025 and 2029
  • Precise estimation of the size of the market and its contribution of the industry in focus to the parent market
  • Accurate predictions about upcoming growth and trends and changes in consumer behaviour
  • Growth of the market across North America, Middle East and Africa, Europe, APAC, and South America
  • Thorough analysis of the market's competitive landscape and detailed information about companies
  • Comprehensive analysis of factors that will challenge the liquefied natural gas (lng) market growth of industry companies

We can help! Our analysts can customize this liquefied natural gas (lng) market research report to meet your requirements.

Get in touch

1 Executive Summary

  • 1.1 Market overview
    • Executive Summary - Chart on Market Overview
    • Executive Summary - Data Table on Market Overview
    • Executive Summary - Chart on Global Market Characteristics
    • Executive Summary - Chart on Market by Geography
    • Executive Summary - Chart on Market Segmentation by End-user
    • Executive Summary - Chart on Market Segmentation by Application
    • Executive Summary - Chart on Incremental Growth
    • Executive Summary - Data Table on Incremental Growth
    • Executive Summary - Chart on Company Market Positioning

2 Technavio Analysis

  • 2.1 Analysis of price sensitivity, lifecycle, customer purchase basket, adoption rates, and purchase criteria
    • Analysis of price sensitivity, lifecycle, customer purchase basket, adoption rates, and purchase criteria
  • 2.2 Criticality of inputs and Factors of differentiation
    • Overview on criticality of inputs and factors of differentiation
  • 2.3 Factors of disruption
    • Overview on factors of disruption
  • 2.4 Impact of drivers and challenges
    • Impact of drivers and challenges in 2024 and 2029

3 Market Landscape

  • 3.1 Market ecosystem
    • Parent Market
    • Data Table on - Parent Market
  • 3.2 Market characteristics
    • Market characteristics analysis
  • 3.3 Value chain analysis
    • Value chain analysis

4 Market Sizing

  • 4.1 Market definition
    • Offerings of companies included in the market definition
  • 4.2 Market segment analysis
    • Market segments
  • 4.3 Market size 2024
    • 4.4 Market outlook: Forecast for 2024-2029
      • Chart on Global - Market size and forecast 2024-2029 ($ billion)
      • Data Table on Global - Market size and forecast 2024-2029 ($ billion)
      • Chart on Global Market: Year-over-year growth 2024-2029 (%)
      • Data Table on Global Market: Year-over-year growth 2024-2029 (%)

    5 Historic Market Size

    • 5.1 Global Liquefied Natural Gas (LNG) Market 2019 - 2023
      • Historic Market Size - Data Table on Global Liquefied Natural Gas (LNG) Market 2019 - 2023 ($ billion)
    • 5.2 End-user segment analysis 2019 - 2023
      • Historic Market Size - End-user Segment 2019 - 2023 ($ billion)
    • 5.3 Application segment analysis 2019 - 2023
      • Historic Market Size - Application Segment 2019 - 2023 ($ billion)
    • 5.4 Geography segment analysis 2019 - 2023
      • Historic Market Size - Geography Segment 2019 - 2023 ($ billion)
    • 5.5 Country segment analysis 2019 - 2023
      • Historic Market Size - Country Segment 2019 - 2023 ($ billion)

    6 Qualitative Analysis

    • 6.1 Impact of AI on global liquefied natural gas (LNG) market

      7 Five Forces Analysis

      • 7.1 Five forces summary
        • Five forces analysis - Comparison between 2024 and 2029
      • 7.2 Bargaining power of buyers
        • Bargaining power of buyers - Impact of key factors 2024 and 2029
      • 7.3 Bargaining power of suppliers
        • Bargaining power of suppliers - Impact of key factors in 2024 and 2029
      • 7.4 Threat of new entrants
        • Threat of new entrants - Impact of key factors in 2024 and 2029
      • 7.5 Threat of substitutes
        • Threat of substitutes - Impact of key factors in 2024 and 2029
      • 7.6 Threat of rivalry
        • Threat of rivalry - Impact of key factors in 2024 and 2029
      • 7.7 Market condition
        • Chart on Market condition - Five forces 2024 and 2029

      8 Market Segmentation by End-user

      • 8.1 Market segments
        • Chart on End-user - Market share 2024-2029 (%)
        • Data Table on End-user - Market share 2024-2029 (%)
      • 8.2 Comparison by End-user
        • Chart on Comparison by End-user
        • Data Table on Comparison by End-user
      • 8.3 Power - Market size and forecast 2024-2029
        • Chart on Power - Market size and forecast 2024-2029 ($ billion)
        • Data Table on Power - Market size and forecast 2024-2029 ($ billion)
        • Chart on Power - Year-over-year growth 2024-2029 (%)
        • Data Table on Power - Year-over-year growth 2024-2029 (%)
      • 8.4 Industry - Market size and forecast 2024-2029
        • Chart on Industry - Market size and forecast 2024-2029 ($ billion)
        • Data Table on Industry - Market size and forecast 2024-2029 ($ billion)
        • Chart on Industry - Year-over-year growth 2024-2029 (%)
        • Data Table on Industry - Year-over-year growth 2024-2029 (%)
      • 8.5 Others - Market size and forecast 2024-2029
        • Chart on Others - Market size and forecast 2024-2029 ($ billion)
        • Data Table on Others - Market size and forecast 2024-2029 ($ billion)
        • Chart on Others - Year-over-year growth 2024-2029 (%)
        • Data Table on Others - Year-over-year growth 2024-2029 (%)
      • 8.6 Market opportunity by End-user
        • Market opportunity by End-user ($ billion)
        • Data Table on Market opportunity by End-user ($ billion)

      9 Market Segmentation by Application

      • 9.1 Market segments
        • Chart on Application - Market share 2024-2029 (%)
        • Data Table on Application - Market share 2024-2029 (%)
      • 9.2 Comparison by Application
        • Chart on Comparison by Application
        • Data Table on Comparison by Application
      • 9.3 Off-grid power plants - Market size and forecast 2024-2029
        • Chart on Off-grid power plants - Market size and forecast 2024-2029 ($ billion)
        • Data Table on Off-grid power plants - Market size and forecast 2024-2029 ($ billion)
        • Chart on Off-grid power plants - Year-over-year growth 2024-2029 (%)
        • Data Table on Off-grid power plants - Year-over-year growth 2024-2029 (%)
      • 9.4 Transportation - Market size and forecast 2024-2029
        • Chart on Transportation - Market size and forecast 2024-2029 ($ billion)
        • Data Table on Transportation - Market size and forecast 2024-2029 ($ billion)
        • Chart on Transportation - Year-over-year growth 2024-2029 (%)
        • Data Table on Transportation - Year-over-year growth 2024-2029 (%)
      • 9.5 Industrial and manufacturing - Market size and forecast 2024-2029
        • Chart on Industrial and manufacturing - Market size and forecast 2024-2029 ($ billion)
        • Data Table on Industrial and manufacturing - Market size and forecast 2024-2029 ($ billion)
        • Chart on Industrial and manufacturing - Year-over-year growth 2024-2029 (%)
        • Data Table on Industrial and manufacturing - Year-over-year growth 2024-2029 (%)
      • 9.6 Marine fuel - Market size and forecast 2024-2029
        • Chart on Marine fuel - Market size and forecast 2024-2029 ($ billion)
        • Data Table on Marine fuel - Market size and forecast 2024-2029 ($ billion)
        • Chart on Marine fuel - Year-over-year growth 2024-2029 (%)
        • Data Table on Marine fuel - Year-over-year growth 2024-2029 (%)
      • 9.7 Others - Market size and forecast 2024-2029
        • Chart on Others - Market size and forecast 2024-2029 ($ billion)
        • Data Table on Others - Market size and forecast 2024-2029 ($ billion)
        • Chart on Others - Year-over-year growth 2024-2029 (%)
        • Data Table on Others - Year-over-year growth 2024-2029 (%)
      • 9.8 Market opportunity by Application
        • Market opportunity by Application ($ billion)
        • Data Table on Market opportunity by Application ($ billion)

      10 Customer Landscape

      • 10.1 Customer landscape overview
        • Analysis of price sensitivity, lifecycle, customer purchase basket, adoption rates, and purchase criteria

      11 Geographic Landscape

      • 11.1 Geographic segmentation
        • Chart on Market share by geography 2024-2029 (%)
        • Data Table on Market share by geography 2024-2029 (%)
      • 11.2 Geographic comparison
        • Chart on Geographic comparison
        • Data Table on Geographic comparison
      • 11.3 North America - Market size and forecast 2024-2029
        • Chart on North America - Market size and forecast 2024-2029 ($ billion)
        • Data Table on North America - Market size and forecast 2024-2029 ($ billion)
        • Chart on North America - Year-over-year growth 2024-2029 (%)
        • Data Table on North America - Year-over-year growth 2024-2029 (%)
      • 11.4 Middle East and Africa - Market size and forecast 2024-2029
        • Chart on Middle East and Africa - Market size and forecast 2024-2029 ($ billion)
        • Data Table on Middle East and Africa - Market size and forecast 2024-2029 ($ billion)
        • Chart on Middle East and Africa - Year-over-year growth 2024-2029 (%)
        • Data Table on Middle East and Africa - Year-over-year growth 2024-2029 (%)
      • 11.5 Europe - Market size and forecast 2024-2029
        • Chart on Europe - Market size and forecast 2024-2029 ($ billion)
        • Data Table on Europe - Market size and forecast 2024-2029 ($ billion)
        • Chart on Europe - Year-over-year growth 2024-2029 (%)
        • Data Table on Europe - Year-over-year growth 2024-2029 (%)
      • 11.6 APAC - Market size and forecast 2024-2029
        • Chart on APAC - Market size and forecast 2024-2029 ($ billion)
        • Data Table on APAC - Market size and forecast 2024-2029 ($ billion)
        • Chart on APAC - Year-over-year growth 2024-2029 (%)
        • Data Table on APAC - Year-over-year growth 2024-2029 (%)
      • 11.7 South America - Market size and forecast 2024-2029
        • Chart on South America - Market size and forecast 2024-2029 ($ billion)
        • Data Table on South America - Market size and forecast 2024-2029 ($ billion)
        • Chart on South America - Year-over-year growth 2024-2029 (%)
        • Data Table on South America - Year-over-year growth 2024-2029 (%)
      • 11.8 US - Market size and forecast 2024-2029
        • Chart on US - Market size and forecast 2024-2029 ($ billion)
        • Data Table on US - Market size and forecast 2024-2029 ($ billion)
        • Chart on US - Year-over-year growth 2024-2029 (%)
        • Data Table on US - Year-over-year growth 2024-2029 (%)
      • 11.9 Qatar - Market size and forecast 2024-2029
        • Chart on Qatar - Market size and forecast 2024-2029 ($ billion)
        • Data Table on Qatar - Market size and forecast 2024-2029 ($ billion)
        • Chart on Qatar - Year-over-year growth 2024-2029 (%)
        • Data Table on Qatar - Year-over-year growth 2024-2029 (%)
      • 11.10 Russia - Market size and forecast 2024-2029
        • Chart on Russia - Market size and forecast 2024-2029 ($ billion)
        • Data Table on Russia - Market size and forecast 2024-2029 ($ billion)
        • Chart on Russia - Year-over-year growth 2024-2029 (%)
        • Data Table on Russia - Year-over-year growth 2024-2029 (%)
      • 11.11 Norway - Market size and forecast 2024-2029
        • Chart on Norway - Market size and forecast 2024-2029 ($ billion)
        • Data Table on Norway - Market size and forecast 2024-2029 ($ billion)
        • Chart on Norway - Year-over-year growth 2024-2029 (%)
        • Data Table on Norway - Year-over-year growth 2024-2029 (%)
      • 11.12 China - Market size and forecast 2024-2029
        • Chart on China - Market size and forecast 2024-2029 ($ billion)
        • Data Table on China - Market size and forecast 2024-2029 ($ billion)
        • Chart on China - Year-over-year growth 2024-2029 (%)
        • Data Table on China - Year-over-year growth 2024-2029 (%)
      • 11.13 Saudi Arabia - Market size and forecast 2024-2029
        • Chart on Saudi Arabia - Market size and forecast 2024-2029 ($ billion)
        • Data Table on Saudi Arabia - Market size and forecast 2024-2029 ($ billion)
        • Chart on Saudi Arabia - Year-over-year growth 2024-2029 (%)
        • Data Table on Saudi Arabia - Year-over-year growth 2024-2029 (%)
      • 11.14 Canada - Market size and forecast 2024-2029
        • Chart on Canada - Market size and forecast 2024-2029 ($ billion)
        • Data Table on Canada - Market size and forecast 2024-2029 ($ billion)
        • Chart on Canada - Year-over-year growth 2024-2029 (%)
        • Data Table on Canada - Year-over-year growth 2024-2029 (%)
      • 11.15 The Netherlands - Market size and forecast 2024-2029
        • Chart on The Netherlands - Market size and forecast 2024-2029 ($ billion)
        • Data Table on The Netherlands - Market size and forecast 2024-2029 ($ billion)
        • Chart on The Netherlands - Year-over-year growth 2024-2029 (%)
        • Data Table on The Netherlands - Year-over-year growth 2024-2029 (%)
      • 11.16 Japan - Market size and forecast 2024-2029
        • Chart on Japan - Market size and forecast 2024-2029 ($ billion)
        • Data Table on Japan - Market size and forecast 2024-2029 ($ billion)
        • Chart on Japan - Year-over-year growth 2024-2029 (%)
        • Data Table on Japan - Year-over-year growth 2024-2029 (%)
      • 11.17 UAE - Market size and forecast 2024-2029
        • Chart on UAE - Market size and forecast 2024-2029 ($ billion)
        • Data Table on UAE - Market size and forecast 2024-2029 ($ billion)
        • Chart on UAE - Year-over-year growth 2024-2029 (%)
        • Data Table on UAE - Year-over-year growth 2024-2029 (%)
      • 11.18 Market opportunity by geography
        • Market opportunity by geography ($ billion)
        • Data Tables on Market opportunity by geography ($ billion)

      12 Drivers, Challenges, and Opportunity/Restraints

      • 12.1 Market drivers
        • 12.2 Market challenges
          • 12.3 Impact of drivers and challenges
            • Impact of drivers and challenges in 2024 and 2029
          • 12.4 Market opportunities/restraints

            13 Competitive Landscape

            • 13.1 Overview
              • 13.2 Competitive Landscape
                • Overview on criticality of inputs and factors of differentiation
              • 13.3 Landscape disruption
                • Overview on factors of disruption
              • 13.4 Industry risks
                • Impact of key risks on business

              14 Competitive Analysis

              • 14.1 Companies profiled
                • Companies covered
              • 14.2 Company ranking index
                • Company ranking index
              • 14.3 Market positioning of companies
                • Matrix on companies position and classification
              • 14.4 Bechtel Corp.
                • Bechtel Corp. - Overview
                • Bechtel Corp. - Product / Service
                • Bechtel Corp. - Key news
                • Bechtel Corp. - Key offerings
                • SWOT
              • 14.5 BP Plc
                • BP Plc - Overview
                • BP Plc - Business segments
                • BP Plc - Key news
                • BP Plc - Key offerings
                • BP Plc - Segment focus
                • SWOT
              • 14.6 Chevron Corporation.
                • Chevron Corporation. - Overview
                • Chevron Corporation. - Business segments
                • Chevron Corporation. - Key news
                • Chevron Corporation. - Key offerings
                • Chevron Corporation. - Segment focus
                • SWOT
              • 14.7 China Petrochemical Corp.
                • China Petrochemical Corp. - Overview
                • China Petrochemical Corp. - Business segments
                • China Petrochemical Corp. - Key offerings
                • China Petrochemical Corp. - Segment focus
                • SWOT
              • 14.8 Eni SpA
                • Eni SpA - Overview
                • Eni SpA - Business segments
                • Eni SpA - Key news
                • Eni SpA - Key offerings
                • Eni SpA - Segment focus
                • SWOT
              • 14.9 Equinor ASA
                • Equinor ASA - Overview
                • Equinor ASA - Business segments
                • Equinor ASA - Key news
                • Equinor ASA - Key offerings
                • Equinor ASA - Segment focus
                • SWOT
              • 14.10 Exxon Mobil Corp.
                • Exxon Mobil Corp. - Overview
                • Exxon Mobil Corp. - Business segments
                • Exxon Mobil Corp. - Key news
                • Exxon Mobil Corp. - Key offerings
                • Exxon Mobil Corp. - Segment focus
                • SWOT
              • 14.11 Fluor Corp.
                • Fluor Corp. - Overview
                • Fluor Corp. - Business segments
                • Fluor Corp. - Key news
                • Fluor Corp. - Key offerings
                • Fluor Corp. - Segment focus
                • SWOT
              • 14.12 Freeport LNG Development LP
                • Freeport LNG Development LP - Overview
                • Freeport LNG Development LP - Product / Service
                • Freeport LNG Development LP - Key offerings
                • SWOT
              • 14.13 PAO NOVATEK
                • PAO NOVATEK - Overview
                • PAO NOVATEK - Product / Service
                • PAO NOVATEK - Key offerings
                • SWOT
              • 14.14 PetroChina Co. Ltd.
                • PetroChina Co. Ltd. - Overview
                • PetroChina Co. Ltd. - Business segments
                • PetroChina Co. Ltd. - Key offerings
                • PetroChina Co. Ltd. - Segment focus
                • SWOT
              • 14.15 Qatargas Operating Co. Ltd.
                • Qatargas Operating Co. Ltd. - Overview
                • Qatargas Operating Co. Ltd. - Product / Service
                • Qatargas Operating Co. Ltd. - Key offerings
                • SWOT
              • 14.16 SEFE Energy Ltd.
                • SEFE Energy Ltd. - Overview
                • SEFE Energy Ltd. - Product / Service
                • SEFE Energy Ltd. - Key offerings
                • SWOT
              • 14.17 Shell plc
                • Shell plc - Overview
                • Shell plc - Business segments
                • Shell plc - Key news
                • Shell plc - Key offerings
                • Shell plc - Segment focus
                • SWOT
              • 14.18 TotalEnergies SE
                • TotalEnergies SE - Overview
                • TotalEnergies SE - Business segments
                • TotalEnergies SE - Key news
                • TotalEnergies SE - Key offerings
                • TotalEnergies SE - Segment focus
                • SWOT

              15 Appendix

              • 15.1 Scope of the report
                • 15.2 Inclusions and exclusions checklist
                  • Inclusions checklist
                  • Exclusions checklist
                • 15.3 Currency conversion rates for US$
                  • Currency conversion rates for US$
                • 15.4 Research methodology
                  • Research methodology
                • 15.5 Data procurement
                  • Information sources
                • 15.6 Data validation
                  • Data validation
                • 15.7 Validation techniques employed for market sizing
                  • Validation techniques employed for market sizing
                • 15.8 Data synthesis
                  • Data synthesis
                • 15.9 360 degree market analysis
                  • 360 degree market analysis
                • 15.10 List of abbreviations
                  • List of abbreviations

                Research Methodology

                Technavio presents a detailed picture of the market by way of study, synthesis, and summation of data from multiple sources. The analysts have presented the various facets of the market with a particular focus on identifying the key industry influencers. The data thus presented is comprehensive, reliable, and the result of extensive research, both primary and secondary.

                INFORMATION SOURCES

                Primary sources

                • Manufacturers and suppliers
                • Channel partners
                • Industry experts
                • Strategic decision makers

                Secondary sources

                • Industry journals and periodicals
                • Government data
                • Financial reports of key industry players
                • Historical data
                • Press releases

                DATA ANALYSIS

                Data Synthesis

                • Collation of data
                • Estimation of key figures
                • Analysis of derived insights

                Data Validation

                • Triangulation with data models
                • Reference against proprietary databases
                • Corroboration with industry experts

                REPORT WRITING

                Qualitative

                • Market drivers
                • Market challenges
                • Market trends
                • Five forces analysis

                Quantitative

                • Market size and forecast
                • Market segmentation
                • Geographical insights
                • Competitive landscape

                Interested in this report?

                Get your sample now to see our research methodology and insights!

                Download Now

                Frequently Asked Questions

                Liquefied Natural Gas (Lng) market growth will increase by $ 27.79 bn during 2025-2029 .

                The Liquefied Natural Gas (Lng) market is expected to grow at a CAGR of 8% during 2025-2029 .

                Liquefied Natural Gas (Lng) market is segmented by End-user( Power, Industry, Others) Application( Off-grid power plants, Transportation, Industrial and manufacturing, Marine fuel, Others)

                Bechtel Corp., BP Plc, Cheniere Energy Inc., Chevron Corp., China Petrochemical Corp., Eni SpA, Equinor ASA, Exxon Mobil Corp., Fluor Corp., Freeport LNG Development LP, Gasum Oy, INPEX Corp., PAO NOVATEK, PetroChina Co. Ltd., Qatargas Operating Co. Ltd., SEFE Energy Ltd., Sempra, Shell plc, TechnipFMC plc, TotalEnergies SE are a few of the key vendors in the Liquefied Natural Gas (Lng) market.

                North America will register the highest growth rate of 43% among the other regions. Therefore, the Liquefied Natural Gas (Lng) market in North America is expected to garner significant business opportunities for the vendors during the forecast period.

                US, Qatar, Russia, China, Norway, Saudi Arabia, Canada, Japan, UAE, The Netherlands

                • Increase in LNG productionThe increase in the supply of coalbed methane is the driving factor this market.
                • shale gas is the driving factor this market.
                • and tight gas has made natural gas one of the fastest-growing fossil fuels. Hence is the driving factor this market.
                • the global liquefied natural gas (LNG) market will experience a significant increase in unconventional oil and gas resources.Since 2008 is the driving factor this market.
                • the US has been undertaking the successful extraction of shale oil and gas is the driving factor this market.
                • which has resulted in the growth of the oil and gas supply. According to the US Energy Information Administration (EIA) is the driving factor this market.
                • shale gas production in the US increased from 68% in 2018 to 71% in 2019. By 2023 is the driving factor this market.
                • the US continued to be a major player in shale gas production is the driving factor this market.
                • with the Marcellus and Utica shale plays being the top producers is the driving factor this market.
                • followed by the Permian Basin Moreover is the driving factor this market.
                • according to the IEA is the driving factor this market.
                • the increase in natural gas production in the US will account for 49% of global natural gas output growth by 2023. Shale gas production in the US has been primarily led by the Permian Basin is the driving factor this market.
                • where the output is expected to increase two-fold by 2025. According to the IEA is the driving factor this market.
                • in 2023 is the driving factor this market.
                • the US produced 890 bcm or 22% of global natural gas production. Despite the growth in both domestic demand in the US and the production of natural gas is the driving factor this market.
                • it is expected that more than half of the additional natural gas produced will be converted into liquefied natural gas (LNG) for export to countries where domestic natural gas production is nil or insufficient to meet the demand.According to the IEA is the driving factor this market.
                • the Middle East added 70 bcm to global natural gas production is the driving factor this market.
                • with production increased to 650 bcm in 2023. Also is the driving factor this market.
                • in Russia is the driving factor this market.
                • the second-largest producer of natural gas in the world after the US is the driving factor this market.
                • natural gas production capacity in the Yamal peninsula is largely underutilized. The opportunities for the growth of natural gas production in Russia are primarily expected to be driven by the export of liquefied natural gas (LNG) is the driving factor this market.
                • as domestic demand has remained stagnant. Hence is the driving factor this market.
                • the increase in natural gas production has led to a rise in the production of liquefied natural gas (LNG) is the driving factor this market.
                • which is likely to boost the growth of the global liquefied natural gas (LNG) market during the forecast period. is the driving factor this market.

                The Liquefied Natural Gas (Lng) market vendors should focus on grabbing business opportunities from the Power segment as it accounted for the largest market share in the base year.