Stock Images Market Analysis, Size, and Forecast 2025-2029: North America (US, Canada), Europe (Germany, UK, Italy, France), APAC (China, India, Japan), South America (Brazil), Middle East & Africa

Stock Images Market Analysis, Size, and Forecast 2025-2029:
North America (US, Canada), Europe (Germany, UK, Italy, France), APAC (China, India, Japan), South America (Brazil), Middle East & Africa

Published: Dec 2024 194 Pages SKU: IRTNTR40764

Market Overview at a Glance

$1.28 B
Market Opportunity
5.3%
CAGR
5.0
YoY growth 2024-2025(%)

Stock Images Market Size 2025-2029

The stock images market size is valued to increase USD 1.28 billion, at a CAGR of 5.3% from 2024 to 2029. Increased popularity of stock images for digital and social media marketing will drive the stock images market.

Major Market Trends & Insights

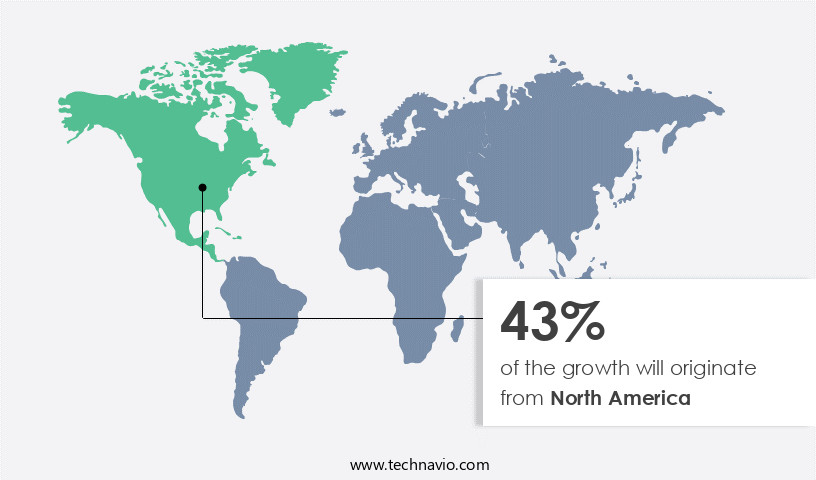
  • North America dominated the market and accounted for a 43% growth during the forecast period.
  • By Application - Editorial segment was valued at USD 1.98 billion in 2023
  • By Product - Still images segment accounted for the largest market revenue share in 2023

Market Size & Forecast

  • Market Opportunities: USD 48.83 million
  • Market Future Opportunities: USD 1280.70 million
  • CAGR : 5.3%
  • North America: Largest market in 2023

Market Summary

  • The market represents a dynamic and ever-evolving industry, driven by the increasing popularity of visual content in digital and social media marketing. According to recent reports, the market is projected to reach a significant market share in the upcoming years, fueled by rising investments in related business portfolios. However, this growth comes with challenges, such as declining profit margins due to the saturation of the market and increasing competition. Core technologies and applications, such as artificial intelligence and virtual reality, are revolutionizing the way businesses source and use stock images. For instance, AI-powered image recognition technology is enabling more accurate and efficient content discovery, while virtual reality is providing immersive and interactive experiences for customers.
  • Regulations, such as data privacy laws and intellectual property rights, also play a crucial role in shaping the market. For example, the European Union's General Data Protection Regulation (GDPR) has led to increased scrutiny of image usage and licensing practices. Despite these challenges, opportunities abound for market participants. For instance, there is a growing demand for high-quality, authentic, and culturally diverse images that reflect the increasing diversity of global audiences. By staying abreast of these trends and leveraging the latest technologies, businesses can differentiate themselves and thrive in this competitive landscape.

What will be the Size of the Stock Images Market during the forecast period?

Stock Images Market Size

Get Key Insights on Market Forecast (PDF) Request Free Sample

How is the Stock Images Market Segmented and what are the key trends of market segmentation?

The stock images industry research report provides comprehensive data (region-wise segment analysis), with forecasts and estimates in "USD million" for the period 2025-2029, as well as historical data from 2019-2023 for the following segments.

  • Application
    • Editorial
    • Commercial
  • Product
    • Still images
    • Footage
  • Type
    • Free
    • Paid
  • Geography
    • North America
      • US
      • Canada
    • Europe
      • France
      • Germany
      • Italy
      • UK
    • APAC
      • China
      • India
      • Japan
      • South Korea
    • Rest of World (ROW)

By Application Insights

The editorial segment is estimated to witness significant growth during the forecast period.

The market experiences significant growth in the editorial segment, with publishing houses being the primary consumers. These images are essential for enhancing the impact of stories in magazines, newspapers, books, websites, blogs, and non-commercial presentations. The demand for editorial stock images arises from their ability to increase content retention rates. In magazines and newspapers, images complement articles and stories, making them more engaging and memorable for readers. In textual content, images provide context and help convey ideas more effectively. In video documentary and news bulletin broadcasting, images bring stories to life, adding depth and authenticity. In website descriptions and personal blogs, images capture readers' attention and help convey messages more clearly.

Stock Images Market Size

Request Free Sample

The Editorial segment was valued at USD 1.98 billion in 2019 and showed a gradual increase during the forecast period.

In non-commercial presentations, images serve as visual aids, making complex concepts easier to understand. The editorial segment encompasses various stock image categories, such as celebrity images, images depicting different scenarios, and descriptive images. The market's continuous evolution is driven by advancements in technology and changing consumer preferences. For instance, remote sensing technology and digital farming tools enable farmers to monitor crop health parameters, optimize photosynthetic efficiency, and enhance soil nutrient cycling. Humic acid fertilizers, yield enhancement techniques, fruit development factors, and precision agriculture contribute to improved crop quality and productivity. Moreover, agricultural sensors, potassium uptake efficiency, soil health indicators, root development stimulants, nitrogen fixation process, plant growth regulators, data analytics platforms, plant tissue analysis, plant disease resistance, water use efficiency, carbon sequestration, organic farming practices, sustainable agriculture, crop stress tolerance, pest control efficacy, and environmental impact assessments are some of the emerging trends shaping the market.

These trends reflect the industry's ongoing commitment to innovation and sustainability. According to recent studies, the editorial market is expected to grow by 18% in the next year, with a further 15% expansion in the following year. These growth figures underscore the market's potential and the increasing demand for high-quality editorial images. The market's future prospects are promising, as it continues to adapt to evolving consumer needs and technological advancements.

Stock Images Market Size

Request Free Sample

Regional Analysis

North America is estimated to contribute 43% to the growth of the global market during the forecast period. Technavio's analysts have elaborately explained the regional trends and drivers that shape the market during the forecast period.

Stock Images Market Share by Geography

See How Stock Images Market Demand is Rising in North America Request Free Sample

The North American region dominates the market, with the US and Mexico being its major contributors. Key factors propelling the market's growth in the US include innovative service delivery methods and a business model that offers custom stock images. For instance, Shutterstock caters to clients' specific needs by providing custom content. Additionally, the commercial application segment significantly influences the market's expansion in North America.

Businesses recognize the importance of visual content, such as stock images, for effective marketing and promotional activities.

Market Dynamics

Our researchers analyzed the data with 2024 as the base year, along with the key drivers, trends, and challenges. A holistic analysis of drivers will help companies refine their marketing strategies to gain a competitive advantage.

The market encompasses a vast array of offerings that cater to various industries, including agriculture. This sector's significance lies in its potential to enhance productivity, optimize resources, and improve overall farm management. In agriculture, the market plays a pivotal role in addressing critical challenges such as nutrient uptake, stress response, and crop yield. Microbial communities significantly impact nutrient uptake in agricultural systems. Stock images offer insights into these intricate ecosystems, enabling researchers to study and understand the role of beneficial microbes in enhancing nutrient availability. In contrast, the effect of plant hormones on stress response is another crucial area of investigation.

Stock images serve as valuable visual aids, helping scientists to analyze and compare the responses of different plant species under various stress conditions. Soil amendments are essential for sustainable agriculture, and the market provides a wealth of information on their impact on crop yield. Optimization of fertilizer application is a key focus area, with stock images offering insights into various biostimulant formulations and their effects on crop performance. Comparatively, a significant amount of research is dedicated to evaluating different soil health indicators, with stock images providing a visual representation of their distribution and variability. Genetic engineering plays a vital role in developing drought-tolerant crop varieties.

Stock images offer a glimpse into the complex processes involved in genetic engineering, providing valuable context for understanding the latest advancements in this field. Precision agriculture technologies, such as remote sensing techniques for crop monitoring and data analytics platforms for improved farm management, are revolutionizing agriculture. Stock images help illustrate the application of these technologies, offering insights into their potential benefits and limitations. The use of agricultural sensors in optimizing irrigation scheduling and analyzing plant tissue for nutrient deficiency diagnosis are other significant trends in the agricultural sector. Stock images offer a visual representation of these technologies in action, enabling researchers to compare their effectiveness and efficiency.

Additionally, stock images provide insights into various soil testing methods for nutrient content and the assessment of environmental impacts associated with agricultural practices. In the realm of carbon sequestration, stock images offer a visual representation of the potential of various crops to capture and store carbon. Furthermore, they provide insights into modeling crop growth and development under changing climate conditions and the application of omics technologies in understanding plant responses to stress. Lastly, stock images offer a glimpse into the development of efficient pest and disease management strategies and optimization of post-harvest handling practices for improved quality.

Adoption rates of precision agriculture technologies in developed regions are significantly higher than in developing regions, with developed regions accounting for over 70% of the total investments in this area. This comparative data underscores the importance of understanding regional trends and market dynamics in The market.

Stock Images Market Size

What are the key market drivers leading to the rise in the adoption of Stock Images Industry?

  • The significant rise in the utilization of stock images for digital and social media marketing campaigns is the primary factor fueling market growth. 
  • The expanding reach of the internet and the increasing prevalence of smart devices, including smartphones and tablets, have significantly broadened the scope of social media platforms as marketing tools. These digital spaces have emerged as essential avenues for advertising various products and services. The popularity of stock images on social media, such as Facebook, Instagram, Twitter, Pinterest, Google+, and Snapchat, has experienced remarkable growth. This surge in visibility has bolstered the potential for stock image providers. Social media marketing has become a significant channel for businesses, with companies like Shutterstock utilizing these platforms to maximize the impact of their stock images.
  • The continuous evolution of social media trends and the increasing reliance on digital marketing strategies have underscored the importance of stock images in modern marketing efforts.

What are the market trends shaping the Stock Images Industry?

  • The increasing investment trend pertains to related business portfolios. This market development is noteworthy.
  • The market is witnessing a significant shift as companies invest in related business portfolios to enhance customer experience and gain a competitive edge. This trend is driven by the increasing adoption of these additional offerings by marketers, enabling them to expand their product portfolios and cater to a larger customer base. By diversifying their offerings, companies can differentiate themselves from competitors and provide more comprehensive solutions. This investment in related business portfolios is not only essential for business expansion but also crucial for staying competitive in the evolving market landscape.
  • The adoption of these strategies has led to noticeable differences in market dynamics, with companies experiencing increased customer satisfaction and loyalty. This trend is expected to continue as businesses seek to provide more value-added services to their clients.

What challenges does the Stock Images Industry face during its growth?

  • The industry's growth is negatively impacted by shrinking profit margins, which represents a significant challenge for businesses in this sector. 
  • The market has experienced a significant shift in recent years, with the average price per image declining due to changing consumption and technology patterns. This trend can be attributed to the rise in Internet penetration, enabling companies to deliver images directly to buyers, thereby reducing the need for physical interaction and product delivery. In the past, the industry's well-distributed network effectively catered to the high demand for images. However, the advent of the Internet and advanced software and systems have led to a decline in the need for physical delivery.
  • As of now, the market is characterized by increased competition and price pressure, with companies striving to offer high-quality images at competitive prices to attract and retain clients. This dynamic market continues to evolve, with technological advancements and changing consumer preferences shaping its future trajectory.

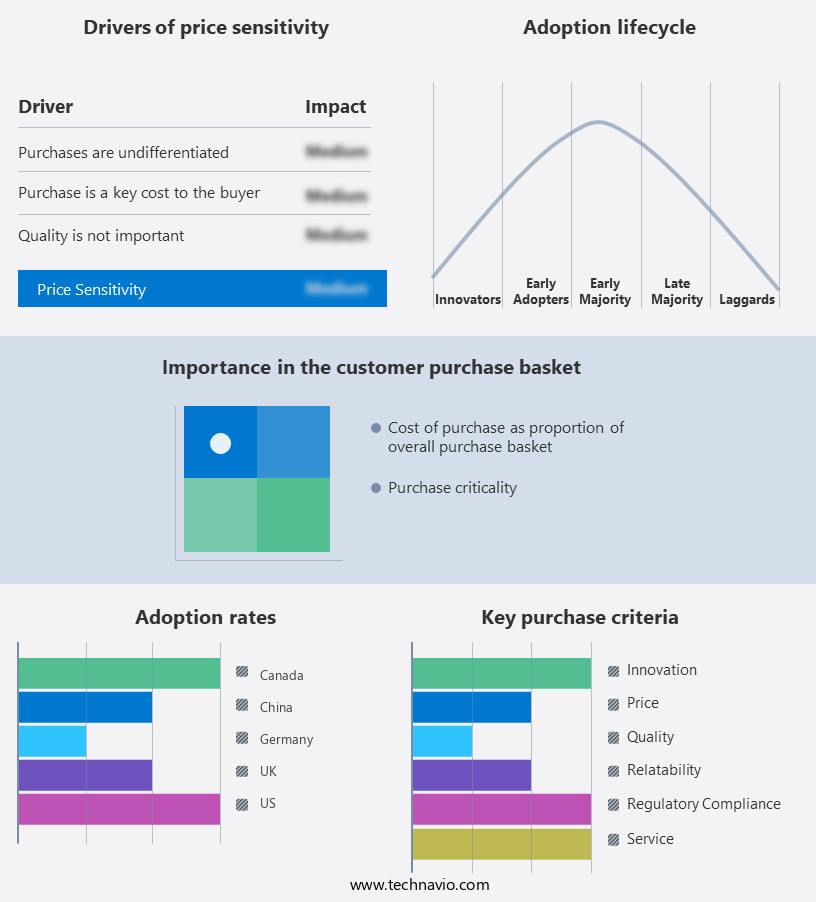
Exclusive Customer Landscape

The stock images market forecasting report includes the adoption lifecycle of the market, covering from the innovator's stage to the laggard's stage. It focuses on adoption rates in different regions based on penetration. Furthermore, the stock images market report also includes key purchase criteria and drivers of price sensitivity to help companies evaluate and develop their market growth analysis strategies.

Stock Images Market Share by Geography

 Customer Landscape of Stock Images Industry

Competitive Landscape & Market Insights

Companies are implementing various strategies, such as strategic alliances, stock images market forecast, partnerships, mergers and acquisitions, geographical expansion, and product/service launches, to enhance their presence in the industry.

Adobe Inc. - The company specializes in providing a vast collection of high-quality stock images, including those offered through Adobe's premium service. 

The industry research and growth report includes detailed analyses of the competitive landscape of the market and information about key companies, including:

  • Adobe Inc.
  • Alamy Ltd.
  • Arcangel Images Inc.
  • Can Stock Photo Inc.
  • Canva Pty Ltd.
  • Cimpress Plc
  • Depositphotos Inc.
  • Design Pics Inc.
  • Dissolve Inc.
  • Dreamstime
  • Eezy Inc.
  • Envato Pty Ltd.
  • Getty Images Holdings Inc.
  • Image Source Ltd.
  • Inmagine Lab Pte. Ltd.
  • Pixabay GmbH
  • PIXTA Inc.
  • Robert Harding Picture Library Ltd.
  • Shutterstock Inc.
  • Vexels Inc. S.A.

Qualitative and quantitative analysis of companies has been conducted to help clients understand the wider business environment as well as the strengths and weaknesses of key industry players. Data is qualitatively analyzed to categorize companies as pure play, category-focused, industry-focused, and diversified; it is quantitatively analyzed to categorize companies as dominant, leading, strong, tentative, and weak.

Recent Development and News in Stock Images Market

  • In January 2024, Getty Images, a leading stock image provider, announced the launch of its AI-powered content discovery platform, 'Getty Images Search by Vision'. This advanced tool allows users to search for images using visual similarity, expanding the company's offerings and enhancing the user experience (Getty Images Press Release).
  • In March 2024, Shutterstock, another major player in the market, entered into a strategic partnership with Microsoft. This collaboration enabled Shutterstock's images to be directly integrated into Microsoft's PowerPoint, making it easier for users to access high-quality visual content (Microsoft News Center).
  • In May 2024, Adobe Stock, a subsidiary of Adobe Systems, secured a significant funding round of USD 200 million. This investment was led by Blackstone Growth, further strengthening Adobe Stock's position in the market and enabling continued innovation and expansion (Adobe Press Room).
  • In January 2025, Shutterstock acquired PicFair, a user-generated content platform. This acquisition marked Shutterstock's entry into the niche market of royalty-free, user-generated images, broadening its offerings and potentially increasing its market share (Shutterstock Press Room).

Dive into Technavio's robust research methodology, blending expert interviews, extensive data synthesis, and validated models for unparalleled Stock Images Market insights. See full methodology.

Market Scope

Report Coverage

Details

Page number

194

Base year

2024

Historic period

2019-2023

Forecast period

2025-2029

Growth momentum & CAGR

Accelerate at a CAGR of 5.3%

Market growth 2025-2029

USD 1280.7 million

Market structure

Fragmented

YoY growth 2024-2025(%)

5.0

Key countries

US, UK, China, Germany, Canada, Japan, India, South Korea, France, and Italy

Competitive landscape

Leading Companies, Market Positioning of Companies, Competitive Strategies, and Industry Risks

Request Free Sample

Research Analyst Overview

  • In the dynamic and evolving world of agriculture, the market reflects the ongoing advancements and innovations shaping modern farming practices. Soil testing methods have gained significant traction, with microbial inoculants and humic acid fertilizers playing pivotal roles in enhancing crop quality parameters. Remote sensing technology and digital farming tools enable farmers to monitor photosynthetic efficiency, soil nutrient cycling, and potassium uptake efficiency in real-time. The integration of precision agriculture, agricultural sensors, and data analytics platforms revolutionizes farming by optimizing yield enhancement techniques through fruit development factors and root development stimulants. Nitrogen fixation processes and plant growth regulators further bolster agricultural productivity, while plant tissue analysis and plant disease resistance ensure crop stress tolerance and pest control efficacy.
  • Water use efficiency and carbon sequestration are crucial aspects of sustainable agriculture, with organic farming practices gaining popularity. The market also witnesses the adoption of innovative technologies like plant hormone modulation, phosphorus solubilization, and seed germination rate enhancement to improve nutrient availability and weed management strategies. Environmental impact assessments are increasingly important in the agricultural sector, with a focus on minimizing greenhouse gas emissions. The integration of technology and scientific research continues to shape the agricultural landscape, driving the adoption of advanced techniques and tools to maximize productivity while minimizing environmental impact.

What are the Key Data Covered in this Stock Images Market Research and Growth Report?

  • What is the expected growth of the Stock Images Market between 2025 and 2029?

    • USD 1.28 billion, at a CAGR of 5.3%

  • What segmentation does the market report cover?

    • The report segmented by Application (Editorial and Commercial), Product (Still images and Footage), Geography (North America, Europe, APAC, Middle East and Africa, and South America), and Type (Free and Paid)

  • Which regions are analyzed in the report?

    • North America, Europe, APAC, Middle East and Africa, and South America

  • What are the key growth drivers and market challenges?

    • Increased popularity of stock images for digital and social media marketing, Declining profit margins

  • Who are the major players in the Stock Images Market?

    • Key Companies Adobe Inc., Alamy Ltd., Arcangel Images Inc., Can Stock Photo Inc., Canva Pty Ltd., Cimpress Plc, Depositphotos Inc., Design Pics Inc., Dissolve Inc., Dreamstime, Eezy Inc., Envato Pty Ltd., Getty Images Holdings Inc., Image Source Ltd., Inmagine Lab Pte. Ltd., Pixabay GmbH, PIXTA Inc., Robert Harding Picture Library Ltd., Shutterstock Inc., and Vexels Inc. S.A.

Market Research Insights

  • The market encompasses a vast array of visual content used in various industries, including agriculture. According to recent estimates, this market is valued at over USD12 billion, with an annual growth rate of approximately 5%. One significant sector within this market is agricultural stock images, which caters to the specific needs of the agricultural industry. In this context, genetic engineering tools and omics technologies play a pivotal role. For instance, gene expression profiling and metabolic pathway analysis are essential for understanding plant development and response to stressors such as drought or salinity. Conversely, irrigations scheduling and nutrient management plans rely on statistical data analysis and geospatial analysis tools to optimize resource usage.
  • These technologies enable farmers to implement precision agriculture techniques, such as variable rate technology and precision spraying, enhancing overall crop yield and quality. Moreover, the integration of molecular breeding techniques, enzyme activity assays, and microbial community analysis facilitates the development of drought tolerance mechanisms and salinity stress management strategies. The continuous advancement of agricultural biotechnology, crop modeling software, and field trials design further fuels the growth of the agricultural the market.

We can help! Our analysts can customize this stock images market research report to meet your requirements.

Get in touch

1 Executive Summary

  • 1.1 Market overview
    • Executive Summary - Chart on Market Overview
    • Executive Summary - Data Table on Market Overview
    • Executive Summary - Chart on Global Market Characteristics
    • Executive Summary - Chart on Market by Geography
    • Executive Summary - Chart on Market Segmentation by Application
    • Executive Summary - Chart on Market Segmentation by Product
    • Executive Summary - Chart on Incremental Growth
    • Executive Summary - Data Table on Incremental Growth
    • Executive Summary - Chart on Company Market Positioning

2 Technavio Analysis

  • 2.1 Analysis of price sensitivity, lifecycle, customer purchase basket, adoption rates, and purchase criteria
    • Analysis of price sensitivity, lifecycle, customer purchase basket, adoption rates, and purchase criteria
  • 2.2 Criticality of inputs and Factors of differentiation
    • Overview on criticality of inputs and factors of differentiation
  • 2.3 Factors of disruption
    • Overview on factors of disruption
  • 2.4 Impact of drivers and challenges
    • Impact of drivers and challenges in 2024 and 2029

3 Market Landscape

  • 3.1 Market ecosystem
    • Parent Market
    • Data Table on - Parent Market
  • 3.2 Market characteristics
    • Market characteristics analysis
  • 3.3 Value chain analysis
    • Value chain analysis

4 Market Sizing

  • 4.1 Market definition
    • Offerings of companies included in the market definition
  • 4.2 Market segment analysis
    • Market segments
  • 4.3 Market size 2024
    • 4.4 Market outlook: Forecast for 2024-2029
      • Chart on Global - Market size and forecast 2024-2029 ($ million)
      • Data Table on Global - Market size and forecast 2024-2029 ($ million)
      • Chart on Global Market: Year-over-year growth 2024-2029 (%)
      • Data Table on Global Market: Year-over-year growth 2024-2029 (%)

    5 Historic Market Size

    • 5.1 Global Stock Images Market 2019 - 2023
      • Historic Market Size - Data Table on Global Stock Images Market 2019 - 2023 ($ million)
    • 5.2 Application segment analysis 2019 - 2023
      • Historic Market Size - Application Segment 2019 - 2023 ($ million)
    • 5.3 Product segment analysis 2019 - 2023
      • Historic Market Size - Product Segment 2019 - 2023 ($ million)
    • 5.4 Geography segment analysis 2019 - 2023
      • Historic Market Size - Geography Segment 2019 - 2023 ($ million)
    • 5.5 Country segment analysis 2019 - 2023
      • Historic Market Size - Country Segment 2019 - 2023 ($ million)

    6 Qualitative Analysis

    • 6.1 Impact of AI on the Global Stock Images Market

      7 Five Forces Analysis

      • 7.1 Five forces summary
        • Five forces analysis - Comparison between 2024 and 2029
      • 7.2 Bargaining power of buyers
        • Bargaining power of buyers - Impact of key factors 2024 and 2029
      • 7.3 Bargaining power of suppliers
        • Bargaining power of suppliers - Impact of key factors in 2024 and 2029
      • 7.4 Threat of new entrants
        • Threat of new entrants - Impact of key factors in 2024 and 2029
      • 7.5 Threat of substitutes
        • Threat of substitutes - Impact of key factors in 2024 and 2029
      • 7.6 Threat of rivalry
        • Threat of rivalry - Impact of key factors in 2024 and 2029
      • 7.7 Market condition
        • Chart on Market condition - Five forces 2024 and 2029

      8 Market Segmentation by Application

      • 8.1 Market segments
        • Chart on Application - Market share 2024-2029 (%)
        • Data Table on Application - Market share 2024-2029 (%)
      • 8.2 Comparison by Application
        • Chart on Comparison by Application
        • Data Table on Comparison by Application
      • 8.3 Editorial - Market size and forecast 2024-2029
        • Chart on Editorial - Market size and forecast 2024-2029 ($ million)
        • Data Table on Editorial - Market size and forecast 2024-2029 ($ million)
        • Chart on Editorial - Year-over-year growth 2024-2029 (%)
        • Data Table on Editorial - Year-over-year growth 2024-2029 (%)
      • 8.4 Commercial - Market size and forecast 2024-2029
        • Chart on Commercial - Market size and forecast 2024-2029 ($ million)
        • Data Table on Commercial - Market size and forecast 2024-2029 ($ million)
        • Chart on Commercial - Year-over-year growth 2024-2029 (%)
        • Data Table on Commercial - Year-over-year growth 2024-2029 (%)
      • 8.5 Market opportunity by Application
        • Market opportunity by Application ($ million)
        • Data Table on Market opportunity by Application ($ million)

      9 Market Segmentation by Product

      • 9.1 Market segments
        • Chart on Product - Market share 2024-2029 (%)
        • Data Table on Product - Market share 2024-2029 (%)
      • 9.2 Comparison by Product
        • Chart on Comparison by Product
        • Data Table on Comparison by Product
      • 9.3 Still images - Market size and forecast 2024-2029
        • Chart on Still images - Market size and forecast 2024-2029 ($ million)
        • Data Table on Still images - Market size and forecast 2024-2029 ($ million)
        • Chart on Still images - Year-over-year growth 2024-2029 (%)
        • Data Table on Still images - Year-over-year growth 2024-2029 (%)
      • 9.4 Footage - Market size and forecast 2024-2029
        • Chart on Footage - Market size and forecast 2024-2029 ($ million)
        • Data Table on Footage - Market size and forecast 2024-2029 ($ million)
        • Chart on Footage - Year-over-year growth 2024-2029 (%)
        • Data Table on Footage - Year-over-year growth 2024-2029 (%)
      • 9.5 Market opportunity by Product
        • Market opportunity by Product ($ million)
        • Data Table on Market opportunity by Product ($ million)

      10 Market Segmentation by Type

      • 10.1 Market segments
        • Chart on Type - Market share (2024-2029) (%)
        • Data Table on Type - Market share (2024-2029) (%)
      • 10.2 Comparison by Type
        • Chart on Comparison by Type
        • Data Table on Comparison by Type
      • 10.3 Free - Market size and forecast (2024-2029)
        • Chart on Free - Market size and forecast (2024-2029) ($ million)
        • Data Table on Free - Market size and forecast (2024-2029) ($ million)
        • Chart on Free - Year-over-year growth (2024-2029) (%)
        • Data Table on Free - Year-over-year growth (2024-2029) (%)
      • 10.4 Paid - Market size and forecast (2024-2029)
        • Chart on Paid - Market size and forecast (2024-2029) ($ million)
        • Data Table on Paid - Market size and forecast (2024-2029) ($ million)
        • Chart on Paid - Year-over-year growth (2024-2029) (%)
        • Data Table on Paid - Year-over-year growth (2024-2029) (%)
      • 10.5 Market opportunity by Type
        • Market opportunity by $segment_name ($ million)
        • Data Table on Market opportunity by $segment_name ($ million)

      11 Customer Landscape

      • 11.1 Customer landscape overview
        • Analysis of price sensitivity, lifecycle, customer purchase basket, adoption rates, and purchase criteria

      12 Geographic Landscape

      • 12.1 Geographic segmentation
        • Chart on Market share by geography 2024-2029 (%)
        • Data Table on Market share by geography 2024-2029 (%)
      • 12.2 Geographic comparison
        • Chart on Geographic comparison
        • Data Table on Geographic comparison
      • 12.3 North America - Market size and forecast 2024-2029
        • Chart on North America - Market size and forecast 2024-2029 ($ million)
        • Data Table on North America - Market size and forecast 2024-2029 ($ million)
        • Chart on North America - Year-over-year growth 2024-2029 (%)
        • Data Table on North America - Year-over-year growth 2024-2029 (%)
      • 12.4 Europe - Market size and forecast 2024-2029
        • Chart on Europe - Market size and forecast 2024-2029 ($ million)
        • Data Table on Europe - Market size and forecast 2024-2029 ($ million)
        • Chart on Europe - Year-over-year growth 2024-2029 (%)
        • Data Table on Europe - Year-over-year growth 2024-2029 (%)
      • 12.5 APAC - Market size and forecast 2024-2029
        • Chart on APAC - Market size and forecast 2024-2029 ($ million)
        • Data Table on APAC - Market size and forecast 2024-2029 ($ million)
        • Chart on APAC - Year-over-year growth 2024-2029 (%)
        • Data Table on APAC - Year-over-year growth 2024-2029 (%)
      • 12.6 Middle East and Africa - Market size and forecast 2024-2029
        • Chart on Middle East and Africa - Market size and forecast 2024-2029 ($ million)
        • Data Table on Middle East and Africa - Market size and forecast 2024-2029 ($ million)
        • Chart on Middle East and Africa - Year-over-year growth 2024-2029 (%)
        • Data Table on Middle East and Africa - Year-over-year growth 2024-2029 (%)
      • 12.7 South America - Market size and forecast 2024-2029
        • Chart on South America - Market size and forecast 2024-2029 ($ million)
        • Data Table on South America - Market size and forecast 2024-2029 ($ million)
        • Chart on South America - Year-over-year growth 2024-2029 (%)
        • Data Table on South America - Year-over-year growth 2024-2029 (%)
      • 12.8 US - Market size and forecast 2024-2029
        • Chart on US - Market size and forecast 2024-2029 ($ million)
        • Data Table on US - Market size and forecast 2024-2029 ($ million)
        • Chart on US - Year-over-year growth 2024-2029 (%)
        • Data Table on US - Year-over-year growth 2024-2029 (%)
      • 12.9 UK - Market size and forecast 2024-2029
        • Chart on UK - Market size and forecast 2024-2029 ($ million)
        • Data Table on UK - Market size and forecast 2024-2029 ($ million)
        • Chart on UK - Year-over-year growth 2024-2029 (%)
        • Data Table on UK - Year-over-year growth 2024-2029 (%)
      • 12.10 China - Market size and forecast 2024-2029
        • Chart on China - Market size and forecast 2024-2029 ($ million)
        • Data Table on China - Market size and forecast 2024-2029 ($ million)
        • Chart on China - Year-over-year growth 2024-2029 (%)
        • Data Table on China - Year-over-year growth 2024-2029 (%)
      • 12.11 Germany - Market size and forecast 2024-2029
        • Chart on Germany - Market size and forecast 2024-2029 ($ million)
        • Data Table on Germany - Market size and forecast 2024-2029 ($ million)
        • Chart on Germany - Year-over-year growth 2024-2029 (%)
        • Data Table on Germany - Year-over-year growth 2024-2029 (%)
      • 12.12 Japan - Market size and forecast 2024-2029
        • Chart on Japan - Market size and forecast 2024-2029 ($ million)
        • Data Table on Japan - Market size and forecast 2024-2029 ($ million)
        • Chart on Japan - Year-over-year growth 2024-2029 (%)
        • Data Table on Japan - Year-over-year growth 2024-2029 (%)
      • 12.13 India - Market size and forecast 2024-2029
        • Chart on India - Market size and forecast 2024-2029 ($ million)
        • Data Table on India - Market size and forecast 2024-2029 ($ million)
        • Chart on India - Year-over-year growth 2024-2029 (%)
        • Data Table on India - Year-over-year growth 2024-2029 (%)
      • 12.14 Canada - Market size and forecast 2024-2029
        • Chart on Canada - Market size and forecast 2024-2029 ($ million)
        • Data Table on Canada - Market size and forecast 2024-2029 ($ million)
        • Chart on Canada - Year-over-year growth 2024-2029 (%)
        • Data Table on Canada - Year-over-year growth 2024-2029 (%)
      • 12.15 South Korea - Market size and forecast 2024-2029
        • Chart on South Korea - Market size and forecast 2024-2029 ($ million)
        • Data Table on South Korea - Market size and forecast 2024-2029 ($ million)
        • Chart on South Korea - Year-over-year growth 2024-2029 (%)
        • Data Table on South Korea - Year-over-year growth 2024-2029 (%)
      • 12.16 France - Market size and forecast 2024-2029
        • Chart on France - Market size and forecast 2024-2029 ($ million)
        • Data Table on France - Market size and forecast 2024-2029 ($ million)
        • Chart on France - Year-over-year growth 2024-2029 (%)
        • Data Table on France - Year-over-year growth 2024-2029 (%)
      • 12.17 Italy - Market size and forecast 2024-2029
        • Chart on Italy - Market size and forecast 2024-2029 ($ million)
        • Data Table on Italy - Market size and forecast 2024-2029 ($ million)
        • Chart on Italy - Year-over-year growth 2024-2029 (%)
        • Data Table on Italy - Year-over-year growth 2024-2029 (%)
      • 12.18 Market opportunity by geography
        • Market opportunity by geography ($ million)
        • Data Tables on Market opportunity by geography ($ million)

      13 Drivers, Challenges, and Opportunity/Restraints

      • 13.1 Market drivers
        • 13.2 Market challenges
          • 13.3 Impact of drivers and challenges
            • Impact of drivers and challenges in 2024 and 2029
          • 13.4 Market opportunities/restraints

            14 Competitive Landscape

            • 14.1 Overview
              • 14.2 Competitive Landscape
                • Overview on criticality of inputs and factors of differentiation
              • 14.3 Landscape disruption
                • Overview on factors of disruption
              • 14.4 Industry risks
                • Impact of key risks on business

              15 Competitive Analysis

              • 15.1 Companies profiled
                • Companies covered
              • 15.2 Company ranking index
                • Company ranking index
              • 15.3 Market positioning of companies
                • Matrix on companies position and classification
              • 15.4 Adobe Inc.
                • Adobe Inc. - Overview
                • Adobe Inc. - Business segments
                • Adobe Inc. - Key news
                • Adobe Inc. - Key offerings
                • Adobe Inc. - Segment focus
                • SWOT
              • 15.5 Alamy Ltd.
                • Alamy Ltd. - Overview
                • Alamy Ltd. - Product / Service
                • Alamy Ltd. - Key offerings
                • SWOT
              • 15.6 Arcangel Images Inc.
                • Arcangel Images Inc. - Overview
                • Arcangel Images Inc. - Product / Service
                • Arcangel Images Inc. - Key offerings
                • SWOT
              • 15.7 Can Stock Photo Inc.
                • Can Stock Photo Inc. - Overview
                • Can Stock Photo Inc. - Product / Service
                • Can Stock Photo Inc. - Key offerings
                • SWOT
              • 15.8 Cimpress Plc
                • Cimpress Plc - Overview
                • Cimpress Plc - Business segments
                • Cimpress Plc - Key offerings
                • Cimpress Plc - Segment focus
                • SWOT
              • 15.9 Depositphotos Inc.
                • Depositphotos Inc. - Overview
                • Depositphotos Inc. - Product / Service
                • Depositphotos Inc. - Key offerings
                • SWOT
              • 15.10 Dissolve Inc.
                • Dissolve Inc. - Overview
                • Dissolve Inc. - Product / Service
                • Dissolve Inc. - Key offerings
                • SWOT
              • 15.11 Dreamstime
                • Dreamstime - Overview
                • Dreamstime - Product / Service
                • Dreamstime - Key offerings
                • SWOT
              • 15.12 Envato Pty Ltd.
                • Envato Pty Ltd. - Overview
                • Envato Pty Ltd. - Product / Service
                • Envato Pty Ltd. - Key offerings
                • SWOT
              • 15.13 Getty Images Holdings Inc.
                • Getty Images Holdings Inc. - Overview
                • Getty Images Holdings Inc. - Product / Service
                • Getty Images Holdings Inc. - Key offerings
                • SWOT
              • 15.14 Image Source Ltd.
                • Image Source Ltd. - Overview
                • Image Source Ltd. - Product / Service
                • Image Source Ltd. - Key offerings
                • SWOT
              • 15.15 Inmagine Lab Pte. Ltd.
                • Inmagine Lab Pte. Ltd. - Overview
                • Inmagine Lab Pte. Ltd. - Product / Service
                • Inmagine Lab Pte. Ltd. - Key offerings
                • SWOT
              • 15.16 PIXTA Inc.
                • PIXTA Inc. - Overview
                • PIXTA Inc. - Product / Service
                • PIXTA Inc. - Key offerings
                • SWOT
              • 15.17 Robert Harding Picture Library Ltd.
                • Robert Harding Picture Library Ltd. - Overview
                • Robert Harding Picture Library Ltd. - Product / Service
                • Robert Harding Picture Library Ltd. - Key offerings
                • SWOT
              • 15.18 Shutterstock Inc.
                • Shutterstock Inc. - Overview
                • Shutterstock Inc. - Product / Service
                • Shutterstock Inc. - Key offerings
                • SWOT

              16 Appendix

              • 16.1 Scope of the report
                • 16.2 Inclusions and exclusions checklist
                  • Inclusions checklist
                  • Exclusions checklist
                • 16.3 Currency conversion rates for US$
                  • Currency conversion rates for US$
                • 16.4 Research methodology
                  • Research methodology
                • 16.5 Data procurement
                  • Information sources
                • 16.6 Data validation
                  • Data validation
                • 16.7 Validation techniques employed for market sizing
                  • Validation techniques employed for market sizing
                • 16.8 Data synthesis
                  • Data synthesis
                • 16.9 360 degree market analysis
                  • 360 degree market analysis
                • 16.10 List of abbreviations
                  • List of abbreviations

                Research Methodology

                Technavio presents a detailed picture of the market by way of study, synthesis, and summation of data from multiple sources. The analysts have presented the various facets of the market with a particular focus on identifying the key industry influencers. The data thus presented is comprehensive, reliable, and the result of extensive research, both primary and secondary.

                INFORMATION SOURCES

                Primary sources

                • Manufacturers and suppliers
                • Channel partners
                • Industry experts
                • Strategic decision makers

                Secondary sources

                • Industry journals and periodicals
                • Government data
                • Financial reports of key industry players
                • Historical data
                • Press releases

                DATA ANALYSIS

                Data Synthesis

                • Collation of data
                • Estimation of key figures
                • Analysis of derived insights

                Data Validation

                • Triangulation with data models
                • Reference against proprietary databases
                • Corroboration with industry experts

                REPORT WRITING

                Qualitative

                • Market drivers
                • Market challenges
                • Market trends
                • Five forces analysis

                Quantitative

                • Market size and forecast
                • Market segmentation
                • Geographical insights
                • Competitive landscape

                Interested in this report?

                Get your sample now to see our research methodology and insights!

                Download Now

                Frequently Asked Questions

                Stock Images market growth will increase by $ 1280.7 mn during 2025-2029 .

                The Stock Images market is expected to grow at a CAGR of 5.3% during 2025-2029 .

                Stock Images market is segmented by Application( Editorial, Commercial) Product( Still images, Footage, APAC, Middle East and Africa, South America)

                Adobe Inc., Alamy Ltd., Arcangel Images Inc., Can Stock Photo Inc., Canva Pty Ltd., Cimpress Plc, Depositphotos Inc., Design Pics Inc., Dissolve Inc., Dreamstime, Eezy Inc., Envato Pty Ltd., Getty Images Holdings Inc., Image Source Ltd., Inmagine Lab Pte. Ltd., Pixabay GmbH, PIXTA Inc., Robert Harding Picture Library Ltd., Shutterstock Inc., Vexels Inc. S.A. are a few of the key vendors in the Stock Images market.

                North America will register the highest growth rate of 43% among the other regions. Therefore, the Stock Images market in North America is expected to garner significant business opportunities for the vendors during the forecast period.

                US, UK, China, Germany, Canada, Japan, India, South Korea, France, Italy

                • Increased popularity of stock images for digital and social media marketingRising Internet penetration and the growing use of smart gadgets is the driving factor this market.
                • such as smartphones and tablets is the driving factor this market.
                • have resulted in growing exposure to social and digital media platforms. Nowadays is the driving factor this market.
                • social media platforms are increasingly used for the marketing of different products and services. Moreover is the driving factor this market.
                • the popularity of stock images on social media platforms is the driving factor this market.
                • such as Facebook is the driving factor this market.
                • Instagram is the driving factor this market.
                • Twitter is the driving factor this market.
                • Pinterest is the driving factor this market.
                • Google+ is the driving factor this market.
                • and Snapchat is the driving factor this market.
                • has been growing. This has increased the visibility of these images and enhanced the growth prospects for stock image providers. Social media has become one of the biggest platforms for advertisements is the driving factor this market.
                • marketing is the driving factor this market.
                • and customer acquisitions. For example is the driving factor this market.
                • a vendor in the market is the driving factor this market.
                • Shutterstock is the driving factor this market.
                • uses social media platforms to leverage the popularity of its stock images. The company generates most of its revenue through the sale of stock photographs is the driving factor this market.
                • while the growth in the number of social media platforms has also benefited the performance of the company over the years.In addition is the driving factor this market.
                • the growing popularity and use of stock images on social media platforms have also encouraged several players in the market to introduce different tools that aid their clients in transforming their images easily for use on different social media platforms. For instance is the driving factor this market.
                • Shutterstock offers Editor and Editor Pro tools is the driving factor this market.
                • which offer feature-filled cloud-based workflow tools to provide creative professionals with a strong solution to size is the driving factor this market.
                • edit is the driving factor this market.
                • and enhance their images quickly for immediate use in presentations is the driving factor this market.
                • social media posts is the driving factor this market.
                • and advertisements. These add-on services also help market players to attract customers to their wide range of services. Social media and digital platforms are gaining rapid traction over the years due to their increased popularity and use. This has further encouraged different marketing agencies to leverage these platforms to advertise a product or service. The success of any advertisement or promotional campaign is measured by the number of views and responses that it generates. For instance is the driving factor this market.
                • on Twitter is the driving factor this market.
                • the success of any post is measured based on the number of retweets. Also is the driving factor this market.
                • posts on Twitter that contain images receive 150% more retweets than an ordinary tweet. This further increases the demand for stock images across the globe for advertisements and promotional purposes. Similarly is the driving factor this market.
                • for other vendors in the global stock images market is the driving factor this market.
                • using social media has become an essential part of their advertising and marketing strategies to expand the customer base. Thus is the driving factor this market.
                • the growing popularity of digital and social media marketing will drive the demand for stock images is the driving factor this market.
                • which is the driving factor this market.
                • in turn is the driving factor this market.
                • will boost the growth of the market in focus during the forecast period. is the driving factor this market.

                The Stock Images market vendors should focus on grabbing business opportunities from the Editorial segment as it accounted for the largest market share in the base year.