
Retail Touch Screen Display Market Size 2025-2029
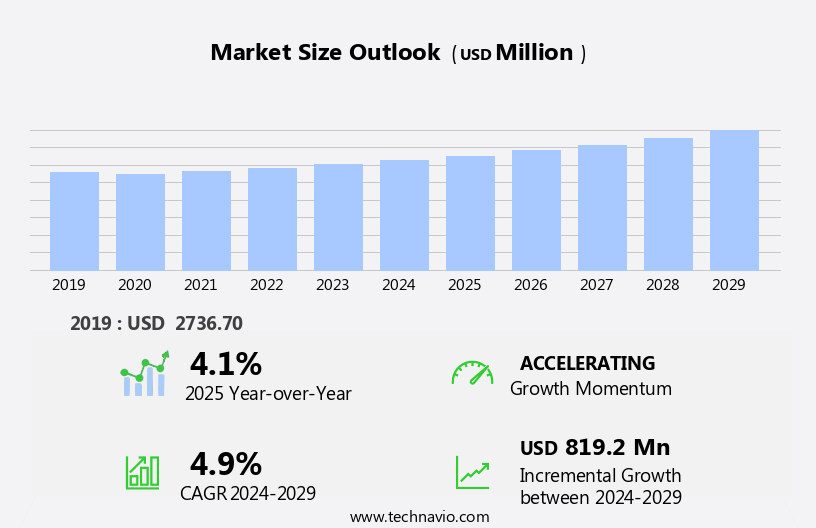
The retail touch screen display market size is forecast to increase by USD 819.2 million, at a CAGR of 4.9% between 2024 and 2029.
- The market is experiencing significant growth due to the increasing demand for interactive retail solutions. Consumers are seeking more engaging shopping experiences, and touch screen displays offer a dynamic and personalized way to browse products and make purchases. This trend is particularly prominent in sectors such as fashion, electronics, and food retail, where visual appeal and quick decision-making are crucial. However, the market also faces challenges. Security and data privacy risks associated with touch screen displays are becoming increasingly prominent.
- With the collection and processing of sensitive customer data, retailers must ensure robust cybersecurity measures are in place to protect against potential breaches. Additionally, the high cost of implementing and maintaining these systems can be a barrier to entry for smaller retailers. These challenges necessitate strategic planning and investment in both technology and security to capitalize on the opportunities presented by the market's growth.
What will be the Size of the Retail Touch Screen Display Market during the forecast period?
The market continues to evolve, driven by advancements in technology and increasing demand for interactive and automated retail experiences. Touchscreen displays are integrated into various sectors, including point-of-sale (POS) systems, digital signage, interactive kiosks, and self-service checkout. These displays offer high resolution, ensuring clear and vibrant visuals. Data security is a crucial consideration, with touchscreens featuring IP rating and payment processing capabilities. POS software and installation services enable seamless order processing and customer segmentation. Power consumption and viewing angle are essential factors, with energy efficiency and wide viewing angles enhancing customer experience. Sales performance tracking and data visualization tools provide valuable insights for retailers.
Interactive content and digital signage software enable engaging customer experiences, while real-time analytics and customer behavior analytics offer valuable data for retailers. Touchscreen technology is continually advancing, with capacitive touchscreens and multi-touch displays offering improved sensitivity. Retail automation and digital transformation are key trends, with touchscreens integrated into interactive tables, walls, and advertising displays. Remote management and cloud-based management solutions enable easy maintenance and updates. Accessibility features and customer experience are increasingly important, with touchscreens offering self-service checkout and digital menu boards. Warranty support and software integration ensure seamless operation and compatibility with various hardware and operating systems. The ongoing dynamism of the market reflects the evolving needs of retailers and consumers, with continuous innovation and integration of new technologies shaping the future of retail.
How is this Retail Touch Screen Display Industry segmented?
The retail touch screen display industry research report provides comprehensive data (region-wise segment analysis), with forecasts and estimates in "USD million" for the period 2025-2029, as well as historical data from 2019-2023 for the following segments.
- Technology
- Capacitive
- Resistive
- Infrared
- Optical
- Others
- End-user
- Departmental stores
- Apparel and footwear
- Jewelry and watches
- Bags and luggage
- Others
- Product Type
- LCD Displays
- LED Displays
- OLED Displays
- Application
- Point of Sale (POS) Systems
- Interactive Kiosks
- Digital Signage
- Geography
- North America
- US
- Canada
- Europe
- France
- Germany
- Spain
- UK
- APAC
- China
- India
- Japan
- South Korea
- Rest of World (ROW)
- North America
By Technology Insights
The capacitive segment is estimated to witness significant growth during the forecast period.
The market encompasses various technologies, including LCD panels and touchscreens, which cater to diverse retail applications. Capacitive touch technology, a significant segment, includes surface capacitive and projected capacitive (PCAP) touch screens. Surface capacitive touch, with its conductive layer detecting electrical changes upon contact, offers enhanced clarity and durability. However, it necessitates direct skin contact or a capacitive stylus for optimal performance. Applications span point-of-sale systems, digital signage, and high-traffic retail areas. PCAP touch panels, known for their precision and responsiveness, employ a grid of electrodes to detect touch. They provide superior multi-touch functionality and can be operated with gloves or other objects.
Applications include interactive kiosks, digital menu boards, and self-service checkout systems. Display resolution plays a crucial role in retail touch screens, ensuring crisp and clear visuals for product information, promotional content, and digital signage. Data security is essential for protecting sensitive customer and transactional data, with encryption, tokenization, and secure communication protocols integral to touch screen displays. Touchscreen sensitivity, a critical factor for customer engagement, enables responsive and intuitive interaction. Order processing and customer segmentation are streamlined through POS software, while IP rating ensures operational functionality in diverse environments. Payment processing and inventory management are further facilitated by touchscreen technology.
Power consumption, an essential consideration for retail operations, is minimized through energy efficiency and power-saving features. Viewing angles, sales performance tracking, and interactive content contribute to an engaging customer experience. Data visualization and real-time analytics provide valuable insights into retail trends and customer behavior. Retail automation, digital transformation, and remote management are key trends, with cloud-based management and software integration streamlining retail operations. Accessibility features cater to diverse customer needs, while customer feedback and warranty support ensure customer satisfaction. In summary, the market is characterized by advanced technologies, including capacitive touchscreens, LCD panels, and digital signage software, which cater to various retail applications and enhance the customer experience.
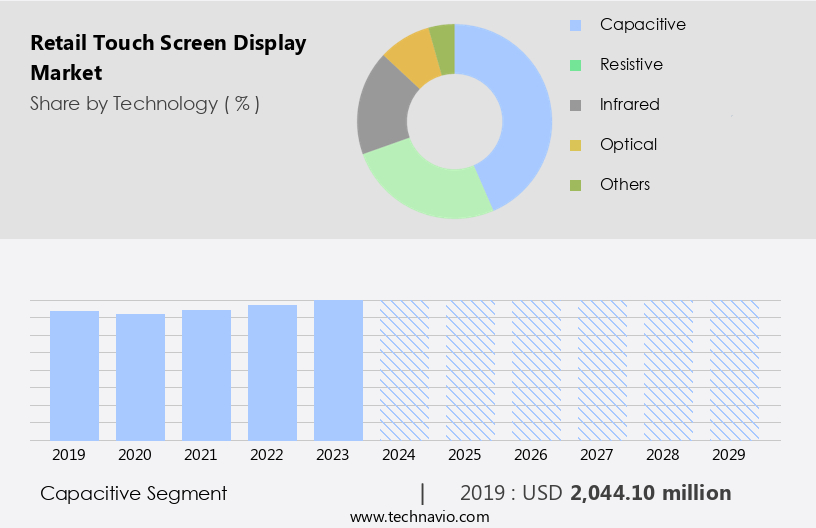
The Capacitive segment was valued at USD 2044.10 million in 2019 and showed a gradual increase during the forecast period.
Regional Analysis
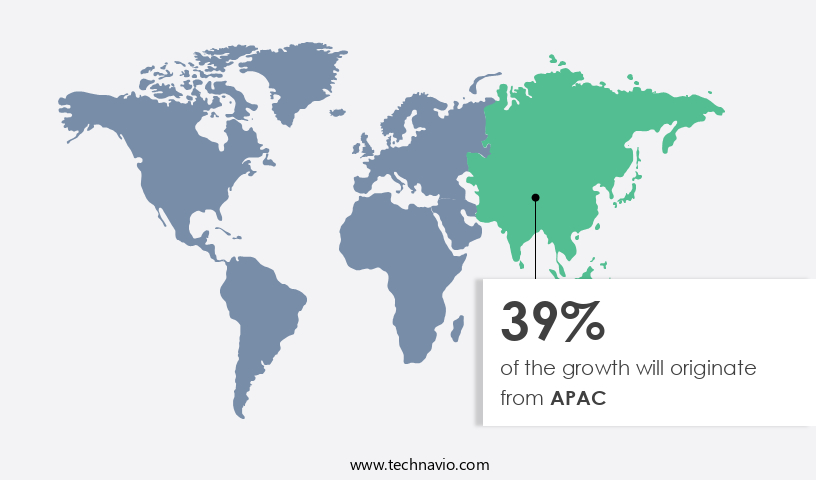
APAC is estimated to contribute 39% to the growth of the global market during the forecast period.Technavio’s analysts have elaborately explained the regional trends and drivers that shape the market during the forecast period.
The market in the Asia-Pacific (APAC) region is experiencing significant growth due to technological advancements, retail modernization, and evolving consumer preferences. Key contributors to this expansion include China, India, and Japan. In China, the extensive retail ecosystem and increasing adoption of smart retail solutions fuel market growth. According to the National Bureau of Statistics, retail sales of consumer goods in urban areas reached approximately USD5.98 trillion in 2024, representing a 3.2 percent increase from the previous year. The catering industry income also grew to approximately USD771 billion in 2024, signifying a 5.1 percent increase. Touchscreen displays with high display resolution and advanced touchscreen sensitivity are increasingly popular, offering improved customer engagement and interactive experiences.
Data security is a critical concern for retailers, leading to the adoption of secure touchscreen controllers and pos software. IP rating and payment processing capabilities are essential features for outdoor retail installations. Customer segmentation and sales performance tracking enable targeted marketing and personalized customer experiences. Retail automation, digital signage software, and interactive kiosks streamline operations and enhance the shopping experience. Interactive tables and walls, multi-touch displays, and customer feedback mechanisms facilitate engagement and data visualization. Inventory management and promotional content are essential components of retail touch screen displays. Anti-glare coatings and operating system compatibility ensure optimal viewing angles and customer experience.
Energy efficiency and hardware compatibility are essential considerations for retailers. Security features and warranty support are crucial for maintaining customer trust and confidence. Real-time analytics and retail display solutions offer valuable insights into customer behavior and preferences, enabling retailers to optimize the customer journey and improve sales performance. Accessibility features and customer experience enhancements are essential for catering to diverse customer needs and expectations. Retail technology, cloud-based management, and retail analytics are driving digital transformation in the retail sector. Point-of-sale systems, digital menu boards, and OLED and resistive touchscreen displays are popular choices for retailers. Response time and contrast ratio are essential performance metrics for touchscreen displays.
Customer journey optimization and software integration are crucial for ensuring seamless retail operations and enhancing the overall shopping experience. Maintenance services and self-service checkout options enable retailers to reduce labor costs and improve operational efficiency. Digital asset management and touchscreen technology enable retailers to effectively manage and showcase their product information and promotional content.
Market Dynamics
Our researchers analyzed the data with 2024 as the base year, along with the key drivers, trends, and challenges. A holistic analysis of drivers will help companies refine their marketing strategies to gain a competitive advantage.
What are the key market drivers leading to the rise in the adoption of Retail Touch Screen Display Industry?
- The surge in consumer preference for interactive retail experiences is the primary catalyst fueling market growth in this sector.
- The market is experiencing significant growth due to the increasing demand for interactive solutions in retail environments. Self-service kiosks, digital signage, and product information displays are becoming increasingly popular, as they offer numerous benefits for both retailers and consumers. Self-service kiosks enable customers to search for products, check prices, and complete transactions independently, thereby reducing wait times and enhancing customer satisfaction. Touch screen technology integrated into these kiosks provides an intuitive and user-friendly interface, making it easier for customers to access information and services. Moreover, digital signage and menu boards offer retailers the ability to display promotional content and product information in a dynamic and engaging way.
- OLED displays and anti-glare coating ensure high-quality visuals, even in bright lighting conditions. Operating system compatibility ensures seamless integration with various retail systems, while digital asset management systems facilitate easy content updates and management. Furthermore, touchscreen technology's quick response time and customer behavior analytics capabilities enable retailers to gain valuable insights into customer preferences and trends, enabling them to tailor their offerings and marketing strategies accordingly. With the ongoing digital transformation in the retail industry, the adoption of touch screen displays is expected to continue growing, providing retailers with innovative solutions to enhance customer engagement and streamline operations.
What are the market trends shaping the Retail Touch Screen Display Industry?
- The introduction of new products is a prevailing market trend. It is essential for businesses to stay informed and prepared for the latest innovations in order to remain competitive.
- The market is witnessing significant growth due to the integration of advanced technologies and the increasing need for improved customer experience in retail environments. Security features, such as data encryption and access control, are essential considerations for businesses to ensure the protection of sensitive customer information. Warranty support and kiosk software enable easy installation and maintenance of these displays. Real-time analytics and retail technology, including cloud-based management and retail analytics, optimize the customer journey by providing valuable insights into shopping behavior.
- Accessibility features, such as LED backlighting and energy efficiency, cater to various customer needs and reduce operational costs. Hardware compatibility with existing systems and customer feedback mechanisms ensure a seamless transition to touch screen displays. Interactive and immersive displays offer a harmonious blend of technology and design, enhancing the overall shopping experience.
What challenges does the Retail Touch Screen Display Industry face during its growth?
- The growth of the industry is significantly impacted by the presence of security and data privacy risks. These risks, which are a major concern for professionals, can potentially compromise sensitive information and undermine trust between organizations and their clients. It is essential for businesses to prioritize the implementation of robust security measures and adhere to data privacy regulations to mitigate these risks and protect their reputation.
- In the retail industry, the integration of software into touch screen displays is becoming increasingly prevalent. This trend encompasses the use of interactive kiosks, POS systems, and digital signage, all of which handle sensitive customer data. As these technologies gain popularity, they become prime targets for cyber threats, posing significant risks to retailers. One notable incident occurred in April 2023, when NCR, a leading POS system provider, was hit by a ransomware attack. This incident disrupted NCR's Aloha POS system and Counterpoint, causing operational disruptions for restaurants and retailers.
- These disruptions included issues with processing payments and managing inventory. Given the sensitive nature of the data being handled, robust security measures are essential to mitigate these risks. Retailers must prioritize data privacy and security to protect their customers' personal and financial information.
Exclusive Customer Landscape
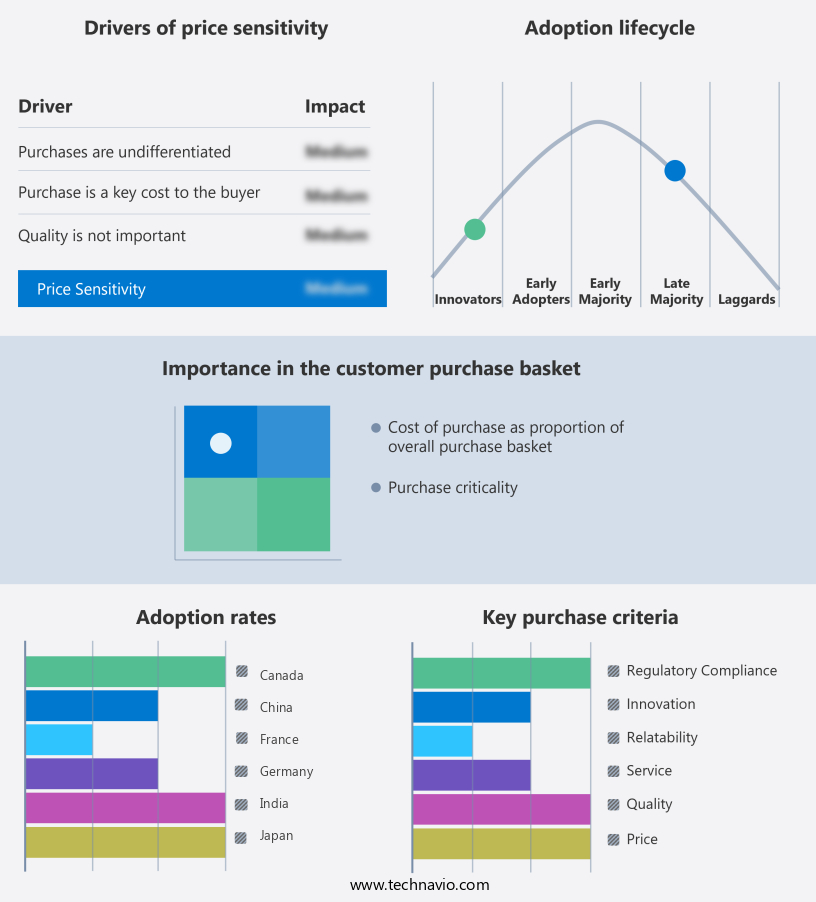
The retail touch screen display market forecasting report includes the adoption lifecycle of the market, covering from the innovator’s stage to the laggard’s stage. It focuses on adoption rates in different regions based on penetration. Furthermore, the retail touch screen display market report also includes key purchase criteria and drivers of price sensitivity to help companies evaluate and develop their market growth analysis strategies.
Customer Landscape
Key Companies & Market Insights
Companies are implementing various strategies, such as strategic alliances, retail touch screen display market forecast, partnerships, mergers and acquisitions, geographical expansion, and product/service launches, to enhance their presence in the industry.
3M Co. - This company specializes in retail touch screen displays, showcasing advanced technology like the 3M Multi-Touch Display C3266PW. This innovative solution empowers users to collaborate and engage with multi-user applications through its multi-touch capabilities. By delivering a seamless and interactive experience, it sets the stage for groundbreaking retail applications.
The industry research and growth report includes detailed analyses of the competitive landscape of the market and information about key companies, including:
- 3M Co.
- AUO Corp.
- Bitsy Infotech Pvt. Ltd.
- BOE Technology Group Co. Ltd.
- Elo Touch Solutions Inc.
- Firstouch Solutions Pvt. Ltd.
- Innolux Corp.
- LG Display Co. Ltd.
- Microchip Technology Inc.
- Panasonic Holdings Corp.
- Planar Systems Inc.
- Promethean World Ltd.
- Samsung Electronics Co. Ltd.
- Sharp Corp.
- Touch International Inc.
- TPK Holding Co. Ltd.
- Tyco Touch Inc.
- ViewSonic Corp.
- Wintec
Qualitative and quantitative analysis of companies has been conducted to help clients understand the wider business environment as well as the strengths and weaknesses of key industry players. Data is qualitatively analyzed to categorize companies as pure play, category-focused, industry-focused, and diversified; it is quantitatively analyzed to categorize companies as dominant, leading, strong, tentative, and weak.
Recent Development and News in Retail Touch Screen Display Market
- In February 2023, Samsung Displays, a leading player in the market, introduced its new large-format, QHD (Quad High Definition) touch screen displays, designed specifically for the retail industry (Samsung Press Release, 2023). These displays offer enhanced resolution and improved touch response, aiming to provide a more engaging shopping experience for consumers.
- In May 2024, LG Display and Microsoft Corporation announced a strategic partnership to co-develop and manufacture advanced touch screen displays for Microsoft's retail stores and other retailers (Microsoft News Center, 2024). This collaboration is expected to bring innovative and interactive touch screen solutions to the retail sector, further transforming the shopping experience.
- In August 2024, Planar Systems, a leading provider of visualization and interaction solutions, completed the acquisition of Just Systems, a leading provider of digital signage and interactive kiosk solutions (Planar Press Release, 2024). This strategic move is expected to expand Planar's product portfolio and strengthen its position in the market.
- In November 2025, the European Union passed new regulations mandating the use of touch screen displays in all retail stores above a certain size, aiming to promote digitalization and enhance the shopping experience for consumers (EU Commission Press Release, 2025). This regulatory development is expected to significantly boost the demand for retail touch screen displays in Europe.
Research Analyst Overview
- The market is experiencing significant advancements, integrating various technologies to enhance consumer engagement and streamline operations. Multi-lingual support and accessibility standards ensure inclusivity, while loyalty programs and targeted advertising boost customer retention. Augmented reality (AR) and virtual reality (VR) offer immersive shopping experiences, and machine learning and artificial intelligence (AI) enable personalized content and dynamic pricing. Bluetooth connectivity, NFC, and wireless communication facilitate seamless transactions, and remote content management streamlines updates. Touchscreen calibration, object recognition, gesture recognition, and facial recognition improve user experience, while interactive content development and voice recognition add convenience.
- Energy Star certification and biometric authentication prioritize sustainability and security. These trends shape the future of retail, transforming the shopping journey into a more interactive, personalized, and efficient experience.
Dive into Technavio’s robust research methodology, blending expert interviews, extensive data synthesis, and validated models for unparalleled Retail Touch Screen Display Market insights. See full methodology.
|
Market Scope |
|
|
Report Coverage |
Details |
|
Page number |
221 |
|
Base year |
2024 |
|
Historic period |
2019-2023 |
|
Forecast period |
2025-2029 |
|
Growth momentum & CAGR |
Accelerate at a CAGR of 4.9% |
|
Market growth 2025-2029 |
USD 819.2 million |
|
Market structure |
Fragmented |
|
YoY growth 2024-2025(%) |
4.1 |
|
Key countries |
US, China, India, Japan, Germany, UK, Canada, South Korea, France, and Spain |
|
Competitive landscape |
Leading Companies, Market Positioning of Companies, Competitive Strategies, and Industry Risks |
What are the Key Data Covered in this Retail Touch Screen Display Market Research and Growth Report?
- CAGR of the Retail Touch Screen Display industry during the forecast period
- Detailed information on factors that will drive the growth and forecasting between 2025 and 2029
- Precise estimation of the size of the market and its contribution of the industry in focus to the parent market
- Accurate predictions about upcoming growth and trends and changes in consumer behaviour
- Growth of the market across APAC, North America, Europe, South America, and Middle East and Africa
- Thorough analysis of the market’s competitive landscape and detailed information about companies
- Comprehensive analysis of factors that will challenge the retail touch screen display market growth of industry companies
We can help! Our analysts can customize this retail touch screen display market research report to meet your requirements.
 RIA -
RIA - 
