
Retinal Drugs Market Size 2025-2029
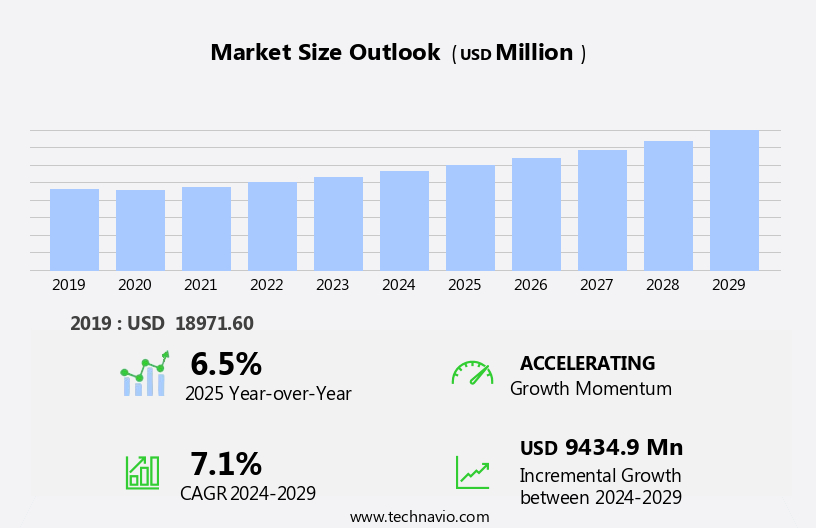
The retinal drugs market size is forecast to increase by USD 9.43 billion at a CAGR of 7.1% between 2024 and 2029.
- The market is experiencing significant growth due to the rising prevalence of retinal diseases, particularly in the aging population. According to the World Health Organization, an estimated 196 million people live with diabetic retinopathy or diabetic macular edema worldwide. This number is projected to increase by 35% by 2030. The development of innovative therapies, such as gene therapies and biologics, offers new opportunities for treating these conditions, providing a potential solution to the unmet medical needs. However, the high cost associated with retinal disease therapy remains a significant challenge for both patients and healthcare systems. This market dynamic presents both opportunities and challenges for stakeholders. However, the high cost associated with retinal disease therapy remains a major challenge for both patients and healthcare providers.
- Companies seeking to capitalize on this market should focus on developing cost-effective therapies while ensuring clinical efficacy. Collaborations and partnerships between industry players and research institutions can help drive innovation and bring new treatments to market. Additionally, regulatory approvals and reimbursement policies will play a crucial role in determining the market's growth trajectory. Overall, the market is poised for growth, driven by the increasing prevalence of retinal diseases and the development of innovative therapies, despite the high cost associated with treatment. Companies that can navigate these challenges effectively will be well-positioned to capitalize on this market opportunity. Additionally, advancements in gene therapy and stem cell research hold great promise for the treatment of retinal diseases, further fueling market growth.
What will be the Size of the Retinal Drugs Market during the forecast period?
- The market is experiencing significant growth due to the increasing prevalence of peripheral vision loss and central vision loss, which disproportionately affects underserved populations and exacerbates healthcare disparities. Health technology assessment and health outcomes research are key areas of focus, as innovative solutions in small molecule drugs, fundus photography, and fluorescein angiography aim to improve health outcomes and address healthcare accessibility. Regulatory agencies are closely monitoring drug interactions, safety, and efficacy through rigorous clinical trials, including double-blind studies and placebo control. Neuroprotective agents, anti-inflammatory drugs, and side effect management are among the research priorities.
- Health economics plays a crucial role in market access, with cost-utility analysis and patient reported outcomes becoming increasingly important in determining drug efficacy and patient preferences. Medical devices, such as remote monitoring tools, are also transforming the landscape by enabling personalized medicine and patient engagement. Market access and drug resistance are ongoing challenges, with cost-benefit analysis and health policy playing essential roles in addressing these issues. The use of statistical analysis, systematic review, and patient satisfaction data is becoming more prevalent in clinical trial design to ensure robust data and minimize adverse events.
- In summary, the market is driven by the need to address healthcare disparities and improve health outcomes through innovative solutions in drug development, healthcare technology, and patient-centric approaches. The market represents a significant and growing sector within the global pharmaceutical industry. With an increasing focus on eye health and vision care, this market is driven by the prevalence of various retinal diseases, including age-related macular degeneration, diabetic retinopathy, and retinal vein occlusion.
How is this Retinal Drugs Industry segmented?
The retinal drugs industry research report provides comprehensive data (region-wise segment analysis), with forecasts and estimates in "USD million" for the period 2025-2029, as well as historical data from 2019-2023 for the following segments.
- Distribution Channel
- Hospital pharmacy
- Retail pharmacy
- Online pharmacy
- Indication
- Macular degeneration
- Diabetic eye disease
- Others
- Drug Class
- VEGF-A antagonist
- TNF-A inhibitor
- Geography
- North America
- US
- Canada
- Europe
- France
- Germany
- Italy
- UK
- APAC
- China
- India
- Japan
- South Korea
- Rest of World (ROW)
- North America
By Distribution Channel Insights
The hospital pharmacy segment is estimated to witness significant growth during the forecast period. Hospital pharmacies serve as essential entities within healthcare systems, supplying medications from various pharmaceutical providers for both outpatient and inpatient treatment in hospitals. These pharmacies offer a range of therapeutic and critical care drugs, some of which are utilized in the treatment of retinal diseases. The primary objective of hospital pharmacies is to procure, store, and distribute medications to patients during their hospital stay. The hospital pharmaceuticals segment held the largest market share in 2024, and its dominance is expected to persist throughout the forecast period. Compounded drugs have gained significant popularity among hospitals, making hospital pharmacies the preferred distribution channel for these products.
Precision medicine and drug delivery systems have emerged as crucial components in modern healthcare, enabling tailored treatment options for patients based on their unique genetic makeup and disease conditions. Pricing strategies play a significant role in the adoption of these advanced pharmaceutical solutions, influencing patient access and affordability. Diagnostic imaging and innovation pipeline contribute to the development of new treatments and improved patient care. Future trends in the market include the integration of patient advocacy, disease management, and clinical practice guidelines to optimize treatment plans and enhance patient outcomes. Standards of care and treatment options continue to evolve, with hospital pharmacies adapting to these changes to provide the best possible patient care. Materials used in retinal drug delivery systems, such as polyethylene and polycarbonate, are subject to stringent quality options and regulatory requirements to ensure safety and efficacy.
By staying informed of the latest research and advancements, hospital pharmacies can ensure they offer the most effective and efficient solutions for their patients.
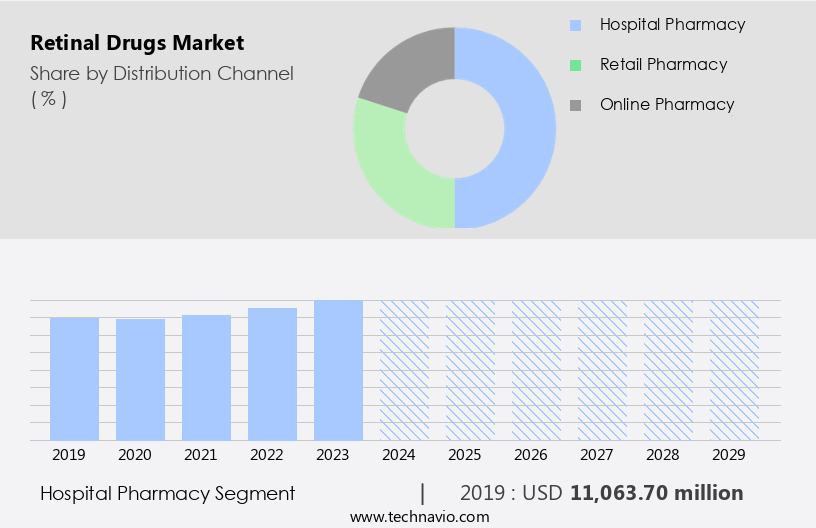
The Hospital pharmacy segment was valued at USD 11.06 billion in 2019 and showed a gradual increase during the forecast period.
Regional Analysis
North America is estimated to contribute 48% to the growth of the global market during the forecast period. Technavio's analysts have elaborately explained the regional trends and drivers that shape the market during the forecast period.
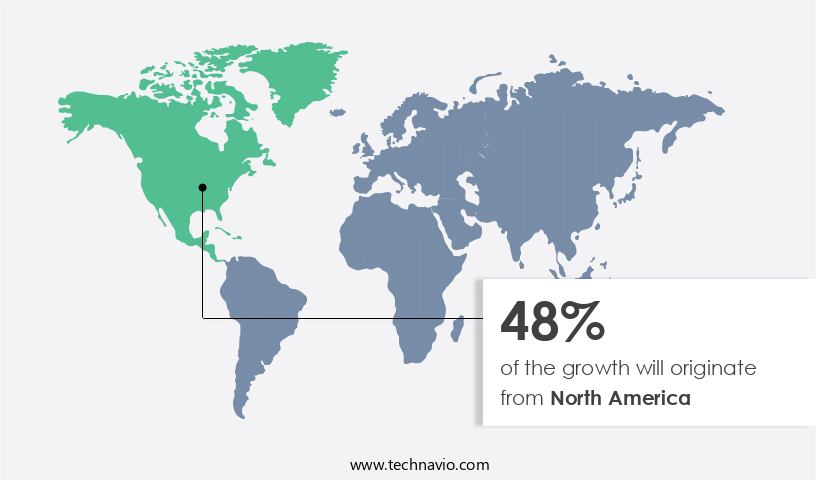
In the global market for retinal drugs, North America holds a significant share, with the US and Canada contributing the largest portion. The US, in particular, is a major revenue generator, driven by the high prevalence of retinal disorders and extensive awareness among the population. Medicare's coverage for anti-VEGF drugs, such as LUCENTIS, EYLEA, and Avastin, which are commonly prescribed for retinal disorders, further bolsters the market's growth. The US market is expected to continue expanding due to the increasing geriatric population and associated risk factors for retinal disorders. Healthcare innovation plays a crucial role in this sector, with research funding from regulatory agencies and academic institutions driving advancements in small molecule drugs and personalized medicine.
Fluorescein angiography and remote monitoring technologies enable improved drug efficacy assessments and patient engagement, further enhancing market potential. Market access remains a critical factor, with drug manufacturers and medical device companies collaborating to ensure seamless access to these treatments for patients. The importance of workplace safety, including brain injuries and employee safety, has led to increased awareness and statutory restrictions in various industries, such as oil & gas, power production, and construction.
Market Dynamics
Our researchers analyzed the data with 2024 as the base year, along with the key drivers, trends, and challenges. A holistic analysis of drivers will help companies refine their marketing strategies to gain a competitive advantage.
What are the Retinal Drugs market drivers leading to the rise in the adoption of Industry?
- The prevalence of retinal diseases is the primary driving factor significantly expanding the market scope. Retinal diseases, including wet AMD, diabetic retinopathy, DME, RVO, and mCNV, are on the rise in both developed and emerging economies. Among these, AMD is the leading cause of visual disability in industrialized nations and the third leading cause of visual impairment globally. According to recent research, approximately 202,200 million people worldwide are affected by MD, with nearly ten out of every ten cases of severe vision loss due to wet AMD. Each year, around 500,000 new cases of wet AMD are diagnosed globally. In North America, approximately 200,000 new cases are identified annually. AMD disproportionately affects older individuals of European descent, making it a significant cause of visual impairment in this demographic.
- Advancements in healthcare technology offer promising solutions for these debilitating conditions. Gene therapy, stem cell therapy, and artificial intelligence are at the forefront of this innovation. The drug approval process is underway for several potential treatments, including gene therapies for RP and stem cell therapies for AMD. Digital health technologies, such as machine learning and AI, are also being leveraged to improve patient outcomes and enhance quality of life for those affected by retinal diseases. These advancements offer hope for those experiencing vision loss and the healthcare providers who care for them.
What are the Retinal Drugs market trends shaping the Industry?
- The emerging market trend underscores the significance of developing innovative therapies. Retinal diseases, including diabetic retinopathy, are a significant health concern worldwide. Innovative technologies, such as gene therapy, eye drops, stem cells, and radiation, are being explored for their potential in treating these conditions. Combination therapies are gaining popularity due to their efficacy in managing retinal diseases. For instance, the combination of anti-VEGF and Ozurdex is now a standard treatment for diabetic macular edema (DME). Various companies are investing in research and development of combination therapies. Two primary approaches under investigation are combining anti-VEGF with anti-platelet-derived growth factor (PDGF) agents and combining anti-VEGF agents with drugs targeting the ANG-Tie2 pathway.
- Other potential combinations include integrating anti-VEGF agents with steroids or steroids with other therapeutic agents. These advancements offer promising possibilities for the effective treatment of retinal diseases.
How does Retinal Drugs market faces challenges face during its growth?
- The high cost of treating retinal diseases poses a significant challenge to the growth of the industry. With escalating healthcare expenses and a rising prevalence of retinal diseases, finding cost-effective and innovative therapies is crucial for the industry's expansion. Retinal drugs, particularly anti-VEGF therapies, have shown promising results in treating conditions such as age-related macular degeneration (AMD) and retinal degeneration. However, the high cost of these drugs is a significant barrier to their widespread adoption and market growth. EYLEA, LUCENTIS, and Avastin are among the most commonly used anti-VEGF agents, with each intravitreal dose costing approximately USD 1,850, USD 2,000, and USD 1,150, respectively. Patients with retinal diseases typically require multiple injections in their first year of treatment and frequent follow-up examinations, leading to substantial additional costs. This financial burden is particularly significant in developing countries, where the affordability of these treatments is a major concern.
- To address this challenge, various initiatives have been undertaken, including public-private partnerships and clinical trials that aim to improve the safety profile and efficacy of retinal drugs. Additionally, emerging technologies, such as data analytics and telemedicine, are being explored to reduce the need for frequent in-person visits and improve patient outcomes. Patient education and advocacy efforts are also crucial in ensuring that patients are fully informed about the benefits and costs of these treatments and can make informed decisions about their care. Despite the challenges, the potential growth potential for retinal drugs remains significant, driven by the increasing prevalence of retinal diseases and the unmet medical need for effective treatments.
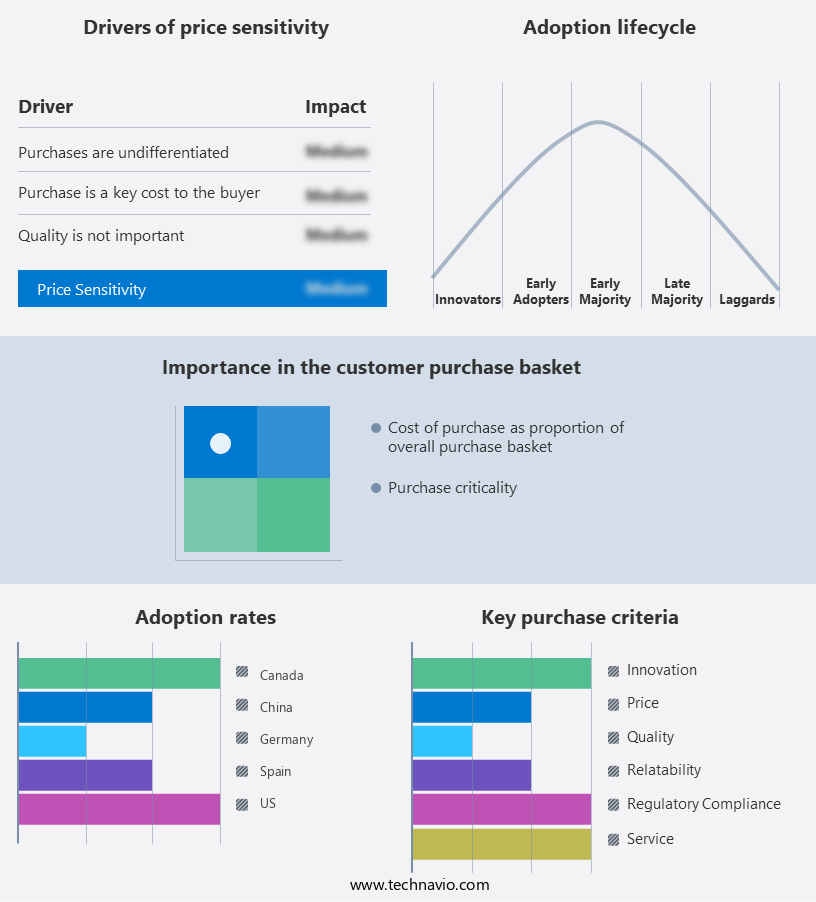
Exclusive Customer Landscape
The retinal drugs market forecasting report includes the adoption lifecycle of the market, covering from the innovator's stage to the laggard's stage. It focuses on adoption rates in different regions based on penetration. Furthermore, the retinal drugs market report also includes key purchase criteria and drivers of price sensitivity to help companies evaluate and develop their market growth analysis strategies.
Customer Landscape
Key Companies & Market Insights
Companies are implementing various strategies, such as strategic alliances, retinal drugs market forecast, partnerships, mergers and acquisitions, geographical expansion, and product/service launches, to enhance their presence in the industry.
AbbVie Inc. - The company specializes in the development and commercialization of innovative retinal drugs, including RGX 314, which targets various retinal diseases.
The industry research and growth report includes detailed analyses of the competitive landscape of the market and information about key companies, including:
- AbbVie Inc.
- Alcon Inc.
- Alimera Sciences Inc.
- Bausch Health Companies Inc.
- Bayer AG
- Bristol Myers Squibb Co.
- F. Hoffmann La Roche Ltd.
- Johnson and Johnson Services Inc.
- Kubota Corp.
- MeiraGTx Holdings Plc.
- Novartis AG
- Ocular Therapeutix Inc
- Oxurion N
- Pfizer Inc.
- Regeneron Pharmaceuticals Inc.
- REGENXBIO Inc
- Sanofi SA
- Santen Pharmaceutical Co. Ltd.
- Teva Pharmaceutical Industries Ltd.
- Visufarma
Qualitative and quantitative analysis of companies has been conducted to help clients understand the wider business environment as well as the strengths and weaknesses of key industry players. Data is qualitatively analyzed to categorize companies as pure play, category-focused, industry-focused, and diversified; it is quantitatively analyzed to categorize companies as dominant, leading, strong, tentative, and weak.
Recent Development and News in Retinal Drugs Market
- The market has witnessed significant developments in recent years, with key players focusing on product launches, technological collaborations, mergers and acquisitions, and geographic expansions to strengthen their market presence. Here are the most noteworthy developments from 2024 to 2025:
- In January 2025, Novartis AG announced the US Food and Drug Administration (FDA) approval of its new retinal drug, Faricimab, for the treatment of neovascular age-related macular degeneration (AMD). This approval marks a significant milestone for Novartis, as Faricimab is the first bispecific monoclonal antibody to target both VEGF-A and angiopoietin-2, offering a potential advantage over existing treatments (Novartis AG, 2025).
- In October 2024, Roche Holding AG and Genentech, Inc. Entered into a strategic collaboration with Regeneron Pharmaceuticals, Inc. To co-promote and co-develop Eylea (aflibercept) in the US market for various retinal indications. This collaboration is expected to enhance the market reach and growth potential of Eylea, which is currently one of the leading retinal drugs (Roche Holding AG, 2024).
- In March 2024, Allergan plc completed the acquisition of ForSight VISION5, a clinical-stage biotechnology company specializing in the development of innovative retinal therapies. This acquisition is aimed at expanding Allergan's portfolio and capabilities in the market, particularly in the area of gene therapy for inherited retinal diseases (Allergan plc, 2024).
- In June 2024, Apellis Pharmaceuticals, Inc. reported positive top-line results from its Phase 3 clinical trial evaluating the efficacy and safety of pegcetacoplan, a complement inhibitor, for the treatment of geographic atrophy secondary to AMD. If approved, pegcetacoplan could potentially disrupt the market dynamics and offer a new treatment option for patients with AMD (Apellis Pharmaceuticals, Inc., 2024).
- These developments underscore the dynamic nature of the market and the ongoing efforts of key players to innovate and expand their offerings to cater to the evolving needs of patients and healthcare providers
Research Analyst Overview
The market continues to evolve as innovations in technology and clinical research drive the development of new treatments for various retinal conditions. One area of significant focus is the use of data analytics in clinical trials to improve the efficiency and effectiveness of drug development. This approach allows researchers to identify trends and patterns in large datasets, enabling more informed decision-making and potentially reducing the time and cost of bringing new therapies to market. Another emerging trend in the market is the adoption of intravitreal injection as a preferred delivery method for various therapies. This technique, which involves injecting drugs directly into the vitreous humor of the eye, has proven effective for the treatment of age-related macular degeneration and other retinal diseases.
The safety profile of intravitreal injections has been well-established, making it a popular choice among healthcare providers and patients. Public-private partnerships have also played a crucial role in advancing the market. These collaborations between academic institutions, pharmaceutical companies, and regulatory agencies have facilitated research funding and accelerated the development of new treatments. For example, partnerships have been instrumental in the advancement of anti-VEGF therapy, which has revolutionized the treatment of conditions such as diabetic retinopathy and macular degeneration. The use of medical devices, such as fundus cameras and diagnostic imaging technologies, has also been a significant contributor to the market.
These tools enable healthcare providers to diagnose and monitor various retinal conditions, leading to earlier intervention and improved patient outcomes. Additionally, remote monitoring technologies have emerged as a promising solution for enhancing patient engagement and enabling more effective disease management. The regulatory agencies play a critical role in the market, ensuring the safety and efficacy of new treatments before they reach the market. The drug approval process can be lengthy and costly, but the rigorous evaluation ensures that patients receive safe and effective therapies. The growth potential of the market is significant, driven by the increasing prevalence of age-related macular degeneration and other retinal diseases.
Patient education and advocacy have become essential components of disease management, with a focus on improving patient engagement and empowering individuals to take an active role in their care. Personalized medicine and precision medicine are also gaining traction in the market, with researchers exploring the potential of gene therapy and stem cell therapy to treat various retinal conditions. These innovative approaches hold the promise of more effective and targeted treatments, leading to improved patient outcomes and quality of life. The market is also being shaped by healthcare innovation, with a focus on developing new drug delivery systems, pricing strategies, and digital health solutions.
For example, machine learning and artificial intelligence are being explored for their potential to improve patient care and enhance the diagnostic process. Looking ahead, the market is expected to continue evolving, with a focus on innovation, patient-centered care, and regulatory compliance. The ongoing development of new treatments and technologies will undoubtedly lead to improved patient outcomes and a better understanding of various retinal conditions.
Dive into Technavio's robust research methodology, blending expert interviews, extensive data synthesis, and validated models for unparalleled Retinal Drugs Market insights. See full methodology.
|
Market Scope |
|
|
Report Coverage |
Details |
|
Page number |
217 |
|
Base year |
2024 |
|
Historic period |
2019-2023 |
|
Forecast period |
2025-2029 |
|
Growth momentum & CAGR |
Accelerate at a CAGR of 7.1% |
|
Market growth 2025-2029 |
USD 9.43 billion |
|
Market structure |
Fragmented |
|
YoY growth 2024-2025(%) |
6.5 |
|
Key countries |
US, Germany, Canada, UK, China, France, Japan, Italy, India, and South Korea |
|
Competitive landscape |
Leading Companies, Market Positioning of Companies, Competitive Strategies, and Industry Risks |
What are the Key Data Covered in this Retinal Drugs Market Research and Growth Report?
- CAGR of the Retinal Drugs industry during the forecast period
- Detailed information on factors that will drive the growth and forecasting between 2025 and 2029
- Precise estimation of the size of the market and its contribution of the industry in focus to the parent market
- Accurate predictions about upcoming growth and trends and changes in consumer behaviour
- Growth of the market across North America, Europe, Asia, and Rest of World (ROW)
- Thorough analysis of the market's competitive landscape and detailed information about companies
- Comprehensive analysis of factors that will challenge the retinal drugs market growth of industry companies
We can help! Our analysts can customize this retinal drugs market research report to meet your requirements.
 RIA -
RIA - 
