Retinol Skincare Product Market Analysis, Size, and Forecast 2026-2030: Europe (Germany, UK, and France), North America (US, Canada, and Mexico), APAC (China, Japan, and South Korea), South America (Brazil and Argentina), Middle East and Africa (Saudi Arabia, UAE, and South Africa), and Rest of World (ROW)

Retinol Skincare Product Market Analysis, Size, and Forecast 2026-2030:
Europe (Germany, UK, and France), North America (US, Canada, and Mexico), APAC (China, Japan, and South Korea), South America (Brazil and Argentina), Middle East and Africa (Saudi Arabia, UAE, and South Africa), and Rest of World (ROW)

Published: Mar 2026 292 Pages SKU: IRTNTR76233

Market Overview at a Glance

$169.91 Mn
Market Opportunity
4.2%
CAGR 2025 - 2030
32.9%
Europe Growth
$624.63 Mn
Offline segment 2024

Retinol Skincare Product Market Size 2026-2030

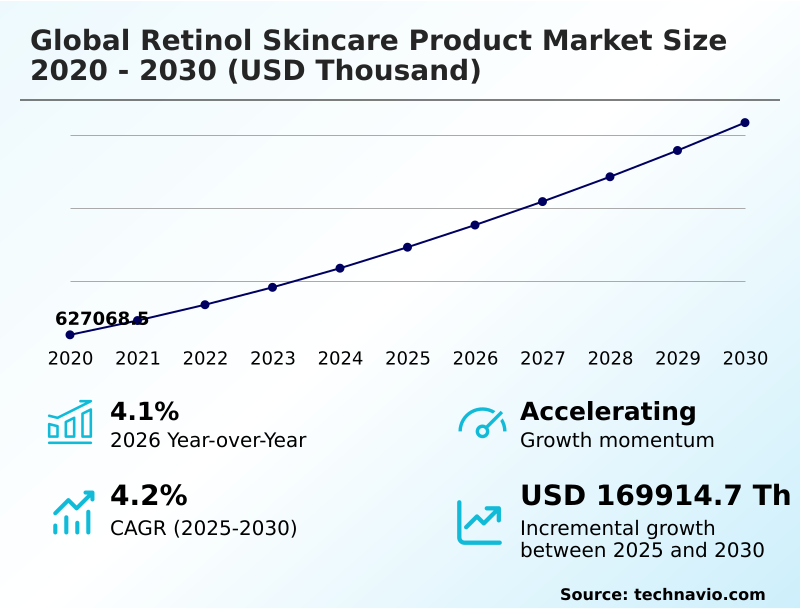
The retinol skincare product market size is valued to increase by USD 169.91 million, at a CAGR of 4.2% from 2025 to 2030. Regulatory compliance and industrialization of low-dose precision formulations will drive the retinol skincare product market.

Major Market Trends & Insights

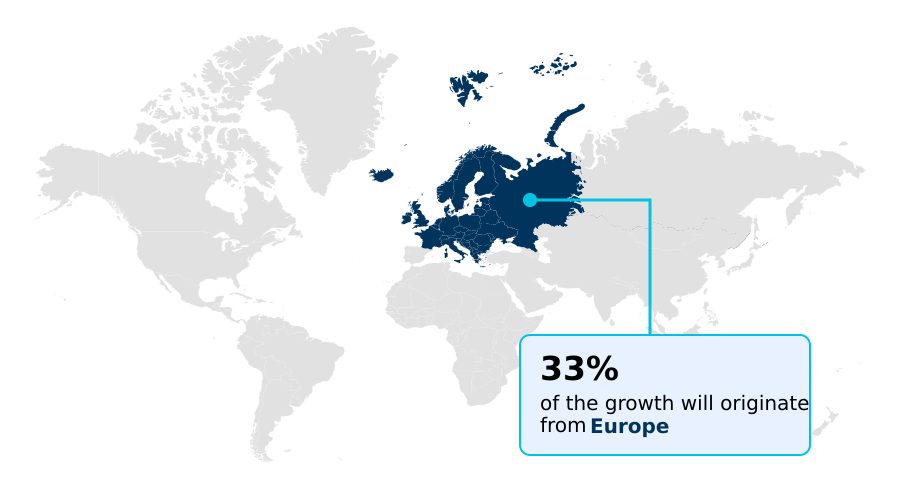
  • Europe dominated the market and accounted for a 32.9% growth during the forecast period.
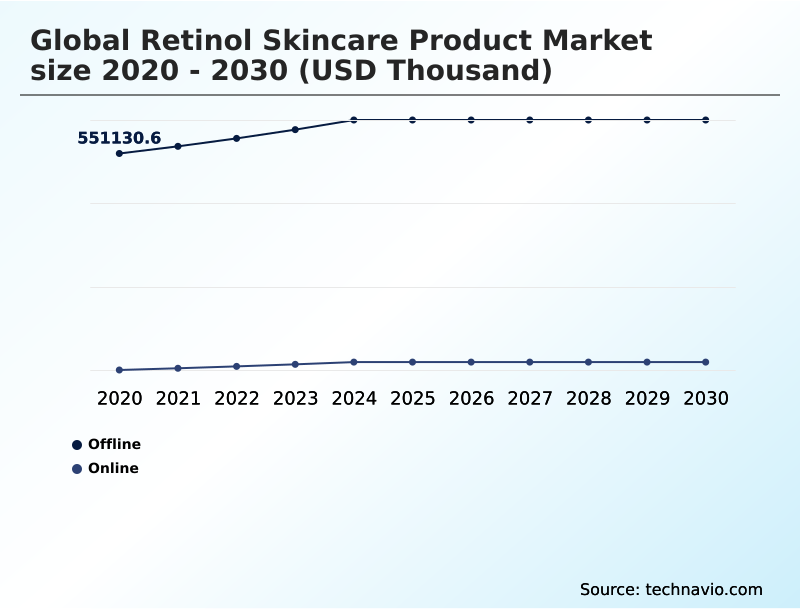
  • By Distribution Channel - Offline segment was valued at USD 624.63 million in 2024
  • By Type - Cream segment accounted for the largest market revenue share in 2024

Market Size & Forecast

  • Market Opportunities:
  • Market Future Opportunities: USD 169.91 million
  • CAGR from 2025 to 2030 : 4.2%

Market Summary

  • The retinol skincare product market is evolving beyond corrective applications, becoming integral to preventive and longevity-focused regimens. Growth is driven by the industrialization of low-dose precision formulations and advanced delivery systems, such as encapsulated retinol and liposomal retinol, which improve consumer tolerability and support the skin moisture barrier.
  • This technological shift makes vitamin a derivatives accessible to a broader pre-aging demographic, fueling demand for beginner-friendly retinol and multi-functional hybrids. A key trend is the rise of bio-retinols like bakuchiol, catering to eco-conscious consumers seeking clean-label formulations.
  • However, the industry faces challenges with the oxidative instability of pure retinol, necessitating sophisticated cold-chain supply logistics and airless pump packaging, which conflicts with sustainable packaging mandates.
  • As a business scenario, a company must balance the high cost of developing stable, time-release delivery systems with competitive pricing, while also navigating differing regional regulations like the quasi-drug classification in Asia and retinol equivalent (re) limits in Europe to maintain global market access and consumer trust.

What will be the Size of the Retinol Skincare Product Market during the forecast period?

Get Key Insights on Market Forecast (PDF) Request Free Sample

How is the Retinol Skincare Product Market Segmented?

The retinol skincare product industry research report provides comprehensive data (region-wise segment analysis), with forecasts and estimates in "USD thousand" for the period 2026-2030, as well as historical data from 2020-2024 for the following segments.

  • Distribution channel
    • Offline
    • Online
  • Type
    • Cream
    • Oil
    • Others
  • Product type
    • Synthetic
    • Natural
  • Geography
    • Europe
      • Germany
      • UK
      • France
    • North America
      • US
      • Canada
      • Mexico
    • APAC
      • China
      • Japan
      • South Korea
    • South America
      • Brazil
      • Argentina
    • Middle East and Africa
      • Saudi Arabia
      • UAE
      • South Africa
    • Rest of World (ROW)

By Distribution Channel Insights

The offline segment is estimated to witness significant growth during the forecast period.

The offline segment remains crucial for the retinol skincare product market, especially within the dermo-cosmetic sub-segment where tactile experience and consultation are paramount. Retail environments enable consumers to assess consumer-grade products firsthand, building trust through tangible quality cues.

This channel is vital for brands offering stabilized retinol and other vitamin a derivatives, as trained staff can explain the benefits of synthetic retinoids and demonstrate airless pump packaging.

The emphasis on ingredient transparency and clinical efficacy, often championed by pharmacy-led brands, supports preventive skincare goals.

As the skinimalism trend grows, retailers are leveraging in-store AI-driven diagnostic tools to recommend precise, effective routines, reinforcing the value of professional-grade skincare and innovations in green chemistry.

Request Free Sample

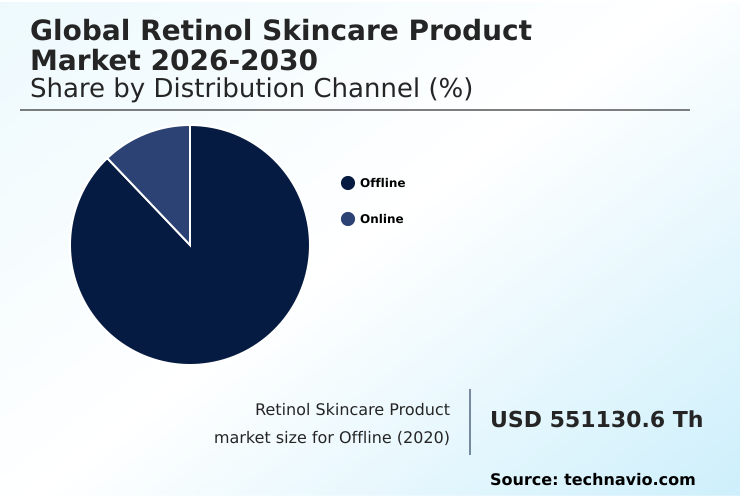
The Offline segment was valued at USD 624.63 million in 2024 and showed a gradual increase during the forecast period.

Request Free Sample

Regional Analysis

Europe is estimated to contribute 32.9% to the growth of the global market during the forecast period.Technavio’s analysts have elaborately explained the regional trends and drivers that shape the market during the forecast period.

See How Retinol Skincare Product Market Demand is Rising in Europe Request Free Sample

North America leads the market, with a growth rate approximately 12% higher than Europe, driven by high consumer literacy regarding the retinol equivalent (re) in products.

In APAC, the market is expanding rapidly as consumers focus on photoaging reversal and treating uneven skin texture with products featuring botanical extracts and micro-encapsulated retinol.

European regulations mandating lower concentrations have spurred innovation in formulations that support skin barrier health and minimize cutaneous irritation, often leveraging advanced lipid-soluble retinoid forms like retinaldehyde.

Across regions, the focus on nighttime repair and the rise of cosmeceuticals is universal, unifying market dynamics despite regional differences in regulatory landscapes.

Market Dynamics

Our researchers analyzed the data with 2025 as the base year, along with the key drivers, trends, and challenges. A holistic analysis of drivers will help companies refine their marketing strategies to gain a competitive advantage.

  • The global retinol skincare product market 2026-2030 is increasingly sophisticated, with a strong focus on the role of delivery systems in retinol efficacy. Innovations in time-release retinol for sensitive skin and advancements in liposomal retinol delivery are crucial for mitigating irritation.
  • Consumers are actively researching topics like the benefits of encapsulated retinol for skin and comparing bakuchiol vs retinol clinical studies to make informed decisions. The market is also shaped by preventive retinol use in twenties, a trend driving demand for low-dose retinol for daily use.
  • Formulators are focused on stabilizing retinol in cosmetic formulations and understanding how to effectively combine retinol with hyaluronic acid to enhance hydration. Navigating regulatory landscapes, such as the strict retinol concentration limits in Europe, presents a significant challenge. The effectiveness of products hinges on their ability to influence retinol's effect on cellular turnover and impact of retinol on collagen synthesis.
  • Success often depends on overcoming the challenges in retinol product packaging and providing clear guidance on managing irritation from high-strength retinoids. For example, improper logistics can lead to a product losing up to 80% of its bioactivity, a far greater loss than the 5% to 10% degradation seen in products managed through a climate-controlled supply chain.
  • This makes dermatological validation of retinol products and transparent communication about synthetic vs natural retinol efficacy essential for brand credibility.

What are the key market drivers leading to the rise in the adoption of Retinol Skincare Product Industry?

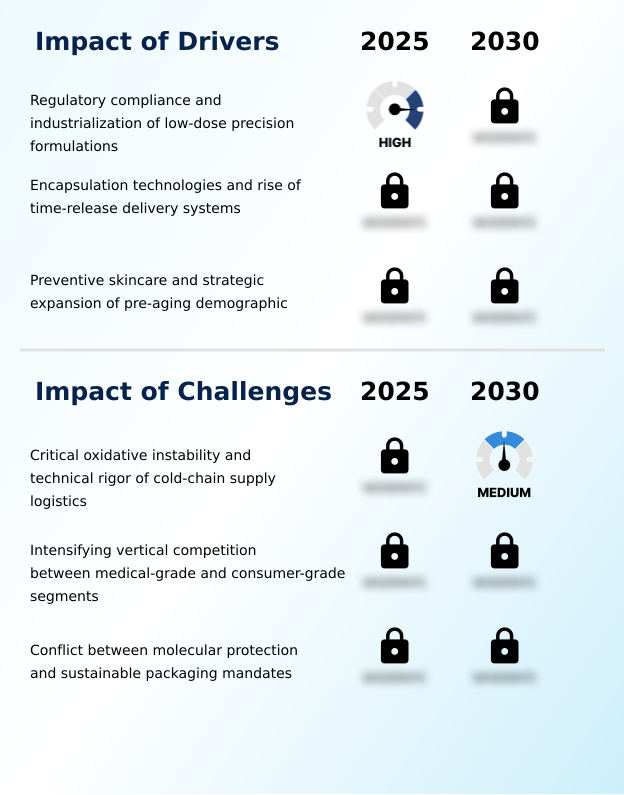
  • The market is primarily driven by heightened regulatory compliance and the subsequent industrialization of low-dose precision formulations designed to enhance consumer safety and product efficacy.

  • Market momentum is fueled by advanced time-release delivery systems, such as encapsulated retinol and liposomal retinol, which enhance efficacy while supporting the skin moisture barrier.
  • These technologies facilitate consistent cellular turnover and collagen biosynthesis, leading to visible results in anti-aging treatments. Demand from the pre-aging demographic for beginner-friendly retinol has increased by 10%, driving the creation of low-dose precision formulations.
  • This trend is supported by dermatologist-led content and the skinification of body care, where multi-functional hybrids with bio-fermented actives are becoming standard. The need for rigorous dermatological validation remains a critical factor for market acceptance.

What are the market trends shaping the Retinol Skincare Product Industry?

  • The market is experiencing a significant trend toward the rise of bio-retinols and sustainable phyto-alternatives. This shift is driven by increasing consumer demand for products with greater skin compatibility and greener manufacturing processes.

  • A primary trend is the shift toward bio-retinols and plant-based alternatives like bakuchiol, which show retinoid-mimicking properties and appeal to eco-conscious consumers seeking clean-label formulations. This is coupled with the rise of precision diagnostics and hyper-personalized protocols, where brands use data to create personalized retinol serums with specific micro-dosing schedules to improve consumer tolerability.
  • This customization extends to the growing male grooming sector, where products featuring anhydrous formulations are gaining traction. The focus on longevity-focused skincare has expanded, with some brands achieving an 18% improvement in customer retention by offering tailored solutions that move beyond traditional anti-aging approaches.

What challenges does the Retinol Skincare Product Industry face during its growth?

  • A key challenge for the market is managing the critical oxidative instability of retinol and the associated technical rigor required for cold-chain supply logistics to maintain product potency.

  • Key challenges include managing the inherent oxidative instability of ingredients like retinyl palmitate, which requires robust cold-chain supply logistics to ensure effective transdermal penetration and prevent degradation. The conflict between the need for protective materials and sustainable packaging mandates is a significant hurdle, with refillable systems showing a failure rate of nearly 30% in maintaining stability.
  • Competition between medical-grade formulations, which may use tretinoin, and over-the-counter products intensifies as consumers seek solutions for corrective anti-aging and post-inflammatory hyperpigmentation. Navigating regional quasi-drug classification systems adds another layer of complexity, challenging brands to balance cellular vitality, skin resilience, and regulatory compliance while supporting long-term skin health span.

Exclusive Technavio Analysis on Customer Landscape

The retinol skincare product market forecasting report includes the adoption lifecycle of the market, covering from the innovator’s stage to the laggard’s stage. It focuses on adoption rates in different regions based on penetration. Furthermore, the retinol skincare product market report also includes key purchase criteria and drivers of price sensitivity to help companies evaluate and develop their market growth analysis strategies.

Customer Landscape of Retinol Skincare Product Industry

Competitive Landscape

Companies are implementing various strategies, such as strategic alliances, retinol skincare product market forecast, partnerships, mergers and acquisitions, geographical expansion, and product/service launches, to enhance their presence in the industry.

Amorepacific Corp. - Offers dermatologist-backed retinol formulations, including creams and serums, engineered to enhance skin texture and combat signs of aging through proven clinical efficacy.

The industry research and growth report includes detailed analyses of the competitive landscape of the market and information about key companies, including:

  • Amorepacific Corp.
  • Augustinus Bader
  • Beiersdorf AG
  • Coty Inc.
  • Kao Corp.
  • Kenvue Inc.
  • Loreal SA
  • Mary Kay Inc.
  • Natura and Co. Holding SA
  • Natura Bisse
  • Oriflame Cosmetics SA
  • Peter Thomas Roth Skin Care
  • Pilgrim
  • Procter and Gamble Co.
  • RoC Skincare
  • Shiseido Co. Ltd.
  • Sunday Riley Modern Skincare
  • The Body Shop International
  • The Estee Lauder Co. Inc.
  • Unilever PLC

Qualitative and quantitative analysis of companies has been conducted to help clients understand the wider business environment as well as the strengths and weaknesses of key industry players. Data is qualitatively analyzed to categorize companies as pure play, category-focused, industry-focused, and diversified; it is quantitatively analyzed to categorize companies as dominant, leading, strong, tentative, and weak.

Recent Development and News in Retinol skincare product market

  • In September, 2024, RoC Skincare launched its Retinol Correxion Line Smoothing 2-Step Peel Pads, an innovation featuring a sequential application system to isolate exfoliating acids from its patented clinical retinol.
  • In November, 2025, The European Commission enacted new restrictions under Regulation (EC) No 1223/2009, mandating maximum concentration limits of 0.3% Retinol Equivalent (RE) for facial and neck products.
  • In January, 2026, LOreal selected the first thirteen startups for its LAcceleratOR program, a sustainable innovation initiative focused on advancing green chemistry and bio-fermentation for cosmetic actives.
  • In February, 2026, The Estee Lauder Companies presented new findings at the IMCAS World Congress on the role of sirtuins and mitochondrial health in dermatological aging, signaling a shift toward longevity-focused formulations.

Dive into Technavio’s robust research methodology, blending expert interviews, extensive data synthesis, and validated models for unparalleled Retinol Skincare Product Market insights. See full methodology.

Market Scope
Page number 292
Base year 2025
Historic period 2020-2024
Forecast period 2026-2030
Growth momentum & CAGR Accelerate at a CAGR of 4.2%
Market growth 2026-2030 USD 169914.7 thousand
Market structure Fragmented
YoY growth 2025-2026(%) 4.1%
Key countries Germany, UK, France, Italy, Spain, The Netherlands, US, Canada, Mexico, China, Japan, South Korea, India, Australia, Indonesia, Brazil, Argentina, Chile, Saudi Arabia, UAE, South Africa, Turkey and Israel
Competitive landscape Leading Companies, Market Positioning of Companies, Competitive Strategies, and Industry Risks

Request Free Sample

Research Analyst Overview

  • The market is defined by a strategic pivot towards scientifically validated, low-irritation formulations. The core focus is on sophisticated time-release delivery systems like liposomal retinol and micro-encapsulated retinol, which enhance the efficacy of vitamin a derivatives while protecting skin barrier health. This allows for consistent cellular turnover and collagen biosynthesis without the common cutaneous irritation, expanding the user base.
  • We see a significant trend towards low-dose precision formulations, with demand from younger consumers for preventive care increasing by over 10%. The industry is also innovating with bio-retinols and plant-based alternatives like bakuchiol, aligning with green chemistry principles. However, the oxidative instability of synthetic retinoids remains a challenge, driving the need for advanced airless pump packaging and rigorous dermatological validation.
  • The ultimate goal is achieving visible photoaging reversal through stabilized retinol products that are both effective and tolerable.

What are the Key Data Covered in this Retinol Skincare Product Market Research and Growth Report?

  • What is the expected growth of the Retinol Skincare Product Market between 2026 and 2030?

    • USD 169.91 million, at a CAGR of 4.2%

  • What segmentation does the market report cover?

    • The report is segmented by Distribution Channel (Offline, and Online), Type (Cream, Oil, and Others), Product Type (Synthetic, and Natural) and Geography (Europe, North America, APAC, South America, Middle East and Africa)

  • Which regions are analyzed in the report?

    • Europe, North America, APAC, South America and Middle East and Africa

  • What are the key growth drivers and market challenges?

    • Regulatory compliance and industrialization of low-dose precision formulations, Critical oxidative instability and technical rigor of cold-chain supply logistics

  • Who are the major players in the Retinol Skincare Product Market?

    • Amorepacific Corp., Augustinus Bader, Beiersdorf AG, Coty Inc., Kao Corp., Kenvue Inc., Loreal SA, Mary Kay Inc., Natura and Co. Holding SA, Natura Bisse, Oriflame Cosmetics SA, Peter Thomas Roth Skin Care, Pilgrim, Procter and Gamble Co., RoC Skincare, Shiseido Co. Ltd., Sunday Riley Modern Skincare, The Body Shop International, The Estee Lauder Co. Inc. and Unilever PLC

Market Research Insights

  • Market dynamics are shaped by a pronounced shift toward clinical efficacy and enhanced consumer tolerability, moving beyond traditional corrective anti-aging narratives. The adoption of AI-driven diagnostic tools has empowered brands to offer personalized retinol serums, improving customer adherence and reducing product abandonment rates by over 25%.
  • This focus on customization supports the growing skinimalism trend and caters to the expanding male grooming sector. Demand from the pre-aging demographic for preventive skincare has surged, with some brands reporting a 10% increase in sales from younger cohorts seeking beginner-friendly retinol.
  • The industry is also pivoting to clean-label formulations and bio-retinols, aligning with the clean beauty movement and the preferences of eco-conscious consumers.

We can help! Our analysts can customize this retinol skincare product market research report to meet your requirements.

Get in touch

1. Executive Summary

1.1 Market overview

Executive Summary - Chart on Market Overview
Executive Summary - Data Table on Market Overview
Executive Summary - Chart on Global Market Characteristics
Executive Summary - Chart on Market by Geography
Executive Summary - Chart on Market Segmentation by Distribution Channel
Executive Summary - Chart on Market Segmentation by Type
Executive Summary - Chart on Market Segmentation by Product Type
Executive Summary - Chart on Incremental Growth
Executive Summary - Data Table on Incremental Growth
Executive Summary - Chart on Company Market Positioning

2. Technavio Analysis

2.1 Analysis of price sensitivity, lifecycle, customer purchase basket, adoption rates, and purchase criteria

2.2 Criticality of inputs and Factors of differentiation

Chart on Overview on criticality of inputs and factors of differentiation

2.3 Factors of disruption

Chart on Overview on factors of disruption

2.4 Impact of drivers and challenges

Chart on Impact of drivers and challenges in 2025 and 2030

3. Market Landscape

3.1 Market ecosystem

Chart on Parent Market
Data Table on - Parent Market

3.2 Market characteristics

Chart on Market characteristics analysis

3.3 Value chain analysis

Chart on Value chain analysis

4. Market Sizing

4.1 Market definition

Data Table on Offerings of companies included in the market definition

4.2 Market segment analysis

Market segments

4.3 Market size 2025

4.4 Market outlook: Forecast for 2025-2030

Chart on Global - Market size and forecast 2025-2030 ($ thousand)
Data Table on Global - Market size and forecast 2025-2030 ($ thousand)
Chart on Global Market: Year-over-year growth 2025-2030 (%)
Data Table on Global Market: Year-over-year growth 2025-2030 (%)

5. Historic Market Size

5.1 Global Retinol Skincare Product Market 2020 - 2024

Historic Market Size - Data Table on Global Retinol Skincare Product Market 2020 - 2024 ($ thousand)

5.2 Distribution Channel segment analysis 2020 - 2024

Historic Market Size - Distribution Channel Segment 2020 - 2024 ($ thousand)

5.3 Type segment analysis 2020 - 2024

Historic Market Size - Type Segment 2020 - 2024 ($ thousand)

5.4 Product Type segment analysis 2020 - 2024

Historic Market Size - Product Type Segment 2020 - 2024 ($ thousand)

5.5 Geography segment analysis 2020 - 2024

Historic Market Size - Geography Segment 2020 - 2024 ($ thousand)

5.6 Country segment analysis 2020 - 2024

Historic Market Size - Country Segment 2020 - 2024 ($ thousand)

6. Qualitative Analysis

6.1 Impact of AI in global retinol skincare product market

7. Five Forces Analysis

7.1 Five forces summary

Five forces analysis - Comparison between 2025 and 2030

7.2 Bargaining power of buyers

Bargaining power of buyers - Impact of key factors 2025 and 2030

7.3 Bargaining power of suppliers

Bargaining power of suppliers - Impact of key factors in 2025 and 2030

7.4 Threat of new entrants

Threat of new entrants - Impact of key factors in 2025 and 2030

7.5 Threat of substitutes

Threat of substitutes - Impact of key factors in 2025 and 2030

7.6 Threat of rivalry

Threat of rivalry - Impact of key factors in 2025 and 2030

7.7 Market condition

Chart on Market condition - Five forces 2025 and 2030

8. Market Segmentation by Distribution Channel

8.1 Market segments

Chart on Distribution Channel - Market share 2025-2030 (%)
Data Table on Distribution Channel - Market share 2025-2030 (%)

8.2 Comparison by Distribution Channel

Chart on Comparison by Distribution Channel
Data Table on Comparison by Distribution Channel

8.3 Offline - Market size and forecast 2025-2030

Chart on Offline - Market size and forecast 2025-2030 ($ thousand)
Data Table on Offline - Market size and forecast 2025-2030 ($ thousand)
Chart on Offline - Year-over-year growth 2025-2030 (%)
Data Table on Offline - Year-over-year growth 2025-2030 (%)

8.4 Online - Market size and forecast 2025-2030

Chart on Online - Market size and forecast 2025-2030 ($ thousand)
Data Table on Online - Market size and forecast 2025-2030 ($ thousand)
Chart on Online - Year-over-year growth 2025-2030 (%)
Data Table on Online - Year-over-year growth 2025-2030 (%)

8.5 Market opportunity by Distribution Channel

Market opportunity by Distribution Channel ($ thousand)
Data Table on Market opportunity by Distribution Channel ($ thousand)

9. Market Segmentation by Type

9.1 Market segments

Chart on Type - Market share 2025-2030 (%)
Data Table on Type - Market share 2025-2030 (%)

9.2 Comparison by Type

Chart on Comparison by Type
Data Table on Comparison by Type

9.3 Cream - Market size and forecast 2025-2030

Chart on Cream - Market size and forecast 2025-2030 ($ thousand)
Data Table on Cream - Market size and forecast 2025-2030 ($ thousand)
Chart on Cream - Year-over-year growth 2025-2030 (%)
Data Table on Cream - Year-over-year growth 2025-2030 (%)

9.4 Oil - Market size and forecast 2025-2030

Chart on Oil - Market size and forecast 2025-2030 ($ thousand)
Data Table on Oil - Market size and forecast 2025-2030 ($ thousand)
Chart on Oil - Year-over-year growth 2025-2030 (%)
Data Table on Oil - Year-over-year growth 2025-2030 (%)

9.5 Others - Market size and forecast 2025-2030

Chart on Others - Market size and forecast 2025-2030 ($ thousand)
Data Table on Others - Market size and forecast 2025-2030 ($ thousand)
Chart on Others - Year-over-year growth 2025-2030 (%)
Data Table on Others - Year-over-year growth 2025-2030 (%)

9.6 Market opportunity by Type

Market opportunity by Type ($ thousand)
Data Table on Market opportunity by Type ($ thousand)

10. Market Segmentation by Product Type

10.1 Market segments

Chart on Product Type - Market share 2025-2030 (%)
Data Table on Product Type - Market share 2025-2030 (%)

10.2 Comparison by Product Type

Chart on Comparison by Product Type
Data Table on Comparison by Product Type

10.3 Synthetic - Market size and forecast 2025-2030

Chart on Synthetic - Market size and forecast 2025-2030 ($ thousand)
Data Table on Synthetic - Market size and forecast 2025-2030 ($ thousand)
Chart on Synthetic - Year-over-year growth 2025-2030 (%)
Data Table on Synthetic - Year-over-year growth 2025-2030 (%)

10.4 Natural - Market size and forecast 2025-2030

Chart on Natural - Market size and forecast 2025-2030 ($ thousand)
Data Table on Natural - Market size and forecast 2025-2030 ($ thousand)
Chart on Natural - Year-over-year growth 2025-2030 (%)
Data Table on Natural - Year-over-year growth 2025-2030 (%)

10.5 Market opportunity by Product Type

Market opportunity by Product Type ($ thousand)
Data Table on Market opportunity by Product Type ($ thousand)

11. Customer Landscape

11.1 Customer landscape overview

Analysis of price sensitivity, lifecycle, customer purchase basket, adoption rates, and purchase criteria

12. Geographic Landscape

12.1 Geographic segmentation

Chart on Market share by geography 2025-2030 (%)
Data Table on Market share by geography 2025-2030 (%)

12.2 Geographic comparison

Chart on Geographic comparison
Data Table on Geographic comparison

12.3 Europe - Market size and forecast 2025-2030

Chart on Europe - Market size and forecast 2025-2030 ($ thousand)
Data Table on Europe - Market size and forecast 2025-2030 ($ thousand)
Chart on Europe - Year-over-year growth 2025-2030 (%)
Data Table on Europe - Year-over-year growth 2025-2030 (%)
Chart on Regional Comparison - Europe
Data Table on Regional Comparison - Europe

12.3.1 Germany - Market size and forecast 2025-2030

Chart on Germany - Market size and forecast 2025-2030 ($ thousand)
Data Table on Germany - Market size and forecast 2025-2030 ($ thousand)
Chart on Germany - Year-over-year growth 2025-2030 (%)
Data Table on Germany - Year-over-year growth 2025-2030 (%)

12.3.2 UK - Market size and forecast 2025-2030

Chart on UK - Market size and forecast 2025-2030 ($ thousand)
Data Table on UK - Market size and forecast 2025-2030 ($ thousand)
Chart on UK - Year-over-year growth 2025-2030 (%)
Data Table on UK - Year-over-year growth 2025-2030 (%)

12.3.3 France - Market size and forecast 2025-2030

Chart on France - Market size and forecast 2025-2030 ($ thousand)
Data Table on France - Market size and forecast 2025-2030 ($ thousand)
Chart on France - Year-over-year growth 2025-2030 (%)
Data Table on France - Year-over-year growth 2025-2030 (%)

12.3.4 Italy - Market size and forecast 2025-2030

Chart on Italy - Market size and forecast 2025-2030 ($ thousand)
Data Table on Italy - Market size and forecast 2025-2030 ($ thousand)
Chart on Italy - Year-over-year growth 2025-2030 (%)
Data Table on Italy - Year-over-year growth 2025-2030 (%)

12.3.5 Spain - Market size and forecast 2025-2030

Chart on Spain - Market size and forecast 2025-2030 ($ thousand)
Data Table on Spain - Market size and forecast 2025-2030 ($ thousand)
Chart on Spain - Year-over-year growth 2025-2030 (%)
Data Table on Spain - Year-over-year growth 2025-2030 (%)

12.3.6 The Netherlands - Market size and forecast 2025-2030

Chart on The Netherlands - Market size and forecast 2025-2030 ($ thousand)
Data Table on The Netherlands - Market size and forecast 2025-2030 ($ thousand)
Chart on The Netherlands - Year-over-year growth 2025-2030 (%)
Data Table on The Netherlands - Year-over-year growth 2025-2030 (%)

12.4 North America - Market size and forecast 2025-2030

Chart on North America - Market size and forecast 2025-2030 ($ thousand)
Data Table on North America - Market size and forecast 2025-2030 ($ thousand)
Chart on North America - Year-over-year growth 2025-2030 (%)
Data Table on North America - Year-over-year growth 2025-2030 (%)
Chart on Regional Comparison - North America
Data Table on Regional Comparison - North America

12.4.1 US - Market size and forecast 2025-2030

Chart on US - Market size and forecast 2025-2030 ($ thousand)
Data Table on US - Market size and forecast 2025-2030 ($ thousand)
Chart on US - Year-over-year growth 2025-2030 (%)
Data Table on US - Year-over-year growth 2025-2030 (%)

12.4.2 Canada - Market size and forecast 2025-2030

Chart on Canada - Market size and forecast 2025-2030 ($ thousand)
Data Table on Canada - Market size and forecast 2025-2030 ($ thousand)
Chart on Canada - Year-over-year growth 2025-2030 (%)
Data Table on Canada - Year-over-year growth 2025-2030 (%)

12.4.3 Mexico - Market size and forecast 2025-2030

Chart on Mexico - Market size and forecast 2025-2030 ($ thousand)
Data Table on Mexico - Market size and forecast 2025-2030 ($ thousand)
Chart on Mexico - Year-over-year growth 2025-2030 (%)
Data Table on Mexico - Year-over-year growth 2025-2030 (%)

12.5 APAC - Market size and forecast 2025-2030

Chart on APAC - Market size and forecast 2025-2030 ($ thousand)
Data Table on APAC - Market size and forecast 2025-2030 ($ thousand)
Chart on APAC - Year-over-year growth 2025-2030 (%)
Data Table on APAC - Year-over-year growth 2025-2030 (%)
Chart on Regional Comparison - APAC
Data Table on Regional Comparison - APAC

12.5.1 China - Market size and forecast 2025-2030

Chart on China - Market size and forecast 2025-2030 ($ thousand)
Data Table on China - Market size and forecast 2025-2030 ($ thousand)
Chart on China - Year-over-year growth 2025-2030 (%)
Data Table on China - Year-over-year growth 2025-2030 (%)

12.5.2 Japan - Market size and forecast 2025-2030

Chart on Japan - Market size and forecast 2025-2030 ($ thousand)
Data Table on Japan - Market size and forecast 2025-2030 ($ thousand)
Chart on Japan - Year-over-year growth 2025-2030 (%)
Data Table on Japan - Year-over-year growth 2025-2030 (%)

12.5.3 South Korea - Market size and forecast 2025-2030

Chart on South Korea - Market size and forecast 2025-2030 ($ thousand)
Data Table on South Korea - Market size and forecast 2025-2030 ($ thousand)
Chart on South Korea - Year-over-year growth 2025-2030 (%)
Data Table on South Korea - Year-over-year growth 2025-2030 (%)

12.5.4 India - Market size and forecast 2025-2030

Chart on India - Market size and forecast 2025-2030 ($ thousand)
Data Table on India - Market size and forecast 2025-2030 ($ thousand)
Chart on India - Year-over-year growth 2025-2030 (%)
Data Table on India - Year-over-year growth 2025-2030 (%)

12.5.5 Australia - Market size and forecast 2025-2030

Chart on Australia - Market size and forecast 2025-2030 ($ thousand)
Data Table on Australia - Market size and forecast 2025-2030 ($ thousand)
Chart on Australia - Year-over-year growth 2025-2030 (%)
Data Table on Australia - Year-over-year growth 2025-2030 (%)

12.5.6 Indonesia - Market size and forecast 2025-2030

Chart on Indonesia - Market size and forecast 2025-2030 ($ thousand)
Data Table on Indonesia - Market size and forecast 2025-2030 ($ thousand)
Chart on Indonesia - Year-over-year growth 2025-2030 (%)
Data Table on Indonesia - Year-over-year growth 2025-2030 (%)

12.6 South America - Market size and forecast 2025-2030

Chart on South America - Market size and forecast 2025-2030 ($ thousand)
Data Table on South America - Market size and forecast 2025-2030 ($ thousand)
Chart on South America - Year-over-year growth 2025-2030 (%)
Data Table on South America - Year-over-year growth 2025-2030 (%)
Chart on Regional Comparison - South America
Data Table on Regional Comparison - South America

12.6.1 Brazil - Market size and forecast 2025-2030

Chart on Brazil - Market size and forecast 2025-2030 ($ thousand)
Data Table on Brazil - Market size and forecast 2025-2030 ($ thousand)
Chart on Brazil - Year-over-year growth 2025-2030 (%)
Data Table on Brazil - Year-over-year growth 2025-2030 (%)

12.6.2 Argentina - Market size and forecast 2025-2030

Chart on Argentina - Market size and forecast 2025-2030 ($ thousand)
Data Table on Argentina - Market size and forecast 2025-2030 ($ thousand)
Chart on Argentina - Year-over-year growth 2025-2030 (%)
Data Table on Argentina - Year-over-year growth 2025-2030 (%)

12.6.3 Chile - Market size and forecast 2025-2030

Chart on Chile - Market size and forecast 2025-2030 ($ thousand)
Data Table on Chile - Market size and forecast 2025-2030 ($ thousand)
Chart on Chile - Year-over-year growth 2025-2030 (%)
Data Table on Chile - Year-over-year growth 2025-2030 (%)

12.7 Middle East and Africa - Market size and forecast 2025-2030

Chart on Middle East and Africa - Market size and forecast 2025-2030 ($ thousand)
Data Table on Middle East and Africa - Market size and forecast 2025-2030 ($ thousand)
Chart on Middle East and Africa - Year-over-year growth 2025-2030 (%)
Data Table on Middle East and Africa - Year-over-year growth 2025-2030 (%)
Chart on Regional Comparison - Middle East and Africa
Data Table on Regional Comparison - Middle East and Africa

12.7.1 Saudi Arabia - Market size and forecast 2025-2030

Chart on Saudi Arabia - Market size and forecast 2025-2030 ($ thousand)
Data Table on Saudi Arabia - Market size and forecast 2025-2030 ($ thousand)
Chart on Saudi Arabia - Year-over-year growth 2025-2030 (%)
Data Table on Saudi Arabia - Year-over-year growth 2025-2030 (%)

12.7.2 UAE - Market size and forecast 2025-2030

Chart on UAE - Market size and forecast 2025-2030 ($ thousand)
Data Table on UAE - Market size and forecast 2025-2030 ($ thousand)
Chart on UAE - Year-over-year growth 2025-2030 (%)
Data Table on UAE - Year-over-year growth 2025-2030 (%)

12.7.3 South Africa - Market size and forecast 2025-2030

Chart on South Africa - Market size and forecast 2025-2030 ($ thousand)
Data Table on South Africa - Market size and forecast 2025-2030 ($ thousand)
Chart on South Africa - Year-over-year growth 2025-2030 (%)
Data Table on South Africa - Year-over-year growth 2025-2030 (%)

12.7.4 Turkey - Market size and forecast 2025-2030

Chart on Turkey - Market size and forecast 2025-2030 ($ thousand)
Data Table on Turkey - Market size and forecast 2025-2030 ($ thousand)
Chart on Turkey - Year-over-year growth 2025-2030 (%)
Data Table on Turkey - Year-over-year growth 2025-2030 (%)

12.7.5 Israel - Market size and forecast 2025-2030

Chart on Israel - Market size and forecast 2025-2030 ($ thousand)
Data Table on Israel - Market size and forecast 2025-2030 ($ thousand)
Chart on Israel - Year-over-year growth 2025-2030 (%)
Data Table on Israel - Year-over-year growth 2025-2030 (%)

12.8 Market opportunity by geography

Market opportunity by geography ($ thousand)
Data Tables on Market opportunity by geography ($ thousand)

13. Drivers, Challenges, and Opportunity

13.1 Market drivers

Regulatory compliance and industrialization of low-dose precision formulations
Encapsulation technologies and rise of time-release delivery systems
Preventive skincare and strategic expansion of pre-aging demographic

13.2 Market challenges

Critical oxidative instability and technical rigor of cold-chain supply logistics
Intensifying vertical competition between medical-grade and consumer-grade segments
Conflict between molecular protection and sustainable packaging mandates

13.3 Impact of drivers and challenges

Impact of drivers and challenges in 2025 and 2030

13.4 Market opportunities

Rise of bio-retinols and sustainable phyto-alternatives
Integration of precision diagnostics and hyper-personalized retinol protocols
Expansion of longevity-focused low-aging and preventive retinoid

14. Competitive Landscape

14.1 Overview

14.2

Overview on criticality of inputs and factors of differentiation

14.3 Landscape disruption

Overview on factors of disruption

14.4 Industry risks

Impact of key risks on business

15. Competitive Analysis

15.1 Companies profiled

Companies covered

15.2 Company ranking index

15.3 Market positioning of companies

Matrix on companies position and classification

15.4 Amorepacific Corp.

Amorepacific Corp. - Overview
Amorepacific Corp. - Business segments
Amorepacific Corp. - Key news
Amorepacific Corp. - Key offerings
Amorepacific Corp. - Segment focus
SWOT

15.5 Beiersdorf AG

Beiersdorf AG - Overview
Beiersdorf AG - Business segments
Beiersdorf AG - Key news
Beiersdorf AG - Key offerings
Beiersdorf AG - Segment focus
SWOT

15.6 Coty Inc.

Coty Inc. - Overview
Coty Inc. - Business segments
Coty Inc. - Key news
Coty Inc. - Key offerings
Coty Inc. - Segment focus
SWOT

15.7 Kao Corp.

Kao Corp. - Overview
Kao Corp. - Business segments
Kao Corp. - Key news
Kao Corp. - Key offerings
Kao Corp. - Segment focus
SWOT

15.8 Kenvue Inc.

Kenvue Inc. - Overview
Kenvue Inc. - Business segments
Kenvue Inc. - Key news
Kenvue Inc. - Key offerings
Kenvue Inc. - Segment focus
SWOT

15.9 Loreal SA

Loreal SA - Overview
Loreal SA - Business segments
Loreal SA - Key news
Loreal SA - Key offerings
Loreal SA - Segment focus
SWOT

15.10 Natura and Co. Holding SA

Natura and Co. Holding SA - Overview
Natura and Co. Holding SA - Business segments
Natura and Co. Holding SA - Key offerings
Natura and Co. Holding SA - Segment focus
SWOT

15.11 Natura Bisse

Natura Bisse - Overview
Natura Bisse - Product / Service
Natura Bisse - Key offerings
SWOT

15.12 Oriflame Cosmetics SA

Oriflame Cosmetics SA - Overview
Oriflame Cosmetics SA - Product / Service
Oriflame Cosmetics SA - Key offerings
SWOT

15.13 Peter Thomas Roth Skin Care

Peter Thomas Roth Skin Care - Overview
Peter Thomas Roth Skin Care - Product / Service
Peter Thomas Roth Skin Care - Key offerings
SWOT

15.14 Pilgrim

Pilgrim - Overview
Pilgrim - Product / Service
Pilgrim - Key offerings
SWOT

15.15 Procter and Gamble Co.

Procter and Gamble Co. - Overview
Procter and Gamble Co. - Business segments
Procter and Gamble Co. - Key offerings
Procter and Gamble Co. - Segment focus
SWOT

15.16 Shiseido Co. Ltd.

Shiseido Co. Ltd. - Overview
Shiseido Co. Ltd. - Business segments
Shiseido Co. Ltd. - Key offerings
Shiseido Co. Ltd. - Segment focus
SWOT

15.17 The Estee Lauder Co. Inc.

The Estee Lauder Co. Inc. - Overview
The Estee Lauder Co. Inc. - Business segments
The Estee Lauder Co. Inc. - Key news
The Estee Lauder Co. Inc. - Key offerings
The Estee Lauder Co. Inc. - Segment focus
SWOT

15.18 Unilever PLC

Unilever PLC - Overview
Unilever PLC - Business segments
Unilever PLC - Key offerings
Unilever PLC - Segment focus
SWOT

16. Appendix

16.1 Scope of the report

Market definition
Objectives
Notes and caveats

16.2 Inclusions and exclusions checklist

Inclusions checklist
Exclusions checklist

16.3 Currency conversion rates for US$

16.4 Research methodology

16.5 Data procurement

Information sources

16.6 Data validation

16.7 Validation techniques employed for market sizing

16.8 Data synthesis

16.9 360 degree market analysis

16.10 List of abbreviations

Research Methodology

Technavio presents a detailed picture of the market by way of study, synthesis, and summation of data from multiple sources. The analysts have presented the various facets of the market with a particular focus on identifying the key industry influencers. The data thus presented is comprehensive, reliable, and the result of extensive research, both primary and secondary.

INFORMATION SOURCES

Primary sources

  • Manufacturers and suppliers
  • Channel partners
  • Industry experts
  • Strategic decision makers

Secondary sources

  • Industry journals and periodicals
  • Government data
  • Financial reports of key industry players
  • Historical data
  • Press releases

DATA ANALYSIS

Data Synthesis

  • Collation of data
  • Estimation of key figures
  • Analysis of derived insights

Data Validation

  • Triangulation with data models
  • Reference against proprietary databases
  • Corroboration with industry experts

REPORT WRITING

Qualitative

  • Market drivers
  • Market challenges
  • Market trends
  • Five forces analysis

Quantitative

  • Market size and forecast
  • Market segmentation
  • Geographical insights
  • Competitive landscape

Interested in this report?

Get your sample now to see our research methodology and insights!

Download Now

Frequently Asked Questions

Retinol Skincare Product market growth will increase by USD 169914.7 thousand thousand during 2026-2030.

The Retinol Skincare Product market is expected to grow at a CAGR of 4.2% during 2026-2030.

Retinol Skincare Product market is segmented by Distribution channel (Offline, Online) Type (Cream, Oil, Others) Product type (Synthetic, Natural)

Amorepacific Corp., Augustinus Bader, Beiersdorf AG, Coty Inc., Kao Corp., Kenvue Inc., Loreal SA, Mary Kay Inc., Natura and Co. Holding SA, Natura Bisse, Oriflame Cosmetics SA, Peter Thomas Roth Skin Care, Pilgrim, Procter and Gamble Co., RoC Skincare, Shiseido Co. Ltd., Sunday Riley Modern Skincare, The Body Shop International, The Estee Lauder Co. Inc., Unilever PLC are a few of the key vendors in the Retinol Skincare Product market.

Europe will register the highest growth rate of 32.9% among the other regions. Therefore, the Retinol Skincare Product market in Europe is expected to garner significant business opportunities for the vendors during the forecast period.

Germany, UK, France, Italy, Spain, The Netherlands, US, Canada, Mexico, China, Japan, South Korea, India, Australia, Indonesia, Brazil, Argentina, Chile, Saudi Arabia, UAE, South Africa, Turkey, Israel

  • Regulatory compliance and industrialization of low-dose precision formulations is the driving factor this market.

The Retinol Skincare Product market vendors should focus on grabbing business opportunities from the Distribution channel segment as it accounted for the largest market share in the base year.
RIA - Research AI Assistant
Ask RIA