Rice Market Analysis APAC,Europe,North America,South America,Middle East and Africa - US,China,India,Japan,UK - Size and Forecast 2023-2027

Rice Market Analysis APAC,Europe,North America,South America,Middle East and Africa - US,China,India,Japan,UK - Size and Forecast 2023-2027

Published: Dec 2022 157 Pages SKU: IRTNTR74831

Market Overview at a Glance

$85.65 mn t
Market Opportunity
3.6%
CAGR
3.87
YoY growth 2022-2023(%)

Rice Market Size 2023-2027

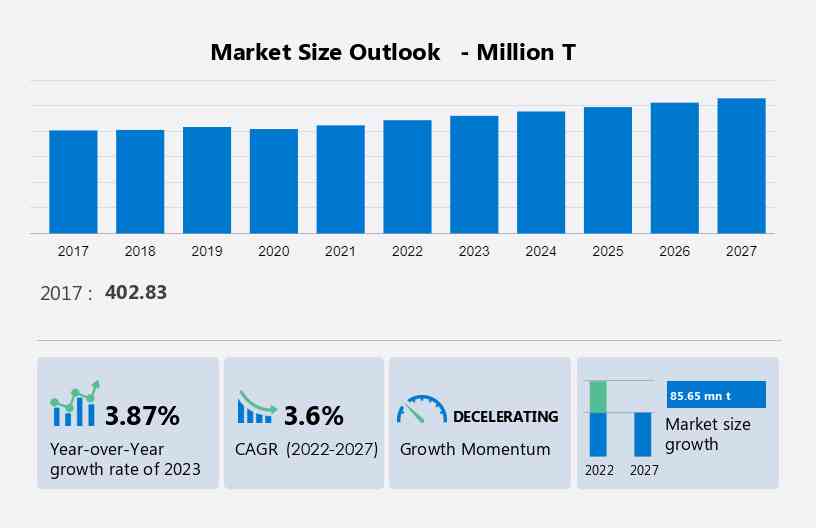
The rice market size is projected to increase by 85.65 million T, at a CAGR of 3.6% between 2022 and 2027.

  • Market growth in the rice industry is driven by several key factors. Firstly, increased consumption of rice as a staple food globally is a significant factor. Secondly, the diverse range of rice varieties available from producers caters to various consumer preferences and market demands. Thirdly, rising demand for rice flour from emerging markets, particularly in the food processing and cosmetics industries, is another crucial factor. These elements collectively fuel market growth, emphasizing rice's importance as a vital food source.
  • As consumption patterns evolve and dietary trends shift, producers are expected to continue innovating to meet diverse consumer preferences. Brown rice, in particular, is gaining popularity due to its health benefits and environmental sustainability. Producers must adapt to changing market dynamics to ensure continued growth and sustainability in the rice industry. This trend underscores the significance of brown rice as a crucial food source and the need for producers to stay competitive and responsive to market demands.

What will be the Size of the Rice Market During the Forecast Period?

Rice Market Size

To get additional information about the rice market report, Request Free Sample

How is the Rice Market Segmented?

The rice market research report provides comprehensive data (region wise segment analysis), with forecasts and estimates in "Million ton" for the period 2023 to 2027, as well as historical data from 2017 to 2021 for the following segments

  • Product Outlook 
    • Long grain
    • Medium grain
    • Short grain
  • Distribution Channel Outlook 
    • Offline
    • Online
  • Region Outlook
    • North America
      • The U.S.
      • Canada
    • Europe
      • The U.K.
      • Germany
      • France
      • Rest of Europe
    • APAC
      • China
      • India
    • Middle East & Africa
      • Saudi Arabia
      • South Africa
      • Rest of the Middle East & Africa
    • South America
      • Chile
      • Brazil
      • Argentina

By Product

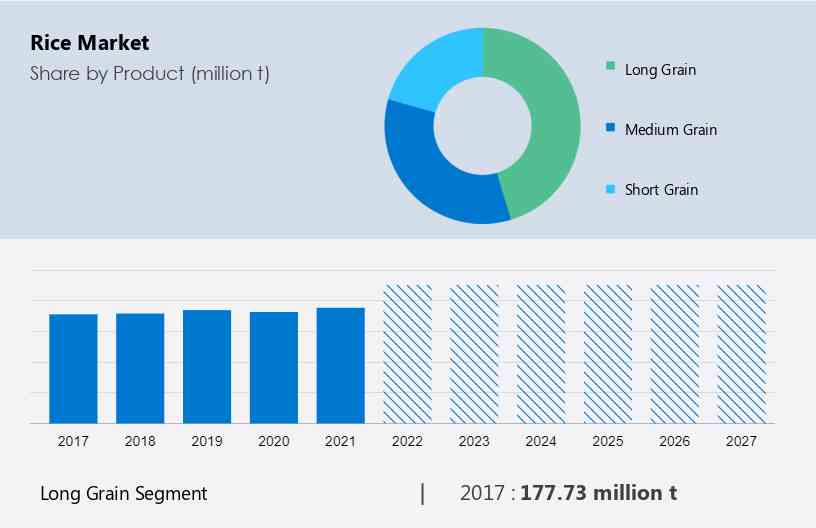
  • The market share growth by the long-grain segment will be significant during the forecast period. Long-grain rice is slim and lengthy, having a length that is three to five times its width. This segment has a range of rice varieties such as basmati and jasmine.

Rice Market Size

For a detailed summary of the market segments, Get Sample Report

  • The long-grain segment was valued at 177.73 million T in 2017. Long-grain rice is widely produced and consumed across Asian countries. These countries are some of the largest consumers of rice in the world. Thus, the popularity of long-grain rice in leading rice-consuming countries in the world is driving the growth of the long-grain segment of the global market. Furthermore, long-grain rice is believed to be healthier than other rice varieties.
  • For instance, basmati rice is low in carbohydrates and cholesterol, making it suitable for consumption by people with chronic disorders such as diabetes, cardiac diseases, and obesity. Such health benefits of long-grain rice increase its popularity among consumers, which, in turn, will drive rice market growth during the forecast period.

By Distribution Channel

  • The offline distribution channel segment generates revenue from the sales of products through hypermarkets, supermarkets, department stores, and independent retailers. Retailers are introducing new business and retail strategies, for example, better pricing strategies and wider assortments, owing to the declining preference for offline shopping and the need to survive in a competitive market. As a part of the marketing and offline sales strategy, resellers place attractive displays that generate strong sales. companies push their offline sales by widening their store operations across locations.
  • Companies can increase sales and cater to each consumer category through expansions in large geographies. With the growth in retail channels in cities and regions, customers have access to different varieties of rice, such as brown rice, basmati rice, and jasmine rice. This is expected to increase the sales of rice through offline channels during the forecast period. 

By Region

Rice Market Share by Geography

Get a glance at the market share of various regions. View PDF Sample

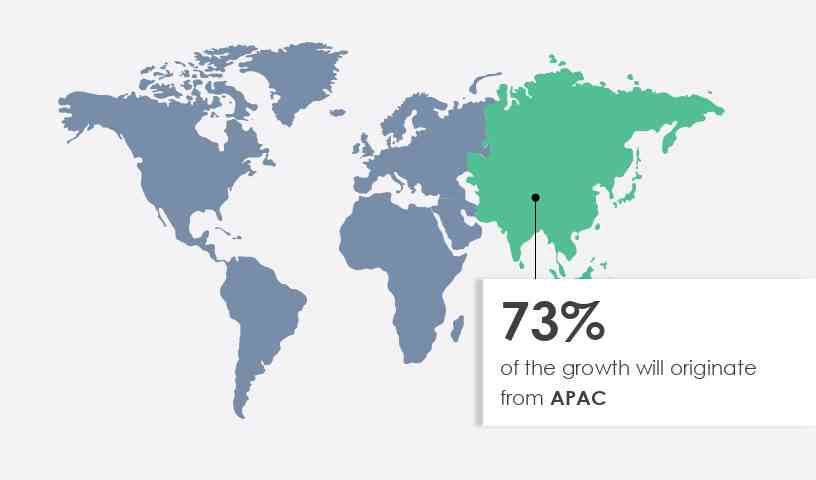
  • APAC is estimated to contribute 73% to the growth of the global market during the forecast period. Technavio's analysts have elaborately explained the regional trends and drivers that shape the market during the forecast period. APAC is the biggest producer and consumer of rice in the world. The region consumes about two-thirds of the total rice produced globally. Thus, rice is available in plenty across the region. Countries including China, Thailand, and India use rice in the preparation of a wide range of daily-use food items such as rice wine. This keeps the demand for rice high in the region.
  • Growing urbanization and economic growth over the years have influenced the lifestyle of people living in APAC and changed their consumption habits, tastes, and preferences, thereby driving the demand for convenience and ready-to-eat foods in the region. In recent years, the demand for wheat in APAC has increased marginally, but growing awareness about health is expected to witness a growth in the use of rice. People in APAC are, therefore, expected to move to healthier, rice-based gluten-free diets amid growing consciousness about the ill effects of gluten.  Such consumer patterns in APAC are expected to drive regional rice market growth during the forecast period.

What are the Rice Market Dynamics Shaping Growth?

  • The rice market plays a vital role in the fast food sector market as a staple cereal grain. Cultivated during the Kharif season, it offers a range of varieties including white rice, wild rice, and specialty rice. Rich in fibre and salt, rice is also available in organic and whole grain forms, catering to health-conscious consumers. However, challenges like soil degradation and biodiversity loss impact rice cultivation. The market is evolving with the rise of online distribution channels, facilitating easier access for consumers. Additionally, rice is often cultivated alongside sugarcane, contributing significantly to the agricultural commodity sector.
  • Rice is a staple food for over half of the world's population, with significant consumption in Asian, African, and Latin American countries. The primary reasons for this trend are the growing population and increasing per capita income. According to the World Bank and United Nations, countries such as Syria (4.4%), Niger (3.8%), and Angola (3.2%) experienced the highest population growth rates in 2021. Meanwhile, Asian economies, including Macao (20.4%), Hong Kong (6.4%), and Singapore (6.0%), recorded the highest per capita GDP growth rates in the same year.
  • Consequently, the expanding population and rising income levels in developing economies are expected to fuel rice consumption and market growth during the forecast period. Our research team examined the data, taking 2022 as the base year, and identified key trends and challenges to provide a comprehensive analysis. This in-depth analysis of drivers, trends, and challenges will enable stakeholders in the rice value chain to refine their marketing strategies and secure a competitive advantage.

Major Market Trends 

  • Increasing awareness about gluten-free food is a major trend driving rice market growth. The rising awareness about gluten and celiac disease among consumers has increased the demand for non-gluten or gluten-free food. Gluten is found in grains such as wheat, rye, and barley. However, rice is gluten-free and has witnessed a rise in demand among consumers. This can positively impact the growth of the global market during the forecast period.
  • The consumption of gluten can cause problems among individuals with a gluten intolerance. If left undiagnosed, it can lead to celiac disease, a severe form of gluten intolerance. Nearly 1% of the population in the UK has celiac disease, out of which only around 24% is diagnosed. It is estimated that nearly three million people in the US have celiac disease. The disease causes bloating of the small intestine, headache, constipation, diarrhea, and weight loss.
  • Gluten sensitivity also leads to digestive issues, inflammation in the small intestine, and attention deficit hyperactivity disorder (ADHD). Currently, there is no cure for this disease, and the only way to avoid it is to switch to a gluten-free diet. As a result, customers are avoiding foods that have gluten or gluten-containing ingredients. Thus, the increasing preference for gluten-free food products is expected to drive rice market growth during the forecast period.

Significant Market Challenge

  • The price volatility of grains due to weather conditions is a major factor hindering rice market growth. Fluctuations in the availability of rice can impede the growth of the market. Lower rice harvests trigger an increase in the price of rice due to increasing demand. This can also cause a decline in the demand for rice and reduce the customer base. The dependency of companies on climate increases volatility both in the price and quality of rice, causing a demand-supply imbalance for major rice-consuming countries. Climate change and unfavorable weather conditions can affect the volume and quality of crop yield.
  • Globally, climatic conditions are changing rapidly, giving rise to severe droughts and floods. Short supplies lead to higher rice prices, which increases the price for the end customer. Such factors will affect the sales in the rice market during the forecast period.

Customer Landscape

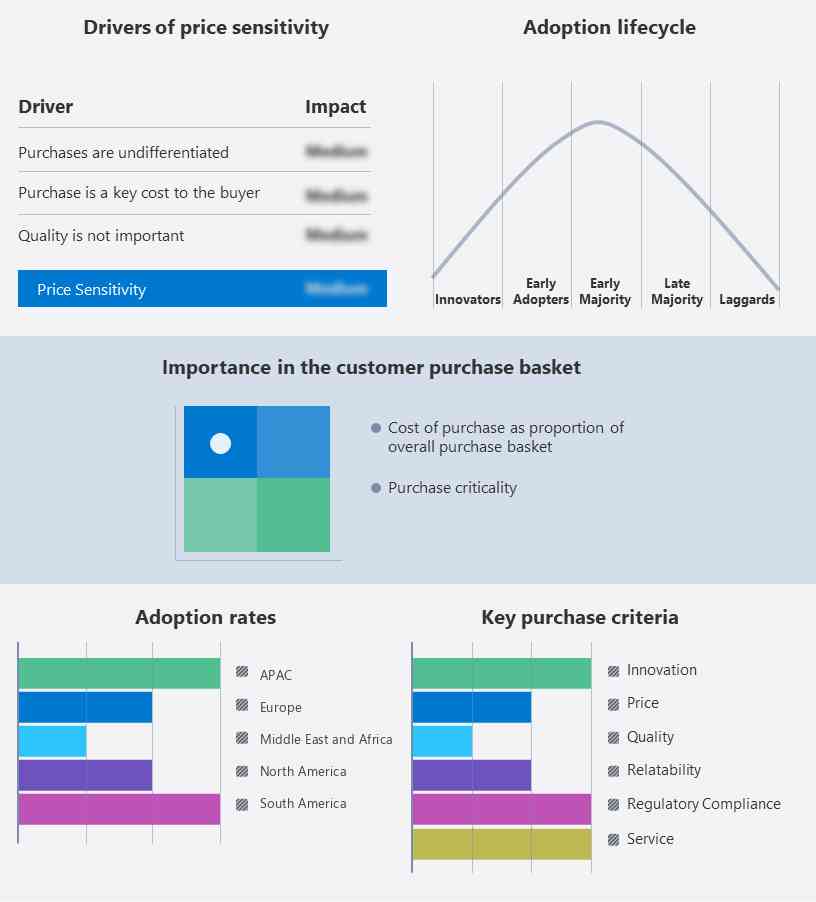
The rice market research report includes the adoption lifecycle of the market, covering from the innovator's stage to the laggard's stage. It focuses on adoption rates in different regions based on penetration. Furthermore, the rice market forecasting report also includes key purchase criteria and drivers of price sensitivity to help companies evaluate and develop their growth strategies.

Rice Market Share by Geography

Global Market Customer Landscape

Which are the Major Rice Market Companies?

Companies are implementing various strategies, such as strategic alliances, partnerships, mergers and acquisitions, geographical expansion, and product/service launches, to enhance their presence in the market.

  • ITC Ltd.- The company offers rice such as long grain parboiled rice and brown rice.
  • Adani Wilmar Ltd.- The company offers rice such as Fortune biryani special basmati rice.
  • Bunge Ltd.- The company offers rice such as long grain rough rice, medium grain rough rice and long grain brown rice.

The rice market research and growth report also includes detailed analyses of the competitive landscape of the market and information about 15 market companies, including:

  • Aashirvad International
  • Amir Chand Jagdish Kumar Exports Ltd.
  • Anheuser Busch InBev SA NV
  • California Family Foods
  • Cargill Inc.
  • Ebro Foods SA
  • Farmers Rice Cooperative
  • Gautam General Trading LLC
  • GRM Overseas Ltd.
  • Kohinoor Foods Ltd.
  • KRBL Ltd.
  • Louis Dreyfus Co. BV
  • LT Foods Ltd.
  • Riceland Foods Inc.
  • Shriram Food Industry Pvt. Ltd.
  • Sri Sai Nath Agri Industries Pvt. Ltd.
  • Tamaki Rice Corp.

Qualitative and quantitative analysis of companies has been conducted to help clients understand the wider business environment as well as the strengths and weaknesses of key market players. Data is qualitatively analyzed to categorize companies as pure play, category-focused, industry-focused, and diversified; it is quantitatively analyzed to categorize companies as dominant, leading, strong, tentative, and weak.

What are the Latest Market Developments and News?

  • In November 2024, India's largest rice exporter, KRBL Limited, launched a new organic rice product line aimed at the growing demand for healthier and eco-friendly food options. The company's move seeks to expand its market share in the global rice export sector, especially in Western markets that prioritize organic food.

  • In October 2024, Olam Group introduced an innovative rice packaging solution that uses biodegradable materials, aiming to reduce plastic waste in the packaging of rice products. This move comes as part of the company's broader sustainability initiative to appeal to environmentally conscious consumers.

  • In September 2024, Thailand's largest rice exporter, Thai Rice Exporters Association, partnered with a global e-commerce platform to increase direct-to-consumer sales of premium Thai rice. This collaboration aims to tap into the growing demand for high-quality rice in international markets through online channels.

  • In August 2024, the U.S. Department of Agriculture (USDA) announced a new initiative to support domestic rice farmers by introducing advanced irrigation technologies. The initiative aims to improve crop yields and water efficiency, helping to strengthen the U.S. rice market and meet rising domestic and international demand.

Will Consumer Demand Drive Market Growth?

  • The rice market is a complex and intricate sector, encompassing a diverse range of products to cater to various food patterns and dietary habits. This includes specialty rice varieties, such as aromatic and long grain rice. External factors significantly influence this market, with monsoons impacting seasonal crops and rice cultivation. Pests and diseases pose challenges to rice production, necessitating the use of efficient rice mill machinery and effective land and labor management. In recent years, there has been a growing emphasis on health and wellness, leading consumers to seek out organic rice and whole grain rice. These options are rich in essential vitamins, minerals, and fiber. This trend intersects with various sectors, including the food and restaurant industry and the food and agriculture sectors, providing essential nutrients to consumers.
  • Monsoons and other external factors can disrupt rice production, making efficient and effective management practices crucial for maintaining a stable rice supply. Organic and whole grain rice cater to the increasing demand for healthier food options, highlighting the importance of sustainable farming practices and innovative rice milling technologies.
  • The shift towards online distribution channels has complemented traditional offline stores, offering consumers convenient access to a staple food source despite seasonal challenges. Producers of maize are also turning to online distribution channels to expand their market reach and streamline their sales process. Despite the challenges posed by seasonal rains and other external factors, the rice market remains a vital sector, intersecting with various industries and providing essential nutrients to consumers. Utilizing online distribution channels and platforms, consumers can access rice consistently, ensuring a steady supply of this staple food. The market's resilience and adaptability in the face of external challenges make it a dynamic and exciting sector to watch.

Market Scope

Report Coverage

Details

Page number

157

Base year

2022

Historic period

2017-2021

Forecast period

2023-2027

Growth momentum & CAGR

Decelerate at a CAGR of 3.6%

Market growth 2023-2027

85.65 mn t

Market structure

USD Fragmented

YoY growth 2022-2023(%)

3.87

Regional analysis

APAC, Europe, North America, South America, and Middle East and Africa

Performing market contribution

APAC at 73%

Key countries

US, China, India, Japan, and UK

Competitive landscape

Leading companies, Market Positioning of companies, Competitive Strategies, and Industry Risks

Key companies profiled

Aashirvad International, Adani Wilmar Ltd., Amir Chand Jagdish Kumar Exports Ltd., Anheuser Busch InBev SA NV, Bunge Ltd., California Family Foods, Cargill Inc., Ebro Foods SA, Farmers Rice Cooperative, Gautam General Trading LLC, GRM Overseas Ltd., ITC Ltd., Kohinoor Foods Ltd., KRBL Ltd., Louis Dreyfus Co. BV, LT Foods Ltd., Riceland Foods Inc., Shriram Food Industry Pvt. Ltd., Sri Sai Nath Agri Industries Pvt. Ltd., and Tamaki Rice Corp.

Market dynamics

Parent market analysis, Market Forecasting, Market growth inducers and obstacles, Fast-growing and slow-growing segment analysis, COVID-19 impact and recovery analysis and future consumer dynamics, Market condition analysis for the market forecast period

Customization purview

If our rice market forecast report has not included the data that you are looking for, you can reach out to our analysts and get segments customized.

Buy Full Report and Discover more

What are the Key Data Covered in this Rice Market Research Report?

  • CAGR of the market during the forecast period
  • Detailed information on factors that will drive the market growth and forecasting of the market between 2023 and 2027
  • Precise estimation of the size of the market size and its contribution to the parent market
  • Accurate predictions about upcoming market trends and analysis and changes in consumer behavior
  • Growth of the market industry across Europe, North America, APAC, South America, and Middle East and Africa
  • Thorough market growth analysis of the market's competitive landscape and detailed information about companies
  • Comprehensive market analysis and report on the factors that will challenge the market research and growth of market companies

We can help! Our analysts can customize this rice market growth analysis report to meet your requirements. Get in touch

1 Executive Summary

  • 1.1 Market overview
    • Exhibit 01: Executive Summary – Chart on Market Overview
    • Exhibit 02: Executive Summary – Data Table on Market Overview
    • Exhibit 03: Executive Summary – Chart on Global Market Characteristics
    • Exhibit 04: Executive Summary – Chart on Market by Geography
    • Exhibit 05: Executive Summary – Chart on Market Segmentation by Product
    • Exhibit 06: Executive Summary – Chart on Market Segmentation by Distribution Channel
    • Exhibit 07: Executive Summary – Chart on Incremental Growth
    • Exhibit 08: Executive Summary – Data Table on Incremental Growth
    • Exhibit 09: Executive Summary – Chart on Vendor Market Positioning

2 Market Landscape

  • 2.1 Market ecosystem
    • Exhibit 10: Parent market
    • Exhibit 11: Market Characteristics

3 Market Sizing

  • 3.1 Market definition
    • Exhibit 12: Offerings of vendors included in the market definition
  • 3.2 Market segment analysis
    • Exhibit 13: Market segments
  • 3.3 Market size 2022
    • 3.4 Market outlook: Forecast for 2022-2027
      • Exhibit 14: Chart on Global - Market size and forecast 2022-2027 (million t)
      • Exhibit 15: Data Table on Global - Market size and forecast 2022-2027 (million t)
      • Exhibit 16: Chart on Global Market- Year-over-year growth 2022-2027 (%)
      • Exhibit 17: Data Table on Global Market- Year-over-year growth 2022-2027 (%)

    4 Historic Market Size

    • 4.1 Global rice market 2017 - 2021
      • Exhibit 18: Historic Market Size – Data Table on Global rice market 2017 - 2021 (million t)
    • 4.2 Product Segment Analysis 2017 - 2021
      • Exhibit 19: Historic Market Size – Product Segment 2017 - 2021 (million t)
    • 4.3 Distribution channel Segment Analysis 2017 - 2021
      • Exhibit 20: Historic Market Size – Distribution channel Segment 2017 - 2021 (million t)
    • 4.4 Geography Segment Analysis 2017 - 2021
      • Exhibit 21: Historic Market Size – Geography Segment 2017 - 2021 (million t)
    • 4.5 Country Segment Analysis 2017 - 2021
      • Exhibit 22: Historic Market Size – Country Segment 2017 - 2021 (million t)

    5 Five Forces Analysis

    • 5.1 Five forces summary
      • Exhibit 23: Five forces analysis - Comparison between 2022 and 2027
    • 5.2 Bargaining power of buyers
      • Exhibit 24: Chart on Bargaining power of buyers – Impact of key factors 2022 and 2027
    • 5.3 Bargaining power of suppliers
      • Exhibit 25: Bargaining power of suppliers – Impact of key factors in 2022 and 2027
    • 5.4 Threat of new entrants
      • Exhibit 26: Threat of new entrants – Impact of key factors in 2022 and 2027
    • 5.5 Threat of substitutes
      • Exhibit 27: Threat of substitutes – Impact of key factors in 2022 and 2027
    • 5.6 Threat of rivalry
      • Exhibit 28: Threat of rivalry – Impact of key factors in 2022 and 2027
    • 5.7 Market condition
      • Exhibit 29: Chart on Market condition - Five forces 2022 and 2027

    6 Market Segmentation by Product

    • 6.1 Market segments
      • Exhibit 30: Chart on Product - Market share 2022-2027 (%)
      • Exhibit 31: Data Table on Product - Market share 2022-2027 (%)
    • 6.2 Comparison by Product
      • Exhibit 32: Chart on Comparison by Product
      • Exhibit 33: Data Table on Comparison by Product
    • 6.3 Long grain - Market size and forecast 2022-2027
      • Exhibit 34: Chart on Long grain - Market size and forecast 2022-2027 (million t)
      • Exhibit 35: Data Table on Long grain - Market size and forecast 2022-2027 (million t)
      • Exhibit 36: Chart on Long grain - Year-over-year growth 2022-2027 (%)
      • Exhibit 37: Data Table on Long grain - Year-over-year growth 2022-2027 (%)
    • 6.4 Medium grain - Market size and forecast 2022-2027
      • Exhibit 38: Chart on Medium grain - Market size and forecast 2022-2027 (million t)
      • Exhibit 39: Data Table on Medium grain - Market size and forecast 2022-2027 (million t)
      • Exhibit 40: Chart on Medium grain - Year-over-year growth 2022-2027 (%)
      • Exhibit 41: Data Table on Medium grain - Year-over-year growth 2022-2027 (%)
    • 6.5 Short grain - Market size and forecast 2022-2027
      • Exhibit 42: Chart on Short grain - Market size and forecast 2022-2027 (million t)
      • Exhibit 43: Data Table on Short grain - Market size and forecast 2022-2027 (million t)
      • Exhibit 44: Chart on Short grain - Year-over-year growth 2022-2027 (%)
      • Exhibit 45: Data Table on Short grain - Year-over-year growth 2022-2027 (%)
    • 6.6 Market opportunity by Product
      • Exhibit 46: Market opportunity by Product (million t)

    7 Market Segmentation by Distribution Channel

    • 7.1 Market segments
      • Exhibit 47: Chart on Distribution Channel - Market share 2022-2027 (%)
      • Exhibit 48: Data Table on Distribution Channel - Market share 2022-2027 (%)
    • 7.2 Comparison by Distribution Channel
      • Exhibit 49: Chart on Comparison by Distribution Channel
      • Exhibit 50: Data Table on Comparison by Distribution Channel
    • 7.3 Offline - Market size and forecast 2022-2027
      • Exhibit 51: Chart on Offline - Market size and forecast 2022-2027 (million t)
      • Exhibit 52: Data Table on Offline - Market size and forecast 2022-2027 (million t)
      • Exhibit 53: Chart on Offline - Year-over-year growth 2022-2027 (%)
      • Exhibit 54: Data Table on Offline - Year-over-year growth 2022-2027 (%)
    • 7.4 Online - Market size and forecast 2022-2027
      • Exhibit 55: Chart on Online - Market size and forecast 2022-2027 (million t)
      • Exhibit 56: Data Table on Online - Market size and forecast 2022-2027 (million t)
      • Exhibit 57: Chart on Online - Year-over-year growth 2022-2027 (%)
      • Exhibit 58: Data Table on Online - Year-over-year growth 2022-2027 (%)
    • 7.5 Market opportunity by Distribution Channel
      • Exhibit 59: Market opportunity by Distribution Channel (million t)

    8 Customer Landscape

    • 8.1 Customer landscape overview
      • Exhibit 60: Analysis of price sensitivity, lifecycle, customer purchase basket, adoption rates, and purchase criteria

    9 Geographic Landscape

    • 9.1 Geographic segmentation
      • Exhibit 61: Chart on Market share by geography 2022-2027 (%)
      • Exhibit 62: Data Table on Market share by geography 2022-2027 (%)
    • 9.2 Geographic comparison
      • Exhibit 63: Chart on Geographic comparison
      • Exhibit 64: Data Table on Geographic comparison
    • 9.3 APAC - Market size and forecast 2022-2027
      • Exhibit 65: Chart on APAC - Market size and forecast 2022-2027 (million t)
      • Exhibit 66: Data Table on APAC - Market size and forecast 2022-2027 (million t)
      • Exhibit 67: Chart on APAC - Year-over-year growth 2022-2027 (%)
      • Exhibit 68: Data Table on APAC - Year-over-year growth 2022-2027 (%)
    • 9.4 Europe - Market size and forecast 2022-2027
      • Exhibit 69: Chart on Europe - Market size and forecast 2022-2027 (million t)
      • Exhibit 70: Data Table on Europe - Market size and forecast 2022-2027 (million t)
      • Exhibit 71: Chart on Europe - Year-over-year growth 2022-2027 (%)
      • Exhibit 72: Data Table on Europe - Year-over-year growth 2022-2027 (%)
    • 9.5 North America - Market size and forecast 2022-2027
      • Exhibit 73: Chart on North America - Market size and forecast 2022-2027 (million t)
      • Exhibit 74: Data Table on North America - Market size and forecast 2022-2027 (million t)
      • Exhibit 75: Chart on North America - Year-over-year growth 2022-2027 (%)
      • Exhibit 76: Data Table on North America - Year-over-year growth 2022-2027 (%)
    • 9.6 South America - Market size and forecast 2022-2027
      • Exhibit 77: Chart on South America - Market size and forecast 2022-2027 (million t)
      • Exhibit 78: Data Table on South America - Market size and forecast 2022-2027 (million t)
      • Exhibit 79: Chart on South America - Year-over-year growth 2022-2027 (%)
      • Exhibit 80: Data Table on South America - Year-over-year growth 2022-2027 (%)
    • 9.7 Middle East and Africa - Market size and forecast 2022-2027
      • Exhibit 81: Chart on Middle East and Africa - Market size and forecast 2022-2027 (million t)
      • Exhibit 82: Data Table on Middle East and Africa - Market size and forecast 2022-2027 (million t)
      • Exhibit 83: Chart on Middle East and Africa - Year-over-year growth 2022-2027 (%)
      • Exhibit 84: Data Table on Middle East and Africa - Year-over-year growth 2022-2027 (%)
    • 9.8 China - Market size and forecast 2022-2027
      • Exhibit 85: Chart on China - Market size and forecast 2022-2027 (million t)
      • Exhibit 86: Data Table on China - Market size and forecast 2022-2027 (million t)
      • Exhibit 87: Chart on China - Year-over-year growth 2022-2027 (%)
      • Exhibit 88: Data Table on China - Year-over-year growth 2022-2027 (%)
    • 9.9 India - Market size and forecast 2022-2027
      • Exhibit 89: Chart on India - Market size and forecast 2022-2027 (million t)
      • Exhibit 90: Data Table on India - Market size and forecast 2022-2027 (million t)
      • Exhibit 91: Chart on India - Year-over-year growth 2022-2027 (%)
      • Exhibit 92: Data Table on India - Year-over-year growth 2022-2027 (%)
    • 9.10 US - Market size and forecast 2022-2027
      • Exhibit 93: Chart on US - Market size and forecast 2022-2027 (million t)
      • Exhibit 94: Data Table on US - Market size and forecast 2022-2027 (million t)
      • Exhibit 95: Chart on US - Year-over-year growth 2022-2027 (%)
      • Exhibit 96: Data Table on US - Year-over-year growth 2022-2027 (%)
    • 9.11 Japan - Market size and forecast 2022-2027
      • Exhibit 97: Chart on Japan - Market size and forecast 2022-2027 (million t)
      • Exhibit 98: Data Table on Japan - Market size and forecast 2022-2027 (million t)
      • Exhibit 99: Chart on Japan - Year-over-year growth 2022-2027 (%)
      • Exhibit 100: Data Table on Japan - Year-over-year growth 2022-2027 (%)
    • 9.12 UK - Market size and forecast 2022-2027
      • Exhibit 101: Chart on UK - Market size and forecast 2022-2027 (million t)
      • Exhibit 102: Data Table on UK - Market size and forecast 2022-2027 (million t)
      • Exhibit 103: Chart on UK - Year-over-year growth 2022-2027 (%)
      • Exhibit 104: Data Table on UK - Year-over-year growth 2022-2027 (%)
    • 9.13 Market opportunity by geography
      • Exhibit 105: Market opportunity by geography (million t)

    10 Drivers, Challenges, and Trends

    • 10.1 Market drivers
      • 10.2 Market challenges
        • 10.3 Impact of drivers and challenges
          • Exhibit 106: Impact of drivers and challenges in 2022 and 2027
        • 10.4 Market trends

          11 Vendor Landscape

          • 11.1 Overview
            • 11.2 Vendor landscape
              • Exhibit 107: Overview on Criticality of inputs and Factors of differentiation
            • 11.3 Landscape disruption
              • Exhibit 108: Overview on factors of disruption
            • 11.4 Industry risks
              • Exhibit 109: Impact of key risks on business

            12 Vendor Analysis

            • 12.1 Vendors covered
              • Exhibit 110: Vendors covered
            • 12.2 Market positioning of vendors
              • Exhibit 111: Matrix on vendor position and classification
            • 12.3 Adani Wilmar Ltd.
              • Exhibit 112: Adani Wilmar Ltd. - Overview
              • Exhibit 113: Adani Wilmar Ltd. - Product / Service
              • Exhibit 114: Adani Wilmar Ltd. - Key offerings
            • 12.4 Amir Chand Jagdish Kumar Exports Ltd.
              • Exhibit 115: Amir Chand Jagdish Kumar Exports Ltd. - Overview
              • Exhibit 116: Amir Chand Jagdish Kumar Exports Ltd. - Product / Service
              • Exhibit 117: Amir Chand Jagdish Kumar Exports Ltd. - Key offerings
            • 12.5 Anheuser Busch InBev SA NV
              • Exhibit 118: Anheuser Busch InBev SA NV - Overview
              • Exhibit 119: Anheuser Busch InBev SA NV - Business segments
              • Exhibit 120: Anheuser Busch InBev SA NV - Key offerings
              • Exhibit 121: Anheuser Busch InBev SA NV - Segment focus
            • 12.6 Bunge Ltd.
              • Exhibit 122: Bunge Ltd. - Overview
              • Exhibit 123: Bunge Ltd. - Business segments
              • Exhibit 124: Bunge Ltd. - Key news
              • Exhibit 125: Bunge Ltd. - Key offerings
              • Exhibit 126: Bunge Ltd. - Segment focus
            • 12.7 California Family Foods
              • Exhibit 127: California Family Foods - Overview
              • Exhibit 128: California Family Foods - Product / Service
              • Exhibit 129: California Family Foods - Key offerings
            • 12.8 Cargill Inc.
              • Exhibit 130: Cargill Inc. - Overview
              • Exhibit 131: Cargill Inc. - Product / Service
              • Exhibit 132: Cargill Inc. - Key news
              • Exhibit 133: Cargill Inc. - Key offerings
            • 12.9 Ebro Foods SA
              • Exhibit 134: Ebro Foods SA - Overview
              • Exhibit 135: Ebro Foods SA - Business segments
              • Exhibit 136: Ebro Foods SA - Key offerings
              • Exhibit 137: Ebro Foods SA - Segment focus
            • 12.10 Farmers Rice Cooperative
              • Exhibit 138: Farmers Rice Cooperative - Overview
              • Exhibit 139: Farmers Rice Cooperative - Product / Service
              • Exhibit 140: Farmers Rice Cooperative - Key offerings
            • 12.11 GRM Overseas Ltd.
              • Exhibit 141: GRM Overseas Ltd. - Overview
              • Exhibit 142: GRM Overseas Ltd. - Product / Service
              • Exhibit 143: GRM Overseas Ltd. - Key offerings
            • 12.12 ITC Ltd.
              • Exhibit 144: ITC Ltd. - Overview
              • Exhibit 145: ITC Ltd. - Business segments
              • Exhibit 146: ITC Ltd. - Key offerings
              • Exhibit 147: ITC Ltd. - Segment focus
            • 12.13 Kohinoor Foods Ltd.
              • Exhibit 148: Kohinoor Foods Ltd. - Overview
              • Exhibit 149: Kohinoor Foods Ltd. - Product / Service
              • Exhibit 150: Kohinoor Foods Ltd. - Key offerings
            • 12.14 KRBL Ltd.
              • Exhibit 151: KRBL Ltd. - Overview
              • Exhibit 152: KRBL Ltd. - Business segments
              • Exhibit 153: KRBL Ltd. - Key offerings
              • Exhibit 154: KRBL Ltd. - Segment focus
            • 12.15 Louis Dreyfus Co. BV
              • Exhibit 155: Louis Dreyfus Co. BV - Overview
              • Exhibit 156: Louis Dreyfus Co. BV - Business segments
              • Exhibit 157: Louis Dreyfus Co. BV - Key offerings
              • Exhibit 158: Louis Dreyfus Co. BV - Segment focus
            • 12.16 LT Foods Ltd.
              • Exhibit 159: LT Foods Ltd. - Overview
              • Exhibit 160: LT Foods Ltd. - Product / Service
              • Exhibit 161: LT Foods Ltd. - Key offerings
            • 12.17 Riceland Foods Inc.
              • Exhibit 162: Riceland Foods Inc. - Overview
              • Exhibit 163: Riceland Foods Inc. - Product / Service
              • Exhibit 164: Riceland Foods Inc. - Key offerings

            13 Appendix

            • 13.1 Scope of the report
              • 13.2 Inclusions and exclusions checklist
                • Exhibit 165: Inclusions checklist
                • Exhibit 166: Exclusions checklist
              • 13.3 Currency conversion rates for US$
                • Exhibit 167: Currency conversion rates for US$
              • 13.4 Research methodology
                • Exhibit 168: Research methodology
                • Exhibit 169: Validation techniques employed for market sizing
                • Exhibit 170: Information sources
              • 13.5 List of abbreviations
                • Exhibit 171: List of abbreviations

              Research Methodology

              Technavio presents a detailed picture of the market by way of study, synthesis, and summation of data from multiple sources. The analysts have presented the various facets of the market with a particular focus on identifying the key industry influencers. The data thus presented is comprehensive, reliable, and the result of extensive research, both primary and secondary.

              INFORMATION SOURCES

              Primary sources

              • Manufacturers and suppliers
              • Channel partners
              • Industry experts
              • Strategic decision makers

              Secondary sources

              • Industry journals and periodicals
              • Government data
              • Financial reports of key industry players
              • Historical data
              • Press releases

              DATA ANALYSIS

              Data Synthesis

              • Collation of data
              • Estimation of key figures
              • Analysis of derived insights

              Data Validation

              • Triangulation with data models
              • Reference against proprietary databases
              • Corroboration with industry experts

              REPORT WRITING

              Qualitative

              • Market drivers
              • Market challenges
              • Market trends
              • Five forces analysis

              Quantitative

              • Market size and forecast
              • Market segmentation
              • Geographical insights
              • Competitive landscape

              Interested in this report?

              Get your sample now to see our research methodology and insights!

              Download Now

              Frequently Asked Questions

              Rice market growth will increase by 85.65 mn t during 2023-2027 .

              The Rice market is expected to grow at a CAGR of 3.6% during 2023-2027 .

              Rice market is segmented by Product( Long grain, Medium grain, Short grain) Distribution Channel( Offline, Online)

              Aashirvad International, Adani Wilmar Ltd., Amir Chand Jagdish Kumar Exports Ltd., Anheuser Busch InBev SA NV, Bunge Ltd., California Family Foods, Cargill Inc., Ebro Foods SA, Farmers Rice Cooperative, Gautam General Trading LLC, GRM Overseas Ltd., ITC Ltd., Kohinoor Foods Ltd., KRBL Ltd., Louis Dreyfus Co. BV, LT Foods Ltd., Riceland Foods Inc., Shriram Food Industry Pvt. Ltd., Sri Sai Nath Agri Industries Pvt. Ltd., Tamaki Rice Corp. are a few of the key vendors in the Rice market.

              APAC will register the highest growth rate of 73% among the other regions. Therefore, the Rice market in APAC is expected to garner significant business opportunities for the vendors during the forecast period.

              US, China, India, Japan, UK

              • Growing consumption of riceRice is a staple food for more than half of the world's population. Rice is the most commonly consumed food crop globally. In 2021-2022 is the driving factor this market.
              • the global per capita consumption of rice was 53 kilograms per year is the driving factor this market.
              • accounting for 19% of the daily calories. Asia accounted for 84% of global consumption is the driving factor this market.
              • followed by Africa (7%) is the driving factor this market.
              • South America (3%) is the driving factor this market.
              • and the Middle East (2%). The per capita rice consumption in Asia was 100 kilograms per year is the driving factor this market.
              • accounting for 28% of her daily calories. The per capita rice consumption of rice is expected to increase across the world is the driving factor this market.
              • including Asia is the driving factor this market.
              • Americas is the driving factor this market.
              • and Africa. The growing consumption of rice is majorly attributed to the growing population is the driving factor this market.
              • particularly in Asian is the driving factor this market.
              • African is the driving factor this market.
              • and Latin American countries where rice is a staple food item. According to the World Bank and United Nations data is the driving factor this market.
              • countries including Syria(4.4%) is the driving factor this market.
              • Niger(3.8%) is the driving factor this market.
              • and Angola (3.2%) had the highest population growth rate in the world in 2021. Moreover is the driving factor this market.
              • the growing per capita income plays an important role in driving the consumption of rice. According to the International Monetary Fund is the driving factor this market.
              • Asian countries is the driving factor this market.
              • including Macao(20.4%) is the driving factor this market.
              • Hong Kong(6.4%) is the driving factor this market.
              • and Singapore (6.0%) is the driving factor this market.
              • registered the highest growth rate in terms of per capita GDP in the world in 2021. Thus is the driving factor this market.
              • the growing population and the increasing per capita income across developing economies are likely to boost the consumption of rice is the driving factor this market.
              • which is the driving factor this market.
              • in turn is the driving factor this market.
              • will drive the growth of the global rice market during the forecast period. is the driving factor this market.

              The Rice market vendors should focus on grabbing business opportunities from the Long grain segment as it accounted for the largest market share in the base year.