Rice Flour Market Analysis, Size, and Forecast 2026-2030: APAC (China, India, and Japan), Europe (Germany, UK, and France), North America (US, Canada, and Mexico), South America (Brazil and Argentina), Middle East and Africa (Turkey, South Africa, and Saudi Arabia), and Rest of World (ROW)

Rice Flour Market Analysis, Size, and Forecast 2026-2030:
APAC (China, India, and Japan), Europe (Germany, UK, and France), North America (US, Canada, and Mexico), South America (Brazil and Argentina), Middle East and Africa (Turkey, South Africa, and Saudi Arabia), and Rest of World (ROW)

Published: Mar 2026 291 Pages SKU: IRTNTR40404

Market Overview at a Glance

$361.4 Mn
Market Opportunity
4.1%
CAGR 2025 - 2030
60.9%
APAC Growth
$1.06 B
Bakery and confectionery segment 2024

Rice Flour Market Size 2026-2030

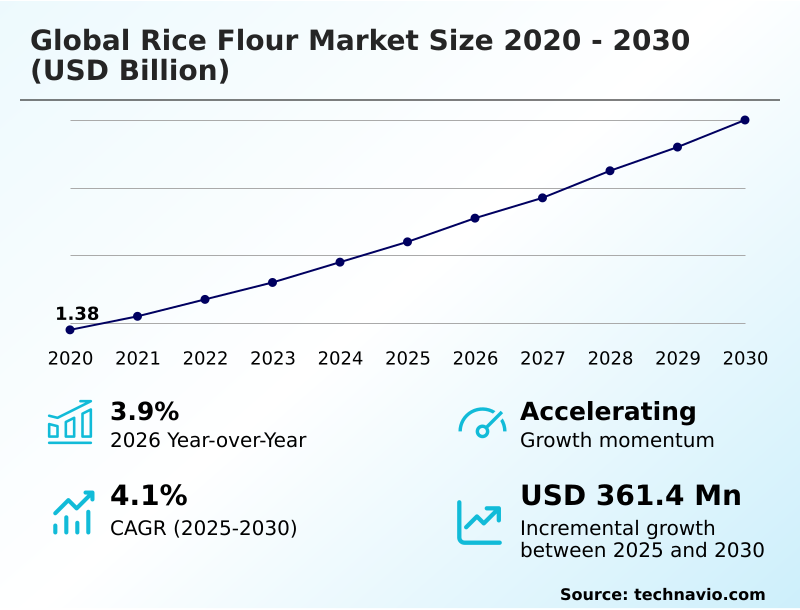
The rice flour market size is valued to increase by USD 361.4 million, at a CAGR of 4.1% from 2025 to 2030. Rising demand for gluten free and clean label solutions will drive the rice flour market.

Major Market Trends & Insights

  • APAC dominated the market and accounted for a 60.9% growth during the forecast period.
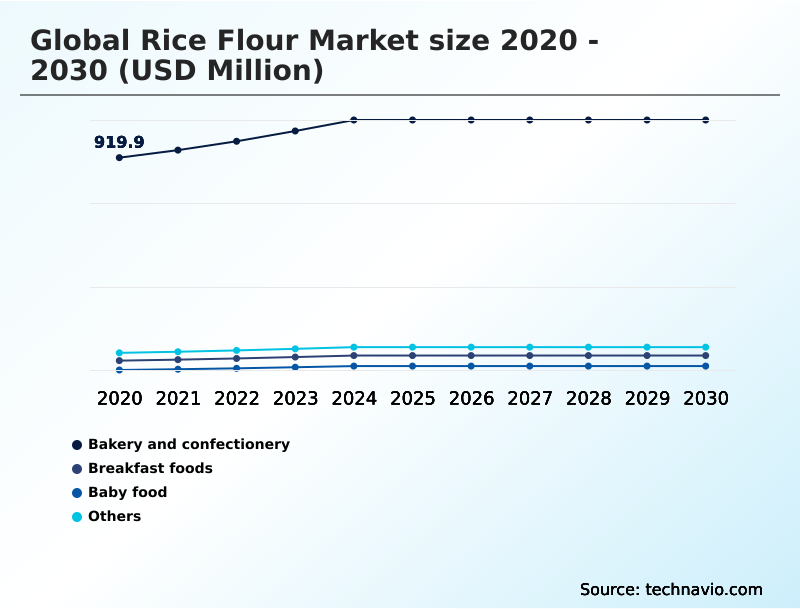
  • By Application - Bakery and confectionery segment was valued at USD 1.06 billion in 2024
  • By Type - Conventional segment accounted for the largest market revenue share in 2024

Market Size & Forecast

  • Market Opportunities: USD 619.4 million
  • Market Future Opportunities: USD 361.4 million
  • CAGR from 2025 to 2030 : 4.1%

Market Summary

  • The rice flour market is undergoing significant transformation, propelled by evolving consumer dietary habits and advancements in food processing technology. A primary driver is the accelerating demand for gluten-free formulations and clean label ingredients, as health-conscious consumers and those with dietary sensitivities seek alternatives to traditional wheat-based products.
  • This shift is reshaping product development across bakery, snacks, and infant nutrition sectors. Key trends include the growing preference for nutrient-dense options like brown rice flour and the adoption of sophisticated milling techniques that allow for precise control over particle size and functional properties. However, the industry grapples with challenges, notably supply chain volatility and stringent food safety regulations.
  • For example, a food manufacturer facing fluctuating raw material prices from a single sourcing region may implement a diversified procurement strategy, establishing relationships with suppliers across multiple geographies.
  • This approach mitigates risk, ensures a consistent supply of quality ingredients, and stabilizes production costs, allowing the company to maintain competitive pricing for its gluten-free product lines without compromising on safety or quality standards. This strategic adaptation is becoming essential for navigating market complexities and sustaining long-term growth.

What will be the Size of the Rice Flour Market during the forecast period?

Get Key Insights on Market Forecast (PDF) Request Free Sample

How is the Rice Flour Market Segmented?

The rice flour industry research report provides comprehensive data (region-wise segment analysis), with forecasts and estimates in "USD million" for the period 2026-2030, as well as historical data from 2020-2024 for the following segments.

  • Application
    • Bakery and confectionery
    • Breakfast foods
    • Baby food
    • Others
  • Type
    • Conventional
    • Organic
  • Source
    • White rice
    • Brown rice
  • Geography
    • APAC
      • China
      • India
      • Japan
    • Europe
      • Germany
      • UK
      • France
    • North America
      • US
      • Canada
      • Mexico
    • South America
      • Brazil
      • Argentina
    • Middle East and Africa
      • Turkey
      • South Africa
      • Saudi Arabia
    • Rest of World (ROW)

By Application Insights

The bakery and confectionery segment is estimated to witness significant growth during the forecast period.

The bakery and confectionery segment is a significant end-user, leveraging rice flour's functional versatility in gluten-free applications. Effective starch damage control during milling is crucial for achieving desired product outcomes.

The use of pregelatinized rice flour improves moisture absorption control, extending freshness in baked goods. Manufacturers utilize both brown rice flour for its nutritional profile and white rice flour for its neutral taste.

While challenges with dough elasticity improvement persist, advancements in processing and blending are enhancing performance. For instance, proprietary blends are achieving up to a 15% improvement in crumb structure compared to standard formulations.

This ingredient also serves as an effective fat replacer in bakery items and is integral to breading and coating systems, demonstrating its role beyond simple flour substitution.

Request Free Sample

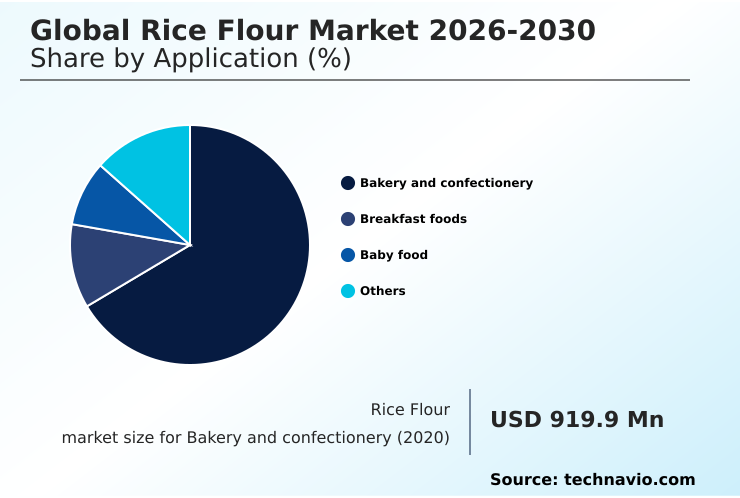
The Bakery and confectionery segment was valued at USD 1.06 billion in 2024 and showed a gradual increase during the forecast period.

Request Free Sample

Regional Analysis

APAC is estimated to contribute 60.9% to the growth of the global market during the forecast period.Technavio’s analysts have elaborately explained the regional trends and drivers that shape the market during the forecast period.

See How Rice Flour Market Demand is Rising in APAC Request Free Sample

The geographic landscape reveals distinct regional drivers. In APAC, high-volume applications like batter for deep-frying and traditional foods dominate, with a focus on batter viscosity management.

In contrast, North America and Europe prioritize specialized products such as infant nutrition grade flour for infant cereal formulation. These regions emphasize sustainable sourcing, fair trade certification, and supply chain traceability.

Innovations like cold milling techniques are more prevalent in western markets, helping preserve nutrients. For instance, using specialized flour for coatings has led to a 15% oil absorption reduction in fried foods.

The demand for ingredients ensuring shelf-life extension and serving as a pharmaceutical excipient is also growing globally, though adoption varies by region, with European regulations often driving a 10% higher compliance cost.

Market Dynamics

Our researchers analyzed the data with 2025 as the base year, along with the key drivers, trends, and challenges. A holistic analysis of drivers will help companies refine their marketing strategies to gain a competitive advantage.

  • A detailed analysis of the market reveals nuanced competitive dynamics. The debate over conventional vs organic rice flour functionality is central, with organic options increasingly preferred despite higher costs associated with cost of organic flour certification. The nutritional comparison of white vs brown rice flour nutrition continues to influence consumer choice in health-focused segments.
  • Technologically, extrusion technology for rice snacks is creating novel textures, while understanding the heat treatment impact on flour viscosity is crucial for developing consistent sauces and soups. The application of rice flour in gluten-free bread remains a primary driver, with producers constantly innovating. For specialized uses, micronized flour for beverage stability and pregelatinized flour for instant foods are gaining traction.
  • Its role as a rice flour as a pharmaceutical binder and a clean label thickener for soups highlights its versatility. The focus on safety is intense, with firms addressing how to managing arsenic in rice products and creating allergen-free infant food ingredients.
  • Strategic sourcing of sourcing non-gmo rice for flour is key, along with mitigating supply chain risk for rice imports. Functionally, it is used to develop better rice flour for crispy food coatings and improving texture in plant-based meats. Optimizing the impact of milling on starch damage and ensuring the shelf life of stabilized brown rice flour are key operational goals.
  • For instance, firms that master blending rice flour with other starches report a 25% lower rate of product failure in complex rice flour in confectionery applications compared to those using single-ingredient formulations.

What are the key market drivers leading to the rise in the adoption of Rice Flour Industry?

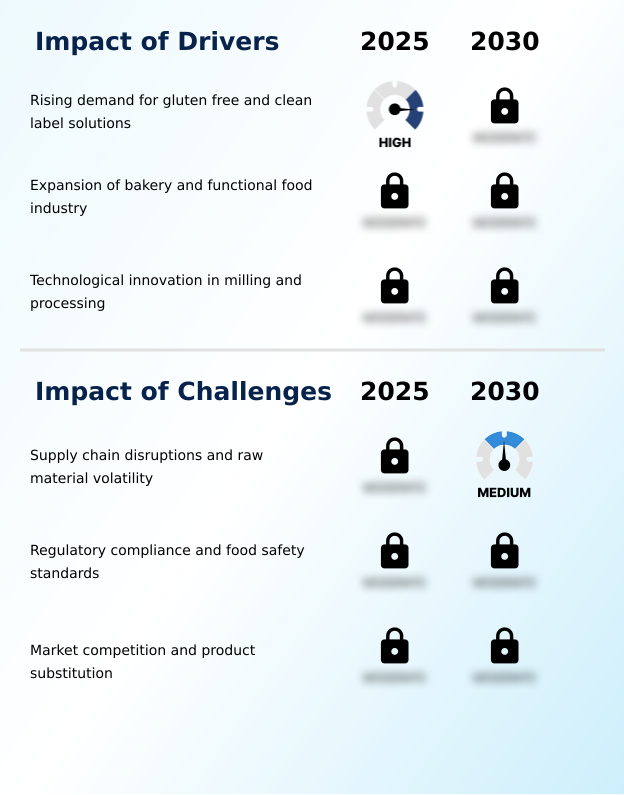
  • The rising demand for gluten-free and clean-label solutions is a key driver of market growth.

  • Market expansion is primarily driven by the rising demand for gluten-free formulations and clean label solutions.
  • As a key clean label ingredient, rice flour's hypoallergenic properties make it essential for hypoallergenic food production, with manufacturers achieving over 99.9% purity in dedicated facilities.
  • Its functional benefits as a thickening agent and natural food stabilizer with strong binding properties are critical.
  • For instance, its use as a viscosity modifier for sauces improves texture and stability, reducing the need for chemical additives by up to 25%.
  • Growth is also seen in its application in gluten-free baking mix and as a structural component in plant-based meat alternative products.
  • The focus on nutritional fortification and creating allergen-free ingredients further solidifies its market position, with some brands reporting a 10% increase in market share after reformulating with rice-based ingredients.

What are the market trends shaping the Rice Flour Industry?

  • A key market trend is the rising consumer preference for whole grain and brown rice flour varieties, signaling a significant shift toward more nutritious and minimally processed ingredients.

  • The market is evolving with a clear trend toward nutrient-dense ingredients and advanced processing. The adoption of an advanced extrusion method for textural modification in rice-based snack foods and gluten-free pasta production has improved product mouthfeel by over 20% compared to traditional methods.
  • Simultaneously, the demand for organic certification and whole grain flour is reshaping procurement, with companies adopting sustainable agricultural practice to meet consumer expectations. Investment in milling process optimization and fine milling techniques allows for the creation of a specialty flour blend with superior crispness enhancement.
  • These innovations address historical challenges like poor dough elasticity improvement, with some formulators reporting a 15% reduction in breakage. This shift is particularly evident in the organic baby food base segment, where purity is paramount.

What challenges does the Rice Flour Industry face during its growth?

  • Supply chain disruptions and raw material volatility are key challenges affecting industry growth.

  • The market faces significant hurdles from raw material volatility and stringent food safety standards, which can increase compliance costs by 15-20%. Adherence to regulations necessitates rigorous heavy metal testing and pesticide residue analysis, making a transparent supply chain and effective food allergen management critical. While demand for non-genetically modified ingredients grows, ensuring traceability adds complexity.
  • Companies are implementing automated quality control to manage these risks. Furthermore, optimizing production through co-product valorization and the efficient use of byproducts like dusting flour or broken rice utilization is key to offsetting margin pressures. Understanding factors like dough rheology and using appropriate food-grade packaging material are essential for maintaining product integrity amidst logistical disruptions.

Exclusive Technavio Analysis on Customer Landscape

The rice flour market forecasting report includes the adoption lifecycle of the market, covering from the innovator’s stage to the laggard’s stage. It focuses on adoption rates in different regions based on penetration. Furthermore, the rice flour market report also includes key purchase criteria and drivers of price sensitivity to help companies evaluate and develop their market growth analysis strategies.

Customer Landscape of Rice Flour Industry

Competitive Landscape

Companies are implementing various strategies, such as strategic alliances, rice flour market forecast, partnerships, mergers and acquisitions, geographical expansion, and product/service launches, to enhance their presence in the industry.

ABF Ingredients - Specialized rice flour is provided for industrial food formulations, enhancing functional performance in bakery and coating systems to improve texture and viscosity stability.

The industry research and growth report includes detailed analyses of the competitive landscape of the market and information about key companies, including:

  • ABF Ingredients
  • Archer Daniels Midland Co.
  • Ardent Mills LLC
  • Aryan International
  • Bhagwati Exports
  • Bobs Red Mill Natural Foods
  • Burapa Prosper Co. Ltd.
  • Caremoli SpA
  • Ebro foods SA
  • General Mills Inc.
  • Ingredion Inc.
  • Koda Farms Inc.
  • Kroner Starke GmbH
  • Lieng Tong Rice Vermicilli
  • Shipton Mill Ltd.
  • Thai Flour Industry Co. Ltd.
  • Western Foods
  • Woodland Foods Ltd.

Qualitative and quantitative analysis of companies has been conducted to help clients understand the wider business environment as well as the strengths and weaknesses of key industry players. Data is qualitatively analyzed to categorize companies as pure play, category-focused, industry-focused, and diversified; it is quantitatively analyzed to categorize companies as dominant, leading, strong, tentative, and weak.

Recent Development and News in Rice flour market

  • In August 2024, Koda Farms introduced a premium heirloom rice flour variety to differentiate its products from alternative grain flours in the specialty baking segment.
  • In February 2025, Thai Flour Industry Co. Ltd. implemented new digital tracking systems to mitigate the impact of irregular shipping schedules on the distribution of rice flour to North American and European markets.
  • In April 2025, Cho Heng Rice Vermicelli Factory expanded its industrial milling capacity in Thailand to produce higher volumes of superfine white rice flour for the export market, meeting growing global demand.
  • In June 2025, Burapa Prosper developed a new series of specialty rice starches and flours to improve the crispiness and oil resistance of gluten-free snacks in the APAC region.

Dive into Technavio’s robust research methodology, blending expert interviews, extensive data synthesis, and validated models for unparalleled Rice Flour Market insights. See full methodology.

Market Scope
Page number 291
Base year 2025
Historic period 2020-2024
Forecast period 2026-2030
Growth momentum & CAGR Accelerate at a CAGR of 4.1%
Market growth 2026-2030 USD 361.4 million
Market structure Fragmented
YoY growth 2025-2026(%) 3.9%
Key countries China, India, Thailand, Vietnam, Japan, Indonesia, Germany, UK, France, Italy, Spain, The Netherlands, US, Canada, Mexico, Brazil, Argentina, Chile, Turkey, South Africa, Saudi Arabia, Egypt and UAE
Competitive landscape Leading Companies, Market Positioning of Companies, Competitive Strategies, and Industry Risks

Request Free Sample

Research Analyst Overview

  • The market is pivoting from a commodity focus to specialized, functional ingredients, forcing boardroom decisions on capital investment in new processing technologies. The demand for gluten-free formulations and clean label solutions is driving innovation in fine milling techniques and cold milling techniques to produce infant nutrition grade flour with superior hypoallergenic properties.
  • Companies are leveraging advanced extrusion method for textural modification in new product categories. The use of heat-treated rice flours and pregelatinized rice flour ensures better moisture absorption control and shelf-life extension. Achieving specific particle size uniformity and starch damage control is now critical for managing batter viscosity management and dough rheology.
  • Investing in these capabilities can reduce processing defects by over 20%. The market is also seeing a shift toward whole grain flour and brown rice flour for nutritional fortification. Ensuring a transparent supply chain and adherence to food safety standards for allergen-free ingredients is non-negotiable. This includes sustainable sourcing of non-genetically modified crops and achieving organic certification.
  • Functionally, it is used as a thickening agent, for crispness enhancement, oil absorption reduction, and to improve binding properties and dough elasticity improvement. Even byproducts see co-product valorization, with applications as dusting flour or a pharmaceutical excipient.

What are the Key Data Covered in this Rice Flour Market Research and Growth Report?

  • What is the expected growth of the Rice Flour Market between 2026 and 2030?

    • USD 361.4 million, at a CAGR of 4.1%

  • What segmentation does the market report cover?

    • The report is segmented by Application (Bakery and confectionery, Breakfast foods, Baby food, and Others), Type (Conventional, and Organic), Source (White rice, and Brown rice) and Geography (APAC, Europe, North America, South America, Middle East and Africa)

  • Which regions are analyzed in the report?

    • APAC, Europe, North America, South America and Middle East and Africa

  • What are the key growth drivers and market challenges?

    • Rising demand for gluten free and clean label solutions, Supply chain disruptions and raw material volatility

  • Who are the major players in the Rice Flour Market?

    • ABF Ingredients, Archer Daniels Midland Co., Ardent Mills LLC, Aryan International, Bhagwati Exports, Bobs Red Mill Natural Foods, Burapa Prosper Co. Ltd., Caremoli SpA, Ebro foods SA, General Mills Inc., Ingredion Inc., Koda Farms Inc., Kroner Starke GmbH, Lieng Tong Rice Vermicilli, Shipton Mill Ltd., Thai Flour Industry Co. Ltd., Western Foods and Woodland Foods Ltd.

Market Research Insights

  • The market's dynamism is evident in the shift towards specialized applications, from gluten-free baking mix to plant-based meat alternative formulations. The demand for a clean label ingredient is paramount, driving adoption in hypoallergenic food production and organic baby food base products.
  • Strategic milling process optimization and automated quality control have enhanced consistency, with some producers reporting a 15% reduction in batch variability. Applications now include rice-based snack foods, breakfast cereal extrusion, and gluten-free pasta production.
  • Its role as a natural food stabilizer and viscosity modifier for sauces is growing, while innovations in breading and coating systems and batter for deep-frying improve texture. The use in a specialty flour blend or as a confectionery dusting agent shows versatility. In functional foods, it's a key functional food ingredient and nutraceutical delivery system.
  • Supply chains now emphasize sustainable agricultural practice, fair trade certification, and supply chain traceability, with rigorous heavy metal testing, pesticide residue analysis, and food allergen management ensuring safety.
  • This focus on quality, including using proper food-grade packaging material and maximizing broken rice utilization, has improved product integrity, reducing spoilage by up to 10% for some suppliers who also pursue non-GMO project verification.

We can help! Our analysts can customize this rice flour market research report to meet your requirements.

Get in touch

1. Executive Summary

1.1 Market overview

Executive Summary - Chart on Market Overview
Executive Summary - Data Table on Market Overview
Executive Summary - Chart on Global Market Characteristics
Executive Summary - Chart on Market by Geography
Executive Summary - Chart on Market Segmentation by Application
Executive Summary - Chart on Market Segmentation by Type
Executive Summary - Chart on Market Segmentation by Source
Executive Summary - Chart on Incremental Growth
Executive Summary - Data Table on Incremental Growth
Executive Summary - Chart on Company Market Positioning

2. Technavio Analysis

2.1 Analysis of price sensitivity, lifecycle, customer purchase basket, adoption rates, and purchase criteria

2.2 Criticality of inputs and Factors of differentiation

Chart on Overview on criticality of inputs and factors of differentiation

2.3 Factors of disruption

Chart on Overview on factors of disruption

2.4 Impact of drivers and challenges

Chart on Impact of drivers and challenges in 2025 and 2030

3. Market Landscape

3.1 Market ecosystem

Chart on Parent Market
Data Table on - Parent Market

3.2 Market characteristics

Chart on Market characteristics analysis

3.3 Value chain analysis

Chart on Value chain analysis

4. Market Sizing

4.1 Market definition

Data Table on Offerings of companies included in the market definition

4.2 Market segment analysis

Market segments

4.3 Market size 2025

4.4 Market outlook: Forecast for 2025-2030

Chart on Global - Market size and forecast 2025-2030 ($ million)
Data Table on Global - Market size and forecast 2025-2030 ($ million)
Chart on Global Market: Year-over-year growth 2025-2030 (%)
Data Table on Global Market: Year-over-year growth 2025-2030 (%)

5. Historic Market Size

5.1 Global Rice Flour Market 2020 - 2024

Historic Market Size - Data Table on Global Rice Flour Market 2020 - 2024 ($ million)

5.2 Application segment analysis 2020 - 2024

Historic Market Size - Application Segment 2020 - 2024 ($ million)

5.3 Type segment analysis 2020 - 2024

Historic Market Size - Type Segment 2020 - 2024 ($ million)

5.4 Source segment analysis 2020 - 2024

Historic Market Size - Source Segment 2020 - 2024 ($ million)

5.5 Geography segment analysis 2020 - 2024

Historic Market Size - Geography Segment 2020 - 2024 ($ million)

5.6 Country segment analysis 2020 - 2024

Historic Market Size - Country Segment 2020 - 2024 ($ million)

6. Qualitative Analysis

6.1 Impact of AI on Global Rice Flour Market

7. Five Forces Analysis

7.1 Five forces summary

Five forces analysis - Comparison between 2025 and 2030

7.2 Bargaining power of buyers

Bargaining power of buyers - Impact of key factors 2025 and 2030

7.3 Bargaining power of suppliers

Bargaining power of suppliers - Impact of key factors in 2025 and 2030

7.4 Threat of new entrants

Threat of new entrants - Impact of key factors in 2025 and 2030

7.5 Threat of substitutes

Threat of substitutes - Impact of key factors in 2025 and 2030

7.6 Threat of rivalry

Threat of rivalry - Impact of key factors in 2025 and 2030

7.7 Market condition

Chart on Market condition - Five forces 2025 and 2030

8. Market Segmentation by Application

8.1 Market segments

Chart on Application - Market share 2025-2030 (%)
Data Table on Application - Market share 2025-2030 (%)

8.2 Comparison by Application

Chart on Comparison by Application
Data Table on Comparison by Application

8.3 Bakery and confectionery - Market size and forecast 2025-2030

Chart on Bakery and confectionery - Market size and forecast 2025-2030 ($ million)
Data Table on Bakery and confectionery - Market size and forecast 2025-2030 ($ million)
Chart on Bakery and confectionery - Year-over-year growth 2025-2030 (%)
Data Table on Bakery and confectionery - Year-over-year growth 2025-2030 (%)

8.4 Breakfast foods - Market size and forecast 2025-2030

Chart on Breakfast foods - Market size and forecast 2025-2030 ($ million)
Data Table on Breakfast foods - Market size and forecast 2025-2030 ($ million)
Chart on Breakfast foods - Year-over-year growth 2025-2030 (%)
Data Table on Breakfast foods - Year-over-year growth 2025-2030 (%)

8.5 Baby food - Market size and forecast 2025-2030

Chart on Baby food - Market size and forecast 2025-2030 ($ million)
Data Table on Baby food - Market size and forecast 2025-2030 ($ million)
Chart on Baby food - Year-over-year growth 2025-2030 (%)
Data Table on Baby food - Year-over-year growth 2025-2030 (%)

8.6 Others - Market size and forecast 2025-2030

Chart on Others - Market size and forecast 2025-2030 ($ million)
Data Table on Others - Market size and forecast 2025-2030 ($ million)
Chart on Others - Year-over-year growth 2025-2030 (%)
Data Table on Others - Year-over-year growth 2025-2030 (%)

8.7 Market opportunity by Application

Market opportunity by Application ($ million)
Data Table on Market opportunity by Application ($ million)

9. Market Segmentation by Type

9.1 Market segments

Chart on Type - Market share 2025-2030 (%)
Data Table on Type - Market share 2025-2030 (%)

9.2 Comparison by Type

Chart on Comparison by Type
Data Table on Comparison by Type

9.3 Conventional - Market size and forecast 2025-2030

Chart on Conventional - Market size and forecast 2025-2030 ($ million)
Data Table on Conventional - Market size and forecast 2025-2030 ($ million)
Chart on Conventional - Year-over-year growth 2025-2030 (%)
Data Table on Conventional - Year-over-year growth 2025-2030 (%)

9.4 Organic - Market size and forecast 2025-2030

Chart on Organic - Market size and forecast 2025-2030 ($ million)
Data Table on Organic - Market size and forecast 2025-2030 ($ million)
Chart on Organic - Year-over-year growth 2025-2030 (%)
Data Table on Organic - Year-over-year growth 2025-2030 (%)

9.5 Market opportunity by Type

Market opportunity by Type ($ million)
Data Table on Market opportunity by Type ($ million)

10. Market Segmentation by Source

10.1 Market segments

Chart on Source - Market share 2025-2030 (%)
Data Table on Source - Market share 2025-2030 (%)

10.2 Comparison by Source

Chart on Comparison by Source
Data Table on Comparison by Source

10.3 White rice - Market size and forecast 2025-2030

Chart on White rice - Market size and forecast 2025-2030 ($ million)
Data Table on White rice - Market size and forecast 2025-2030 ($ million)
Chart on White rice - Year-over-year growth 2025-2030 (%)
Data Table on White rice - Year-over-year growth 2025-2030 (%)

10.4 Brown rice - Market size and forecast 2025-2030

Chart on Brown rice - Market size and forecast 2025-2030 ($ million)
Data Table on Brown rice - Market size and forecast 2025-2030 ($ million)
Chart on Brown rice - Year-over-year growth 2025-2030 (%)
Data Table on Brown rice - Year-over-year growth 2025-2030 (%)

10.5 Market opportunity by Source

Market opportunity by Source ($ million)
Data Table on Market opportunity by Source ($ million)

11. Customer Landscape

11.1 Customer landscape overview

Analysis of price sensitivity, lifecycle, customer purchase basket, adoption rates, and purchase criteria

12. Geographic Landscape

12.1 Geographic segmentation

Chart on Market share by geography 2025-2030 (%)
Data Table on Market share by geography 2025-2030 (%)

12.2 Geographic comparison

Chart on Geographic comparison
Data Table on Geographic comparison

12.3 APAC - Market size and forecast 2025-2030

Chart on APAC - Market size and forecast 2025-2030 ($ million)
Data Table on APAC - Market size and forecast 2025-2030 ($ million)
Chart on APAC - Year-over-year growth 2025-2030 (%)
Data Table on APAC - Year-over-year growth 2025-2030 (%)
Chart on Regional Comparison - APAC
Data Table on Regional Comparison - APAC

12.3.1 China - Market size and forecast 2025-2030

Chart on China - Market size and forecast 2025-2030 ($ million)
Data Table on China - Market size and forecast 2025-2030 ($ million)
Chart on China - Year-over-year growth 2025-2030 (%)
Data Table on China - Year-over-year growth 2025-2030 (%)

12.3.2 India - Market size and forecast 2025-2030

Chart on India - Market size and forecast 2025-2030 ($ million)
Data Table on India - Market size and forecast 2025-2030 ($ million)
Chart on India - Year-over-year growth 2025-2030 (%)
Data Table on India - Year-over-year growth 2025-2030 (%)

12.3.3 Thailand - Market size and forecast 2025-2030

Chart on Thailand - Market size and forecast 2025-2030 ($ million)
Data Table on Thailand - Market size and forecast 2025-2030 ($ million)
Chart on Thailand - Year-over-year growth 2025-2030 (%)
Data Table on Thailand - Year-over-year growth 2025-2030 (%)

12.3.4 Vietnam - Market size and forecast 2025-2030

Chart on Vietnam - Market size and forecast 2025-2030 ($ million)
Data Table on Vietnam - Market size and forecast 2025-2030 ($ million)
Chart on Vietnam - Year-over-year growth 2025-2030 (%)
Data Table on Vietnam - Year-over-year growth 2025-2030 (%)

12.3.5 Japan - Market size and forecast 2025-2030

Chart on Japan - Market size and forecast 2025-2030 ($ million)
Data Table on Japan - Market size and forecast 2025-2030 ($ million)
Chart on Japan - Year-over-year growth 2025-2030 (%)
Data Table on Japan - Year-over-year growth 2025-2030 (%)

12.3.6 Indonesia - Market size and forecast 2025-2030

Chart on Indonesia - Market size and forecast 2025-2030 ($ million)
Data Table on Indonesia - Market size and forecast 2025-2030 ($ million)
Chart on Indonesia - Year-over-year growth 2025-2030 (%)
Data Table on Indonesia - Year-over-year growth 2025-2030 (%)

12.4 Europe - Market size and forecast 2025-2030

Chart on Europe - Market size and forecast 2025-2030 ($ million)
Data Table on Europe - Market size and forecast 2025-2030 ($ million)
Chart on Europe - Year-over-year growth 2025-2030 (%)
Data Table on Europe - Year-over-year growth 2025-2030 (%)
Chart on Regional Comparison - Europe
Data Table on Regional Comparison - Europe

12.4.1 Germany - Market size and forecast 2025-2030

Chart on Germany - Market size and forecast 2025-2030 ($ million)
Data Table on Germany - Market size and forecast 2025-2030 ($ million)
Chart on Germany - Year-over-year growth 2025-2030 (%)
Data Table on Germany - Year-over-year growth 2025-2030 (%)

12.4.2 UK - Market size and forecast 2025-2030

Chart on UK - Market size and forecast 2025-2030 ($ million)
Data Table on UK - Market size and forecast 2025-2030 ($ million)
Chart on UK - Year-over-year growth 2025-2030 (%)
Data Table on UK - Year-over-year growth 2025-2030 (%)

12.4.3 France - Market size and forecast 2025-2030

Chart on France - Market size and forecast 2025-2030 ($ million)
Data Table on France - Market size and forecast 2025-2030 ($ million)
Chart on France - Year-over-year growth 2025-2030 (%)
Data Table on France - Year-over-year growth 2025-2030 (%)

12.4.4 Italy - Market size and forecast 2025-2030

Chart on Italy - Market size and forecast 2025-2030 ($ million)
Data Table on Italy - Market size and forecast 2025-2030 ($ million)
Chart on Italy - Year-over-year growth 2025-2030 (%)
Data Table on Italy - Year-over-year growth 2025-2030 (%)

12.4.5 Spain - Market size and forecast 2025-2030

Chart on Spain - Market size and forecast 2025-2030 ($ million)
Data Table on Spain - Market size and forecast 2025-2030 ($ million)
Chart on Spain - Year-over-year growth 2025-2030 (%)
Data Table on Spain - Year-over-year growth 2025-2030 (%)

12.4.6 The Netherlands - Market size and forecast 2025-2030

Chart on The Netherlands - Market size and forecast 2025-2030 ($ million)
Data Table on The Netherlands - Market size and forecast 2025-2030 ($ million)
Chart on The Netherlands - Year-over-year growth 2025-2030 (%)
Data Table on The Netherlands - Year-over-year growth 2025-2030 (%)

12.5 North America - Market size and forecast 2025-2030

Chart on North America - Market size and forecast 2025-2030 ($ million)
Data Table on North America - Market size and forecast 2025-2030 ($ million)
Chart on North America - Year-over-year growth 2025-2030 (%)
Data Table on North America - Year-over-year growth 2025-2030 (%)
Chart on Regional Comparison - North America
Data Table on Regional Comparison - North America

12.5.1 US - Market size and forecast 2025-2030

Chart on US - Market size and forecast 2025-2030 ($ million)
Data Table on US - Market size and forecast 2025-2030 ($ million)
Chart on US - Year-over-year growth 2025-2030 (%)
Data Table on US - Year-over-year growth 2025-2030 (%)

12.5.2 Canada - Market size and forecast 2025-2030

Chart on Canada - Market size and forecast 2025-2030 ($ million)
Data Table on Canada - Market size and forecast 2025-2030 ($ million)
Chart on Canada - Year-over-year growth 2025-2030 (%)
Data Table on Canada - Year-over-year growth 2025-2030 (%)

12.5.3 Mexico - Market size and forecast 2025-2030

Chart on Mexico - Market size and forecast 2025-2030 ($ million)
Data Table on Mexico - Market size and forecast 2025-2030 ($ million)
Chart on Mexico - Year-over-year growth 2025-2030 (%)
Data Table on Mexico - Year-over-year growth 2025-2030 (%)

12.6 South America - Market size and forecast 2025-2030

Chart on South America - Market size and forecast 2025-2030 ($ million)
Data Table on South America - Market size and forecast 2025-2030 ($ million)
Chart on South America - Year-over-year growth 2025-2030 (%)
Data Table on South America - Year-over-year growth 2025-2030 (%)
Chart on Regional Comparison - South America
Data Table on Regional Comparison - South America

12.6.1 Brazil - Market size and forecast 2025-2030

Chart on Brazil - Market size and forecast 2025-2030 ($ million)
Data Table on Brazil - Market size and forecast 2025-2030 ($ million)
Chart on Brazil - Year-over-year growth 2025-2030 (%)
Data Table on Brazil - Year-over-year growth 2025-2030 (%)

12.6.2 Argentina - Market size and forecast 2025-2030

Chart on Argentina - Market size and forecast 2025-2030 ($ million)
Data Table on Argentina - Market size and forecast 2025-2030 ($ million)
Chart on Argentina - Year-over-year growth 2025-2030 (%)
Data Table on Argentina - Year-over-year growth 2025-2030 (%)

12.6.3 Chile - Market size and forecast 2025-2030

Chart on Chile - Market size and forecast 2025-2030 ($ million)
Data Table on Chile - Market size and forecast 2025-2030 ($ million)
Chart on Chile - Year-over-year growth 2025-2030 (%)
Data Table on Chile - Year-over-year growth 2025-2030 (%)

12.7 Middle East and Africa - Market size and forecast 2025-2030

Chart on Middle East and Africa - Market size and forecast 2025-2030 ($ million)
Data Table on Middle East and Africa - Market size and forecast 2025-2030 ($ million)
Chart on Middle East and Africa - Year-over-year growth 2025-2030 (%)
Data Table on Middle East and Africa - Year-over-year growth 2025-2030 (%)
Chart on Regional Comparison - Middle East and Africa
Data Table on Regional Comparison - Middle East and Africa

12.7.1 Turkey - Market size and forecast 2025-2030

Chart on Turkey - Market size and forecast 2025-2030 ($ million)
Data Table on Turkey - Market size and forecast 2025-2030 ($ million)
Chart on Turkey - Year-over-year growth 2025-2030 (%)
Data Table on Turkey - Year-over-year growth 2025-2030 (%)

12.7.2 South Africa - Market size and forecast 2025-2030

Chart on South Africa - Market size and forecast 2025-2030 ($ million)
Data Table on South Africa - Market size and forecast 2025-2030 ($ million)
Chart on South Africa - Year-over-year growth 2025-2030 (%)
Data Table on South Africa - Year-over-year growth 2025-2030 (%)

12.7.3 Saudi Arabia - Market size and forecast 2025-2030

Chart on Saudi Arabia - Market size and forecast 2025-2030 ($ million)
Data Table on Saudi Arabia - Market size and forecast 2025-2030 ($ million)
Chart on Saudi Arabia - Year-over-year growth 2025-2030 (%)
Data Table on Saudi Arabia - Year-over-year growth 2025-2030 (%)

12.7.4 Egypt - Market size and forecast 2025-2030

Chart on Egypt - Market size and forecast 2025-2030 ($ million)
Data Table on Egypt - Market size and forecast 2025-2030 ($ million)
Chart on Egypt - Year-over-year growth 2025-2030 (%)
Data Table on Egypt - Year-over-year growth 2025-2030 (%)

12.7.5 UAE - Market size and forecast 2025-2030

Chart on UAE - Market size and forecast 2025-2030 ($ million)
Data Table on UAE - Market size and forecast 2025-2030 ($ million)
Chart on UAE - Year-over-year growth 2025-2030 (%)
Data Table on UAE - Year-over-year growth 2025-2030 (%)

12.8 Market opportunity by geography

Market opportunity by geography ($ million)
Data Tables on Market opportunity by geography ($ million)

13. Drivers, Challenges, and Opportunity

13.1 Market drivers

Rising demand for gluten free and clean label solutions
Expansion of bakery and functional food industry
Technological innovation in milling and processing

13.2 Market challenges

Supply chain disruptions and raw material volatility
Regulatory compliance and food safety standards
Market competition and product substitution

13.3 Impact of drivers and challenges

Impact of drivers and challenges in 2025 and 2030

13.4 Market opportunities

Growing preference for whole grain and brown rice flour varieties
Emphasis on organic certification for consumer trust
Growing adoption of advance extrusion method for texture modification

14. Competitive Landscape

14.1 Overview

14.2

Overview on criticality of inputs and factors of differentiation

14.3 Landscape disruption

Overview on factors of disruption

14.4 Industry risks

Impact of key risks on business

15. Competitive Analysis

15.1 Companies profiled

Companies covered

15.2 Company ranking index

15.3 Market positioning of companies

Matrix on companies position and classification

15.4 ABF Ingredients

ABF Ingredients - Overview
ABF Ingredients - Product / Service
ABF Ingredients - Key offerings
SWOT

15.5 Archer Daniels Midland Co.

Archer Daniels Midland Co. - Overview
Archer Daniels Midland Co. - Business segments
Archer Daniels Midland Co. - Key news
Archer Daniels Midland Co. - Key offerings
Archer Daniels Midland Co. - Segment focus
SWOT

15.6 Ardent Mills LLC

Ardent Mills LLC - Overview
Ardent Mills LLC - Product / Service
Ardent Mills LLC - Key offerings
SWOT

15.7 Aryan International

Aryan International - Overview
Aryan International - Product / Service
Aryan International - Key offerings
SWOT

15.8 Bhagwati Exports

Bhagwati Exports - Overview
Bhagwati Exports - Product / Service
Bhagwati Exports - Key offerings
SWOT

15.9 Bobs Red Mill Natural Foods

Bobs Red Mill Natural Foods - Overview
Bobs Red Mill Natural Foods - Product / Service
Bobs Red Mill Natural Foods - Key offerings
SWOT

15.10 Burapa Prosper Co. Ltd.

Burapa Prosper Co. Ltd. - Overview
Burapa Prosper Co. Ltd. - Product / Service
Burapa Prosper Co. Ltd. - Key offerings
SWOT

15.11 Caremoli SpA

Caremoli SpA - Overview
Caremoli SpA - Product / Service
Caremoli SpA - Key offerings
SWOT

15.12 Ebro foods SA

Ebro foods SA - Overview
Ebro foods SA - Product / Service
Ebro foods SA - Key offerings
SWOT

15.13 General Mills Inc.

General Mills Inc. - Overview
General Mills Inc. - Business segments
General Mills Inc. - Key news
General Mills Inc. - Key offerings
General Mills Inc. - Segment focus
SWOT

15.14 Ingredion Inc.

Ingredion Inc. - Overview
Ingredion Inc. - Business segments
Ingredion Inc. - Key news
Ingredion Inc. - Key offerings
Ingredion Inc. - Segment focus
SWOT

15.15 Koda Farms Inc.

Koda Farms Inc. - Overview
Koda Farms Inc. - Product / Service
Koda Farms Inc. - Key offerings
SWOT

15.16 Kroner Starke GmbH

Kroner Starke GmbH - Overview
Kroner Starke GmbH - Product / Service
Kroner Starke GmbH - Key offerings
SWOT

15.17 Lieng Tong Rice Vermicilli

Lieng Tong Rice Vermicilli - Overview
Lieng Tong Rice Vermicilli - Product / Service
Lieng Tong Rice Vermicilli - Key offerings
SWOT

15.18 Shipton Mill Ltd.

Shipton Mill Ltd. - Overview
Shipton Mill Ltd. - Product / Service
Shipton Mill Ltd. - Key offerings
SWOT

16. Appendix

16.1 Scope of the report

Market definition
Objectives
Notes and caveats

16.2 Inclusions and exclusions checklist

Inclusions checklist
Exclusions checklist

16.3 Currency conversion rates for US$

16.4 Research methodology

16.5 Data procurement

Information sources

16.6 Data validation

16.7 Validation techniques employed for market sizing

16.8 Data synthesis

16.9 360 degree market analysis

16.10 List of abbreviations

Research Methodology

Technavio presents a detailed picture of the market by way of study, synthesis, and summation of data from multiple sources. The analysts have presented the various facets of the market with a particular focus on identifying the key industry influencers. The data thus presented is comprehensive, reliable, and the result of extensive research, both primary and secondary.

INFORMATION SOURCES

Primary sources

  • Manufacturers and suppliers
  • Channel partners
  • Industry experts
  • Strategic decision makers

Secondary sources

  • Industry journals and periodicals
  • Government data
  • Financial reports of key industry players
  • Historical data
  • Press releases

DATA ANALYSIS

Data Synthesis

  • Collation of data
  • Estimation of key figures
  • Analysis of derived insights

Data Validation

  • Triangulation with data models
  • Reference against proprietary databases
  • Corroboration with industry experts

REPORT WRITING

Qualitative

  • Market drivers
  • Market challenges
  • Market trends
  • Five forces analysis

Quantitative

  • Market size and forecast
  • Market segmentation
  • Geographical insights
  • Competitive landscape

Interested in this report?

Get your sample now to see our research methodology and insights!

Download Now

Frequently Asked Questions

Rice Flour market growth will increase by USD 361.4 million during 2026-2030.

The Rice Flour market is expected to grow at a CAGR of 4.1% during 2026-2030.

Rice Flour market is segmented by Application (Bakery and confectionery, Breakfast foods, Baby food, Others) Type (Conventional, Organic) Source (White rice, Brown rice)

ABF Ingredients, Archer Daniels Midland Co., Ardent Mills LLC, Aryan International, Bhagwati Exports, Bobs Red Mill Natural Foods, Burapa Prosper Co. Ltd., Caremoli SpA, Ebro foods SA, General Mills Inc., Ingredion Inc., Koda Farms Inc., Kroner Starke GmbH, Lieng Tong Rice Vermicilli, Shipton Mill Ltd., Thai Flour Industry Co. Ltd., Western Foods, Woodland Foods Ltd. are a few of the key vendors in the Rice Flour market.

APAC will register the highest growth rate of 60.9% among the other regions. Therefore, the Rice Flour market in APAC is expected to garner significant business opportunities for the vendors during the forecast period.

China, India, Thailand, Vietnam, Japan, Indonesia, Germany, UK, France, Italy, Spain, The Netherlands, US, Canada, Mexico, Brazil, Argentina, Chile, Turkey, South Africa, Saudi Arabia, Egypt, UAE

  • Rising demand for gluten free and clean label solutions is the driving factor this market.

The Rice Flour market vendors should focus on grabbing business opportunities from the Application segment as it accounted for the largest market share in the base year.
RIA - Research AI Assistant
Ask RIA