
Rice Wine Market Size 2024-2028
The rice wine market size is forecast to increase by USD 3.00 billion at a CAGR of 4.36% between 2023 and 2028. The market is experiencing significant growth due to several key trends. The increasing use of online sales channels is driving market growth, as consumers turn to e-commerce platforms for convenience and access to a wider selection of rice wines. Additionally, the growing popularity of rice wine in cocktails and cuisines is expanding its application beyond traditional uses, making it a versatile beverage choice for consumers.
However, the market faces challenges from increasing competition from other wines, particularly from the growing popularity of other types of alcoholic beverages. Producers must differentiate themselves through product innovation, pricing strategies, and effective marketing to maintain market share. Overall, the market is expected to continue its growth trajectory, driven by these trends and challenges.

The market is a significant segment of the alcoholic beverage industry, characterized by the production and consumption of fermented rice-based drinks. Unlike grapes used for wine, rice is the primary ingredient, and the fermentation process involves yeast and sugar. Rice wine offers unique flavor profiles, with taste and aroma varying depending on the type, such as Yogurt Sake, Red Rice Wine, Rose Rice Wine, and Sparkling Rice Wine. Rice wine's nutritional properties include amino acids, sugars, vitamins, and minerals, making it an attractive alternative to grapes-based wines, beer, and low-alcohol beverages. The health benefits of rice wine are attributed to its fermented rice base, which is rich in rice starches and mold strains, contributing to its unusual tastes.
The market caters to the beverage business by offering a diverse range of alcoholic beverages, including those used in Asian fusion cuisine. The alcohol content in rice wine can vary, making it suitable for different consumer preferences. The taste and aroma of rice wine make it a popular choice for both cooking and as a standalone beverage. The market is expected to grow due to its unique flavor profiles and expanding consumer base seeking healthier alcoholic beverage options.
Market Segmentation
The market research report provides comprehensive data (region-wise segment analysis), with forecasts and estimates in "USD billion" for the period 2024-2028, as well as historical data from 2018 - 2022 for the following segments.
- Type
- Sake wine
- Makgeolli wine
- Others
- Distribution Channel
- Offline
- Online
- Geography
- APAC
- China
- Japan
- South Korea
- Europe
- UK
- North America
- US
- Middle East and Africa
- South America
- APAC
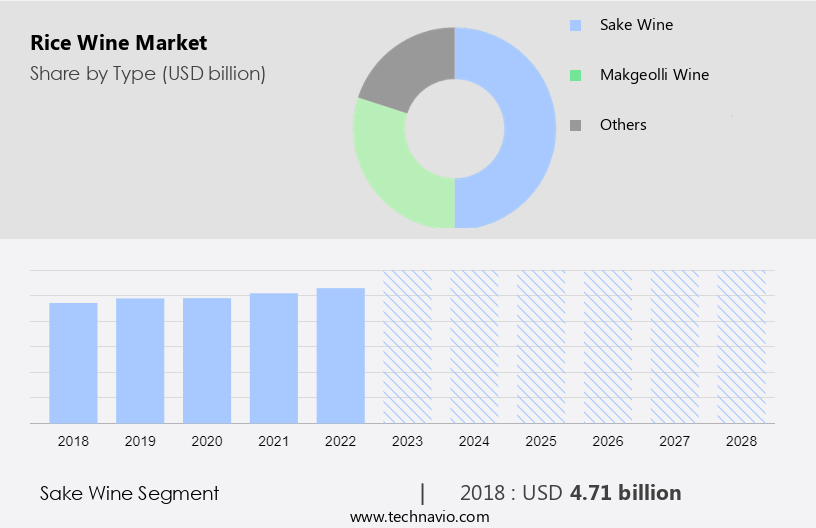
By Type Insights
The sake wine segment is estimated to witness significant growth during the forecast period. Rice wine, a significant segment of the global alcohol market, gained prominence in 2023 with sake leading the way. Sake, an alcoholic beverage with Japanese origins, is produced through the fermentation of polished rice. Its translucent hue, sweet taste, and alcohol content ranging from 14 to 16 percent make it distinct from other alcoholic beverages like grapes used for wine, beer, or yogurt sake. Sake's cultural significance is evident in its ceremonial serving, where it is warmed and served in porcelain bottles and cups. Rice wine's nutritional properties include amino acids, sugars, vitamins, and minerals. Umami flavor and low acidity contribute to its unique taste and aroma.
Furthermore, sake's health benefits include antioxidant properties and digestion benefits, making it a preference for health-conscious consumers. The NoLo movement and the non-alcoholic category have seen an influx of rice wine blends and new flavors. Traditional brewing methods preserve cultural heritage and attract tourists. Rice farmers and brewers benefit financially from this market. Red wine, rose wine, and sparkling wine are alternative alcoholic beverages, but rice wine's distinct umami flavor and cultural significance set it apart. Asian fusion cuisine and flavor combinations in Asian cooking methods further expand rice wine's applications as a beverage.
Get a glance at the market share of various segments Request Free Sample
The Sake wine segment was valued at USD 4.71 billion in 2018 and showed a gradual increase during the forecast period.
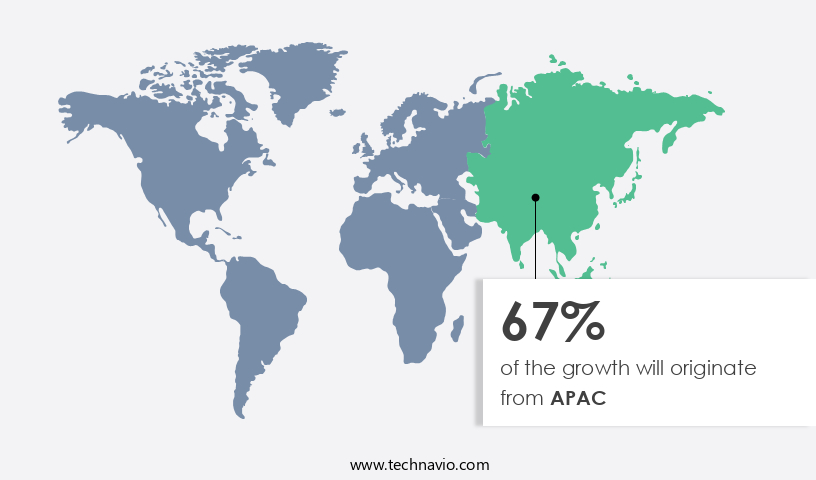
Regional Insights
APAC is estimated to contribute 67% to the growth of the global market during the forecast period. Technavio's analysts have elaborately explained the regional trends and drivers that shape the market during the forecast period.
For more insights on the market share of various regions Request Free Sample
The market in APAC is projected to experience significant growth in the Alcoholic Beverage Market during the forecast period. With a rich cultural heritage and a large consumer base, countries such as China, Japan, Taiwan, South Korea, and India are major contributors to the global market. The unique flavor profiles of Rice Wines, including Cheese, Almond, Honey, and Vanilla, have gained popularity among consumers, particularly the younger generation in China. The availability of these wines at affordable prices and their easy accessibility due to the increasing number of supermarkets are driving demand. The production of Rice Wines involves the use of Rice Starches and specific Mold Strains, which undergo careful fermentation procedures to create inventive flavor profiles.
Furthermore, the use of Organic Farming Practices further enhances the authenticity and appeal of these Fermented Rice-Based Drinks. Despite being an Alcoholic Beverage, the market is expected to witness unusual tastes and Rice Varieties, making it a distinct segment in the Beverage Business.
Our researchers analyzed the data with 2023 as the base year, along with the key drivers, trends, and challenges. A holistic analysis of drivers will help companies refine their marketing strategies to gain a competitive advantage.
Rice Wine Market Driver
Increasing use of online sales channels is the key driver of the market. The market is experiencing significant growth due to the increasing preference for alcoholic beverages with unique nutritional properties. Unlike grapes used for wine production, rice is the primary ingredient in rice wine. This alcoholic beverage shares some similarities with beer, such as the use of yeast and sugar in the fermentation process. However, rice wine boasts distinct taste and aroma profiles, with umami flavors and low acidity. Rice wine offers various health benefits, including antioxidant properties and digestion benefits, making it an attractive choice for health-conscious consumers. The NoLo movement, which highlights low-alcohol beverages, has also contributed to the growth of the market.
Furthermore, traditional brewing methods, which are deeply rooted in cultural heritage, continue to be popular, while new blends and flavors are being introduced to cater to diverse tastes. The availability of online sales channels has made rice wine more accessible to consumers worldwide. Strong online distribution channels and platform providers have enabled consumers to compare prices and make informed purchasing decisions. Asian fusion cuisine and flavor combinations have led to increased use of rice wine in cooking and as a beverage. The tourism industry, particularly in Asian countries, has also played a role in promoting rice wine consumption and boosting market growth. Rice farmers stand to benefit financially from the increasing demand for rice wine, making it a win-win situation for all stakeholders.
Rice Wine Market Trends
The growing popularity of rice wine in cocktails and cuisines is the upcoming trend in the market. The global market is experiencing significant growth due to the increasing popularity of this alcoholic beverage as an ingredient in various cocktails and cuisines. Consumers are seeking unique and intriguing flavors, leading to a rise in interest in different types of drinks, including rice wine. This versatile beverage adds a distinct umami flavor and aroma to cocktails, enhancing their taste profile. Moreover, the rising trend of Asian fusion cuisine and the growing popularity of Asian cooking methods have fueled the demand for rice wine. Rice wine shares several nutritional properties with grapes used in wine production, including amino acids, sugars, vitamins, and minerals.
Furthermore, it also offers health benefits, such as antioxidant properties and digestion benefits, making it an attractive option for health-conscious consumers. Traditional brewing methods involve fermenting rice with yeast and sugar, resulting in a beverage with a complex taste and aroma. Rice wine is not limited to traditional Asian markets but is gaining popularity worldwide. Its use in low-alcohol beverages, such as Yogurt Sake, and blends with red wine, rose wine, and sparkling wine, is expanding the product portfolio. The NoLo (no or low alcohol) movement and financial incentives for rice farmers are also driving the growth of the market. The cultural heritage and tourism potential of rice wine production in countries like China and Japan add to its allure, making it a beverage of choice for both traditional and modern consumers.
Rice Wine Market Challenge
The rising competition from other wines is a key challenge affecting the market growth. The market experiences growing competition from various alcoholic beverages, including grapes-based wines, beer, and low-alcohol beverages. These alternatives, such as red wine, rose wine, and sparkling wine, are widely accessible and popular worldwide. Additionally, imported brands of these beverages are gaining traction, potentially impacting the expansion of the market. Lack of consumer awareness regarding the nutritional properties and unique taste of rice wine, as well as its umami flavor and acidity levels, may also contribute to its decreased popularity. However, rice wine offers several health benefits, including antioxidant properties and digestion advantages, which resonate with health-conscious consumers and the NoLo movement.
Furthermore, traditional brewing methods, cultural heritage, and the use of fermented rice, yeast, sugar, and various taste and aroma combinations in Asian fusion cuisine add value to this market. Financial incentives for rice farmers and the potential for new flavor blends can also drive growth. Tourism and the appeal of rice wine in Asian cooking methods further highlight its cultural significance.
Exclusive Customer Landscape
The market forecasting report includes the adoption lifecycle of the market, covering from the innovator's stage to the laggard's stage. It focuses on adoption rates in different regions based on penetration. Furthermore, the report also includes key purchase criteria and drivers of price sensitivity to help companies evaluate and develop their market growth analysis strategies.
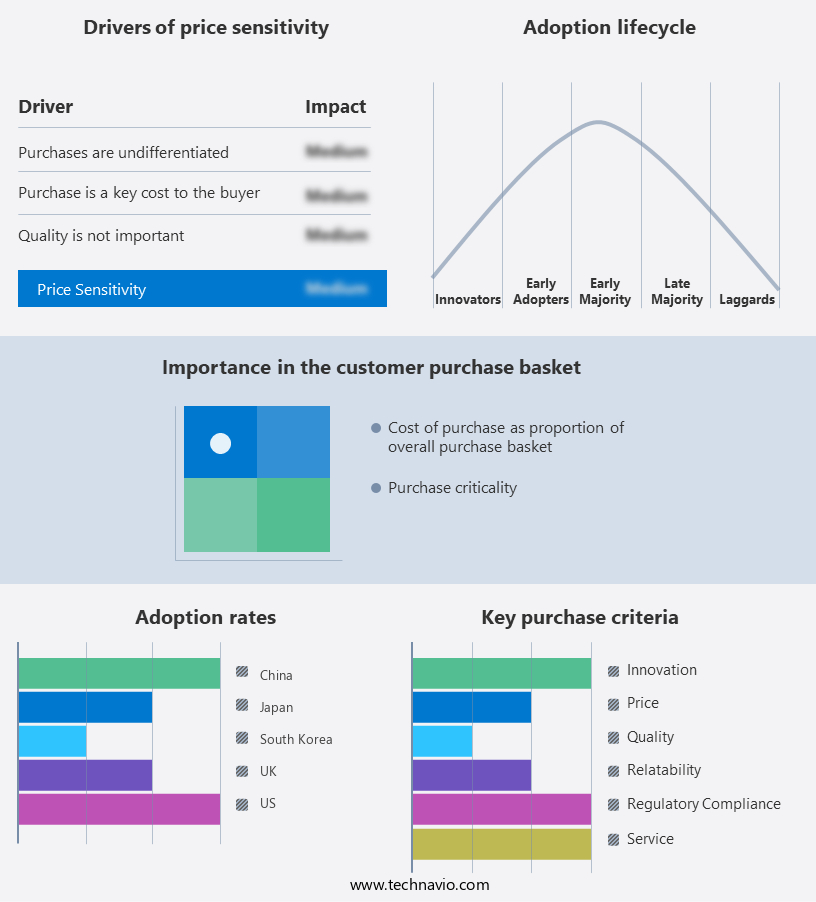
Customer Landscape
Key Companies & Market Insights
Companies are implementing various strategies, such as strategic alliances, partnerships, mergers and acquisitions, geographical expansion, and product/service launches, to enhance their presence in the market.
DEWAZAKURA SAKE BREWERY CORP.: The company offers rice wines such as Oka Ginjo, Dewasansan, and Ichiro.
The market research and growth report includes detailed analyses of the competitive landscape of the market and information about key companies, including:
- Asahi Shuzo Co. Ltd.
- Forbul Co. Ltd.
- Gekkeikan Sake Co. Ltd.
- HAKKAISAN CO. LTD.
- Hana Makgeolli
- KOKURYU SAKE BREWING CORP.
- Kooksoondang Brewery Co. Ltd.
- Kuaijishan Shaoxing Wine Co. Ltd.
- Lotte Chilsung Beverage Co. Ltd.
- Luzhou Laojiao
- Otokoyama Co. Ltd.
- Ozeki Sake Inc.
- SakeOne
- Shaanxi Xifeng Wine Co. Ltd.
- SUDOHONKE CO. LTD.
- Takagi Sake Brewery Co. Ltd.
- Takara Holdings Inc.
- YAEGAKI Corporation of USA
- Zhejiang Guyue Longshan Shaoxing Wine Co. Ltd.
Qualitative and quantitative analysis of companies has been conducted to help clients understand the wider business environment as well as the strengths and weaknesses of key market players. Data is qualitatively analyzed to categorize companies as pure play, category-focused, industry-focused, and diversified; it is quantitatively analyzed to categorize companies as dominant, leading, strong, tentative, and weak.
Research Analyst Overview
Rice wine, also known as "nipei" in Chinese or "nigori" in Japanese, is a type of alcoholic beverage made from fermented rice. Unlike grapes used for wine production, rice is the primary ingredient, yielding a unique taste and aroma. Rice wine contains various nutritional properties, including amino acids, sugars, vitamins, and minerals. Rice wine shares some similarities with alcoholic beverages like beer and red wine, rose wine, and sparkling wine. However, it offers distinct health benefits due to its umami flavor and lower acidity. Some rice wines, like Yogurt Sake, are known for their low-alcohol content, making them popular among health-conscious consumers.
Furthermore, the market is witnessing growth due to the increasing popularity of Asian fusion cuisine and its unique flavor combinations. Traditional brewing methods, cultural heritage, and tourism are also contributing factors. The nolo movement and the non-alcoholic category are creating financial incentives for rice farmers to produce rice for wine production. Rice wine's antioxidant properties and digestion benefits are attracting health-conscious consumers. New flavors and blends are being introduced to cater to evolving consumer preferences.
|
Market Scope |
|
|
Report Coverage |
Details |
|
Page number |
146 |
|
Base year |
2023 |
|
Historic period |
2018-2022 |
|
Forecast period |
2024-2028 |
|
Growth momentum & CAGR |
Accelerate at a CAGR of 4.36% |
|
Market Growth 2024-2028 |
USD 3.00 billion |
|
Market structure |
Fragmented |
|
YoY growth 2023-2024(%) |
4.22 |
|
Regional analysis |
APAC, Europe, North America, Middle East and Africa, and South America |
|
Performing market contribution |
APAC at 67% |
|
Key countries |
US, China, Japan, South Korea, and UK |
|
Competitive landscape |
Leading Companies, Market Positioning of Companies, Competitive Strategies, and Industry Risks |
|
Key companies profiled |
Asahi Shuzo Co. Ltd., DEWAZAKURA SAKE BREWERY CORP., Forbul Co. Ltd. , Gekkeikan Sake Co. Ltd., HAKKAISAN CO. LTD., Hana Makgeolli, KOKURYU SAKE BREWING CORP., Kooksoondang Brewery Co. Ltd. , Kuaijishan Shaoxing Wine Co. Ltd., Lotte Chilsung Beverage Co. Ltd., Luzhou Laojiao, Otokoyama Co. Ltd., Ozeki Sake Inc., SakeOne, Shaanxi Xifeng Wine Co. Ltd., SUDOHONKE CO. LTD., Takagi Sake Brewery Co. Ltd., Takara Holdings Inc., YAEGAKI Corporation of USA, and Zhejiang Guyue Longshan Shaoxing Wine Co. Ltd. |
|
Market dynamics |
Parent market analysis, market growth inducers and obstacles, market forecast, fast-growing and slow-growing segment analysis, COVID-19 impact and recovery analysis and future consumer dynamics, market condition analysis for the forecast period |
|
Customization purview |
If our market report has not included the data that you are looking for, you can reach out to our analysts and get segments customized. |
What are the Key Data Covered in this Market Research and Growth Report?
- CAGR of the market during the forecast period
- Detailed information on factors that will drive the market growth and forecasting between 2024 and 2028
- Precise estimation of the size of the market and its contribution of the market in focus to the parent market
- Accurate predictions about upcoming market growth and trends and changes in consumer behaviour
- Growth of the market across APAC, Europe, North America, Middle East and Africa, and South America
- Thorough analysis of the market's competitive landscape and detailed information about companies
- Comprehensive analysis of factors that will challenge the growth of market companies
We can help! Our analysts can customize this market research report to meet your requirements. Get in touch
 RIA -
RIA - 
