Robotic Process Automation (RPA) Market Size 2026-2030
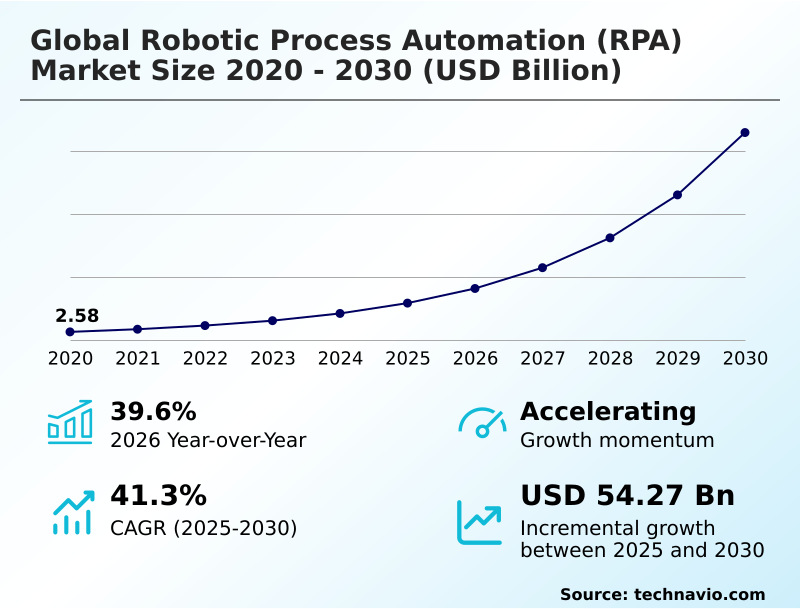
The robotic process automation (rpa) market size is valued to increase by USD 54.27 billion, at a CAGR of 41.3% from 2025 to 2030. Imperative for enhanced operational efficiency and cost optimization will drive the robotic process automation (rpa) market.
Major Market Trends & Insights
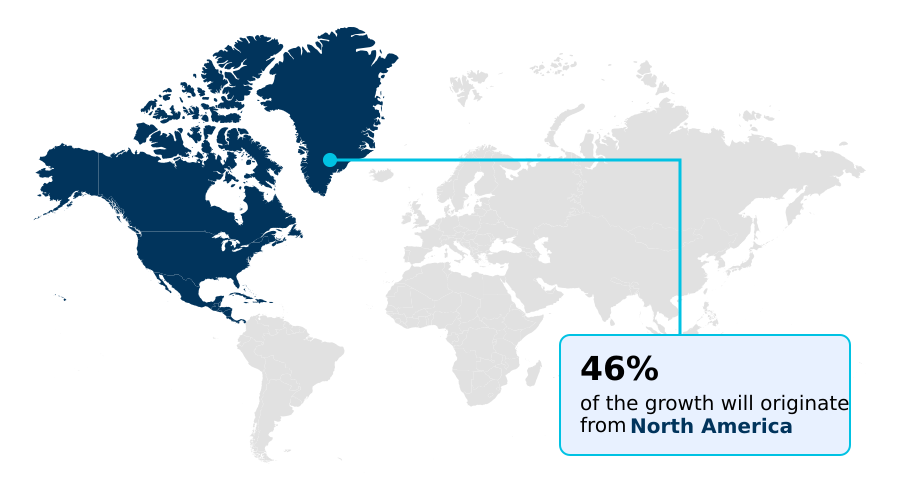
- North America dominated the market and accounted for a 45.6% growth during the forecast period.
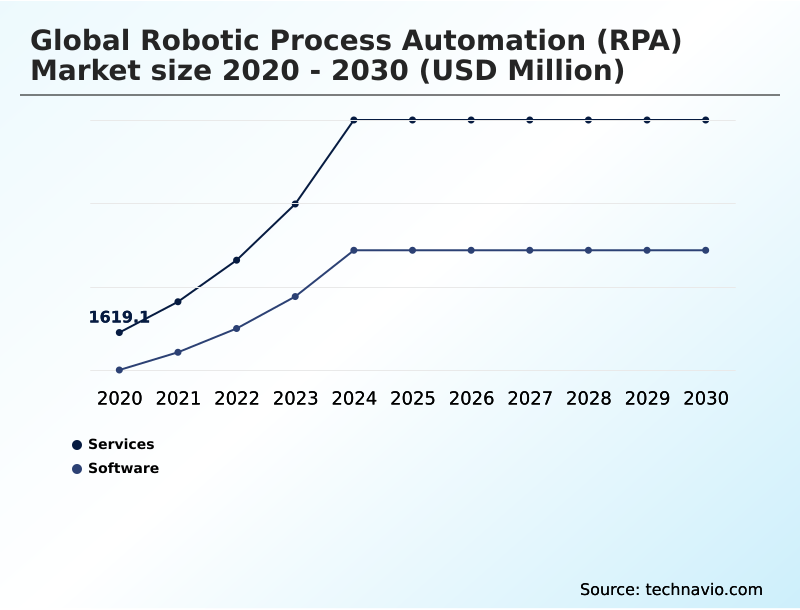
- By Type - Services segment was valued at USD 5.38 billion in 2024
- By End-user - BFSI segment accounted for the largest market revenue share in 2024
Market Size & Forecast
- Market Opportunities: USD 63.43 billion
- Market Future Opportunities: USD 54.27 billion
- CAGR from 2025 to 2030 : 41.3%
Market Summary
- The Robotic Process Automation (RPA) Market is undergoing a profound evolution, shifting from simple task automation to a strategic enabler of digital transformation. The core of this market is the deployment of a digital workforce to execute repetitive, rules-based processes, which significantly boosts operational efficiency and accuracy.
- A key driver is the technology's non-invasive nature, allowing it to work with existing legacy systems without costly integrations. In a typical financial services scenario, bots automate the reconciliation of thousands of transactions daily, reducing processing times from hours to minutes and freeing human employees for higher-value analytical work.
- Trends are moving toward intelligent automation, where RPA is augmented with AI and machine learning to handle unstructured data and make simple decisions. This convergence creates opportunities for end-to-end process automation.
- However, scaling these initiatives presents challenges, as organizations must establish robust governance frameworks and manage the complexities of a growing digital workforce to realize the technology's full potential and avoid operational risks associated with poorly managed bots. This dynamic is fostering a greater focus on strategic planning and the development of internal centers of excellence.
What will be the Size of the Robotic Process Automation (RPA) Market during the forecast period?
Get Key Insights on Market Forecast (PDF) Get Free Sample
How is the Robotic Process Automation (RPA) Market Segmented?
The robotic process automation (rpa) industry research report provides comprehensive data (region-wise segment analysis), with forecasts and estimates in "USD million" for the period 2026-2030, as well as historical data from 2020-2024 for the following segments.
- Type
- Services
- Software
- End-user
- BFSI
- IT/ITES
- Telecom
- Logistics
- Others
- Deployment
- Cloud based
- On premises
- Geography
- North America
- US
- Canada
- Mexico
- Europe
- UK
- Germany
- France
- APAC
- China
- Japan
- India
- South America
- Brazil
- Argentina
- Colombia
- Middle East and Africa
- Saudi Arabia
- UAE
- South Africa
- Rest of World (ROW)
- North America
By Type Insights
The services segment is estimated to witness significant growth during the forecast period.
The Robotic Process Automation (RPA) Market services segment is integral for translating technology into business value. Advisory services guide the strategic use of attended automation and unattended automation, while implementation services deploy ai-powered bots using techniques like business process management.
These services often leverage a low-code development platform and cloud-native rpa to ensure rapid deployment.
Advanced capabilities include intelligent document processing with optical character recognition and natural language processing to handle unstructured data, a function critical in a generative ai model.
For instance, service-led intelligent document processing implementations have shown to improve data extraction accuracy by over 30% in complex financial documents.
This comprehensive support, including the build-out of multi-agent ai systems and frameworks from an agentic ai foundation, underpins successful adoption of rpa as a service (rpaaas).
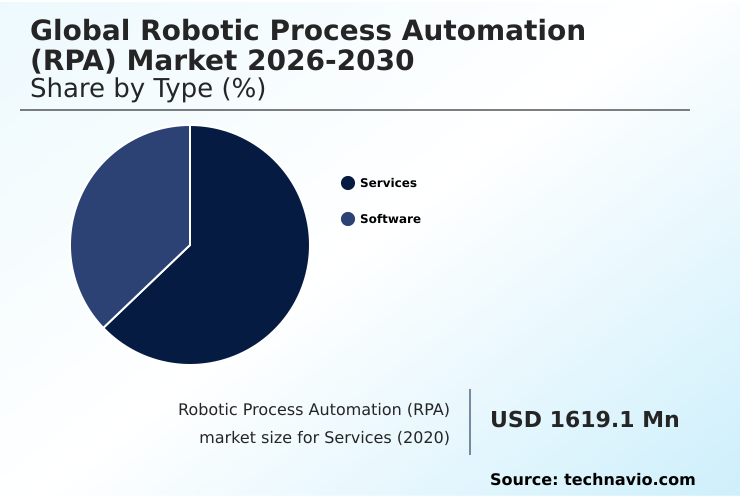
The Services segment was valued at USD 5.38 billion in 2024 and showed a gradual increase during the forecast period.
Regional Analysis
North America is estimated to contribute 45.6% to the growth of the global market during the forecast period.Technavio’s analysts have elaborately explained the regional trends and drivers that shape the market during the forecast period.
See How Robotic Process Automation (RPA) Market Demand is Rising in North America Get Free Sample
The geographic landscape of the Robotic Process Automation (RPA) Market is led by North America, which represents approximately 45.6% of the incremental growth, driven by mature adoption in sectors requiring advanced business process automation.
Meanwhile, APAC is the fastest-growing region, contributing over 23.4% to market expansion, fueled by strong smart government initiatives and a push for digital transformation strategies.
In these regions, end-to-end process orchestration using predictive analytics and workload automation on virtual machine infrastructure is becoming standard. Applications are diversifying, with logistics firms utilizing shipment scheduling automation and freight documentation management, while finance departments leverage accounts payable automation.
The implementation of process intelligence is enhancing revenue cycle management and the meter-to-cash process, demonstrating the technology's broad impact across different operational environments.
Market Dynamics
Our researchers analyzed the data with 2025 as the base year, along with the key drivers, trends, and challenges. A holistic analysis of drivers will help companies refine their marketing strategies to gain a competitive advantage.
- Enterprises are increasingly focused on rpa implementation best practices for enterprises to ensure sustainable success, moving beyond tactical deployments. Strategic discussions now weigh attended vs unattended automation use cases, with a consensus forming around building a robust rpa governance and risk management framework.
- A key component is scaling rpa with a center of excellence, which is essential for managing citizen developer programs in rpa deployment effectively. The focus is shifting to more complex challenges, such as integrating ai with rpa for cognitive tasks and addressing cloud-native rpa platform security considerations.
- As programs mature, measuring roi in robotic process automation becomes critical, with leaders achieving returns more than three times higher than initial projections. This requires a deep understanding of robotic process automation for shared services and the use of process discovery tools for rpa pipeline development.
- Use cases like rpa in manufacturing process optimization and rpa for human resources onboarding process are becoming standard. Technologically, managing bot fragility in rpa maintenance is a priority, as is leveraging natural language processing in rpa chatbots to enhance user interaction.
- Ultimately, achieving a synergy between business process management and rpa synergy is foundational to executing a successful hyperautomation strategy for digital transformation.
What are the key market drivers leading to the rise in the adoption of Robotic Process Automation (RPA) Industry?
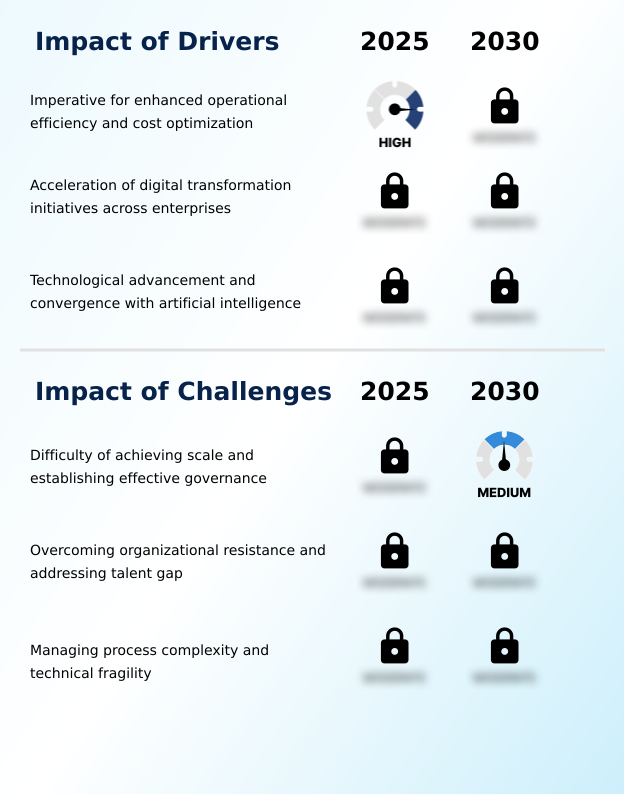
- The imperative for enhanced operational efficiency and cost optimization serves as a key driver for market growth.
- The market is primarily driven by the pursuit of operational excellence through intelligent process automation. A key enabler is the sophisticated workflow designer interface, which simplifies the software development lifecycle and reduces development time by up to 50%.
- The ability of user interface automation to interact with legacy systems, complemented by modern application programming interface integration, provides a versatile path to modernization. This is supported by a robust credential management system to ensure security.
- In IT operations, the impact is significant, with proactive monitoring and automated remediation in IT infrastructure management reducing critical incidents by 40%. The adoption of automation in IT service management has improved service level agreement compliance significantly.
- Furthermore, regression testing automation shortens release cycles, while a well-defined exception handling workflow ensures process resilience and reliability.
What are the market trends shaping the Robotic Process Automation (RPA) Industry?
- The market is witnessing a strategic shift from task-level automation to hyperautomation. This holistic approach involves orchestrating multiple technologies to automate business processes end-to-end.
- Key trends are reshaping market dynamics, moving beyond simple automation. The rise of the citizen developer model, enabled by intuitive platforms, is accelerating adoption, with organizations reporting a 25% increase in the number of automated processes deployed annually. This is managed through a formal robotic operating model governed by an automation center of excellence to ensure quality and security.
- Digital workforce orchestration is becoming more sophisticated, incorporating human-in-the-loop validation for complex decisions. Advanced process discovery tools and task mining analysis provide data-driven insights for continuous business process reengineering, leading to process optimization that improves efficiency by over 30%. Furthermore, legacy system integration is being achieved through non-invasive technology, enabling seamless digital workforce management without costly backend changes.
- This strategic approach facilitates scalable automated data entry and operational enhancements.
What challenges does the Robotic Process Automation (RPA) Industry face during its growth?
- The difficulty in achieving enterprise-wide scale while establishing effective governance remains a key challenge affecting industry growth.
- A primary challenge is managing the complexity of moving from simple rules-based task execution to deploying intelligent systems using cognitive technologies. While attended robots and unattended robots can handle many tasks, scaling requires significant process reengineering to build a resilient hyperautomation framework.
- Many initiatives stall because the automated workflow cannot handle process variations, leading to failure rates of up to 30% without manual intervention. Implementing machine learning algorithms to create an effective operational resilience strategy is complex. Furthermore, ensuring a complete audit trail creation for automated compliance reporting is a critical hurdle.
- To create a true hybrid workforce model, organizations must address these technical and governance gaps. The complexity is evident in high-volume functions like automated order processing, where exceptions can quickly overwhelm an unprepared system.
Exclusive Technavio Analysis on Customer Landscape
The robotic process automation (rpa) market forecasting report includes the adoption lifecycle of the market, covering from the innovator’s stage to the laggard’s stage. It focuses on adoption rates in different regions based on penetration. Furthermore, the robotic process automation (rpa) market report also includes key purchase criteria and drivers of price sensitivity to help companies evaluate and develop their market growth analysis strategies.

Customer Landscape of Robotic Process Automation (RPA) Industry
Competitive Landscape
Companies are implementing various strategies, such as strategic alliances, robotic process automation (rpa) market forecast, partnerships, mergers and acquisitions, geographical expansion, and product/service launches, to enhance their presence in the industry.
Accenture Plc - Offers intelligent automation solutions through a platform integrating robotic process automation with AI and analytics to streamline enterprise operations and drive transformation.
The industry research and growth report includes detailed analyses of the competitive landscape of the market and information about key companies, including:
- Accenture Plc
- Advanced Systems Concepts Inc.
- Amelia US LLC
- Atos SE
- Automation Anywhere Inc.
- Cognizant Technology Solution
- Deloitte Touche Tohmatsu Ltd.
- Genpact Ltd.
- IBM Corp.
- Infosys Ltd.
- Kofax Inc.
- Microsoft Corp.
- NICE Ltd.
- Nintex Global Ltd.
- Nippon Telegh and Teleph Corp.
- OnviSource Inc.
- Pegasystems Inc.
- SS and C Technologies Inc.
- UiPath Inc.
- WorkFusion Inc.
Qualitative and quantitative analysis of companies has been conducted to help clients understand the wider business environment as well as the strengths and weaknesses of key industry players. Data is qualitatively analyzed to categorize companies as pure play, category-focused, industry-focused, and diversified; it is quantitatively analyzed to categorize companies as dominant, leading, strong, tentative, and weak.
Recent Development and News in Robotic process automation (rpa) market
- In May, 2025, UiPath Inc. introduced a Generative AI Model Marketplace within its AI Center to accelerate enterprise AI adoption with pre-trained models for common business tasks.
- In April, 2025, Codelco advanced its major technology upgrade initiatives, with a significant focus on deploying automation and RPA to enhance operational efficiency in its mining processes.
- In February, 2025, Ethio Telecom launched a suite of cloud-based enterprise services, including a core banking solution that leverages automation to streamline operations for micro-finance institutions.
- In January, 2025, Accenture Plc released its Technology Vision 2025 report, emphasizing an emerging era of AI-powered autonomy and introducing platforms designed to accelerate the creation of specialized multi-agent AI systems for clients.
Dive into Technavio’s robust research methodology, blending expert interviews, extensive data synthesis, and validated models for unparalleled Robotic Process Automation (RPA) Market insights. See full methodology.
| Market Scope | |
|---|---|
| Page number | 314 |
| Base year | 2025 |
| Historic period | 2020-2024 |
| Forecast period | 2026-2030 |
| Growth momentum & CAGR | Accelerate at a CAGR of 41.3% |
| Market growth 2026-2030 | USD 54271.1 million |
| Market structure | Fragmented |
| YoY growth 2025-2026(%) | 39.6% |
| Key countries | US, Canada, Mexico, UK, Germany, France, Italy, Spain, The Netherlands, China, Japan, India, South Korea, Australia, Indonesia, Brazil, Argentina, Colombia, Saudi Arabia, UAE, South Africa, Israel and Turkey |
| Competitive landscape | Leading Companies, Market Positioning of Companies, Competitive Strategies, and Industry Risks |
Research Analyst Overview
- The Robotic Process Automation (RPA) Market is defined by its shift from tactical, rules-based task execution to strategic, intelligent process automation. This evolution is powered by the convergence of cognitive technologies and machine learning algorithms with core business process automation.
- A successful robotic operating model relies on a sophisticated software development lifecycle, managed through an automation center of excellence that oversees both attended automation and unattended automation. The use of a visual workflow designer interface within a low-code development platform empowers the citizen developer model. Governance is maintained via robust credential management systems and human-in-the-loop protocols for exception handling workflows.
- Advanced process discovery tools and task mining analysis inform process reengineering efforts, which is a key boardroom-level decision, as it directly impacts operational agility. For instance, firms that master process intelligence and end-to-end process orchestration have reported a 40% improvement in resource allocation.
- The technology stack, including attended robots and unattended robots, increasingly leverages intelligent document processing, optical character recognition, and natural language processing to enable a comprehensive hyperautomation framework. This is managed through digital workforce orchestration across both on-premise application programming interface integrations and virtual machine environments, which handle all workload automation.
What are the Key Data Covered in this Robotic Process Automation (RPA) Market Research and Growth Report?
-
What is the expected growth of the Robotic Process Automation (RPA) Market between 2026 and 2030?
-
USD 54.27 billion, at a CAGR of 41.3%
-
-
What segmentation does the market report cover?
-
The report is segmented by Type (Services, and Software), End-user (BFSI, IT/ITES, Telecom, Logistics, and Others), Deployment (Cloud based, and On premises) and Geography (North America, Europe, APAC, South America, Middle East and Africa)
-
-
Which regions are analyzed in the report?
-
North America, Europe, APAC, South America and Middle East and Africa
-
-
What are the key growth drivers and market challenges?
-
Imperative for enhanced operational efficiency and cost optimization, Difficulty of achieving scale and establishing effective governance
-
-
Who are the major players in the Robotic Process Automation (RPA) Market?
-
Accenture Plc, Advanced Systems Concepts Inc., Amelia US LLC, Atos SE, Automation Anywhere Inc., Cognizant Technology Solution, Deloitte Touche Tohmatsu Ltd., Genpact Ltd., IBM Corp., Infosys Ltd., Kofax Inc., Microsoft Corp., NICE Ltd., Nintex Global Ltd., Nippon Telegh and Teleph Corp., OnviSource Inc., Pegasystems Inc., SS and C Technologies Inc., UiPath Inc. and WorkFusion Inc.
-
Market Research Insights
- The market's momentum is sustained by a wide array of specialized applications. For instance, ai-powered bots are central to modern it service management, handling tasks from automated data entry to proactive monitoring and automated remediation of system issues.
- The adoption of cloud-native rpa and rpa as a service (rpaaas) has lowered entry barriers, with some firms reporting a 30% faster deployment time compared to on-premise solutions. This non-invasive technology excels at legacy system integration, a critical factor for established enterprises.
- The move toward multi-agent ai systems and generative ai models is expanding automation into knowledge work, while a focus on revenue cycle management and the meter-to-cash process is delivering measurable financial gains. With automated compliance reporting improving accuracy by over 95%, the business case for digital workforce management and holistic process optimization is clear.
We can help! Our analysts can customize this robotic process automation (rpa) market research report to meet your requirements.
 RIA -
RIA - 
