Roll To Roll Flexible Electronics Market Analysis, Size, and Forecast 2026-2030: North America (US, Canada, and Mexico), APAC (China, Japan, and India), Europe (Germany, UK, and France), South America (Brazil and Argentina), Middle East and Africa (UAE, Israel, and Saudi Arabia), and Rest of World (ROW)

Roll To Roll Flexible Electronics Market Analysis, Size, and Forecast 2026-2030:
North America (US, Canada, and Mexico), APAC (China, Japan, and India), Europe (Germany, UK, and France), South America (Brazil and Argentina), Middle East and Africa (UAE, Israel, and Saudi Arabia), and Rest of World (ROW)

Published: Jan 2026 299 Pages SKU: IRTNTR72258

Market Overview at a Glance

$5.40 B
Market Opportunity
10.4%
CAGR 2025 - 2030
38.4%
APAC Growth
$4.92 B
Consumer electronics segment 2024

Roll To Roll Flexible Electronics Market Size 2026-2030

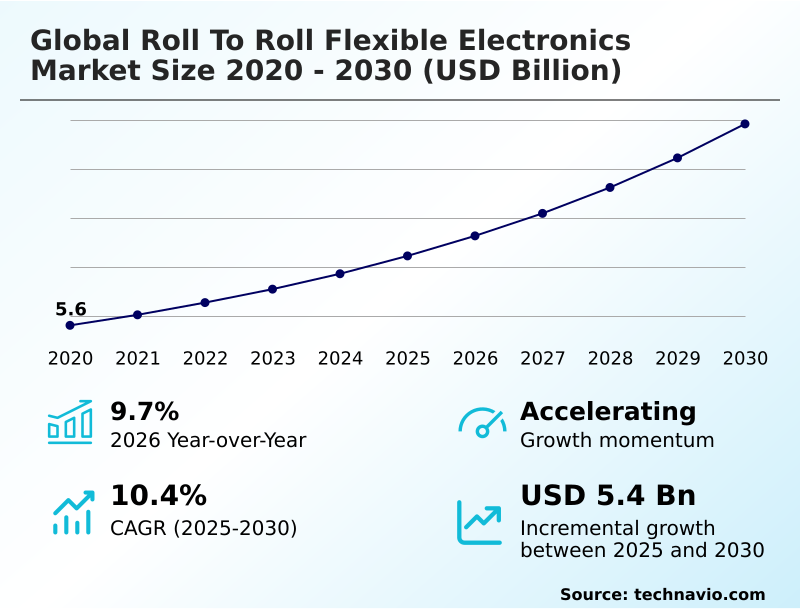
The roll to roll flexible electronics market size is valued to increase by USD 5.40 billion, at a CAGR of 10.4% from 2025 to 2030. Increasing demand for consumer electronics and wearable devices will drive the roll to roll flexible electronics market.

Major Market Trends & Insights

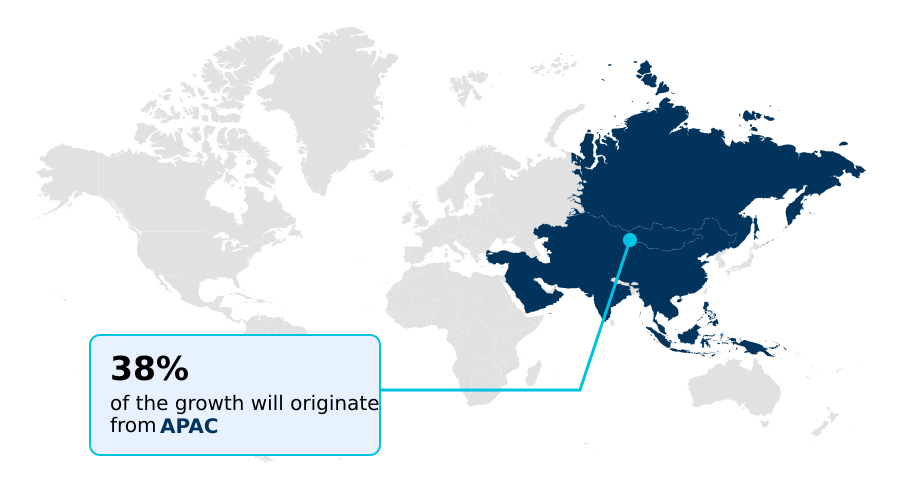
  • APAC dominated the market and accounted for a 38.4% growth during the forecast period.
  • By End-user - Consumer electronics segment was valued at USD 4.92 billion in 2024
  • By Application - Displays segment accounted for the largest market revenue share in 2024

Market Size & Forecast

  • Market Opportunities: USD 8.24 billion
  • Market Future Opportunities: USD 5.40 billion
  • CAGR from 2025 to 2030 : 10.4%

Market Summary

  • The roll to roll flexible electronics market is characterized by a move toward scalable manufacturing processes that enable high-volume fabrication of next-generation electronics. This shift is driven by demand for lightweight bendable components across sectors, including consumer devices featuring organic light emitting diode (OLED) screens and advanced automotive display applications.
  • At its core, the technology relies on roll based processing of flexible substrates, where functional materials like conductive inks and semiconductor ink formulations are applied using methods such as thin film deposition.
  • A key trend is the development of hybrid electronics systems, which merge flexible printed circuits with silicon elements to enhance performance in products requiring both flexibility and computational power.
  • For example, a medical device firm can leverage this to produce disposable biosensors for point of care testing at a scale that reduces per-unit costs by 20%, improving accessibility for remote patient monitoring. However, the industry faces challenges related to the high capital investment for advanced manufacturing infrastructure and achieving consistent yield rate improvement.
  • Overcoming these hurdles through process optimization strategies and the use of nanoscale coating solutions is essential for unlocking the full potential of large area electronics and smart packaging solutions.

What will be the Size of the Roll To Roll Flexible Electronics Market during the forecast period?

Get Key Insights on Market Forecast (PDF) Request Free Sample

How is the Roll To Roll Flexible Electronics Market Segmented?

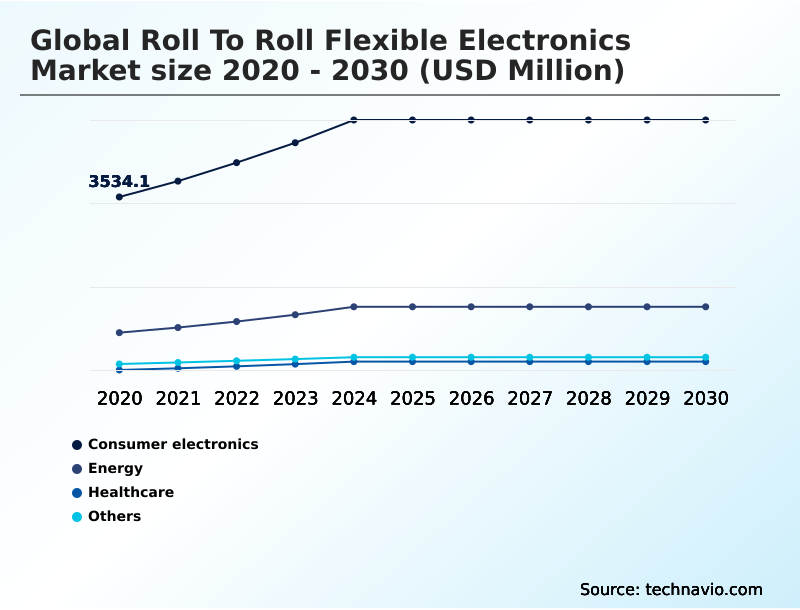
The roll to roll flexible electronics industry research report provides comprehensive data (region-wise segment analysis), with forecasts and estimates in "USD million" for the period 2026-2030, as well as historical data from 2020-2024 for the following segments.

  • End-user
    • Consumer electronics
    • Energy
    • Healthcare
    • Others
  • Application
    • Displays
    • Sensors
    • Batteries
    • Photovoltaics
    • Others
  • Material
    • Substrates
    • Inks
    • Others
  • Geography
    • North America
      • US
      • Canada
      • Mexico
    • APAC
      • China
      • Japan
      • India
    • Europe
      • Germany
      • UK
      • France
    • South America
      • Brazil
      • Argentina
    • Middle East and Africa
      • UAE
      • Israel
      • Saudi Arabia
    • Rest of World (ROW)

By End-user Insights

The consumer electronics segment is estimated to witness significant growth during the forecast period.

The consumer electronics segment is a primary adopter, driven by miniaturization trends and demand for innovative form factors. This sector leverages flexible substrates, including advanced polymer substrates, to create devices that are both durable and lightweight.

Manufacturing processes involving conductive inks and electrophoretic materials are becoming standard for displays and printed sensors. The adoption of flexible hybrid electronics is crucial for integrating complex functionalities, while techniques like atomic layer deposition enhance device longevity.

In a related development, yield rates for disposable biosensors used in point of care testing have improved by over 10%, highlighting the expanding application of these core technologies into adjacent consumer health markets such as remote patient monitoring.

Request Free Sample

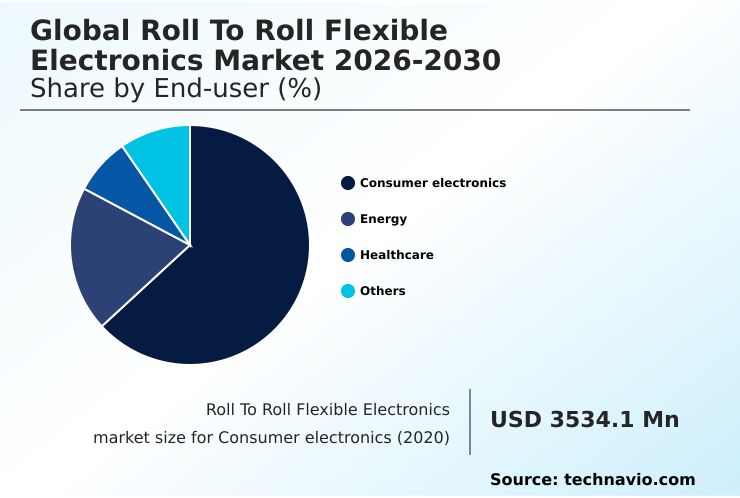
The Consumer electronics segment was valued at USD 4.92 billion in 2024 and showed a gradual increase during the forecast period.

Request Free Sample

Regional Analysis

APAC is estimated to contribute 38.4% to the growth of the global market during the forecast period.Technavio’s analysts have elaborately explained the regional trends and drivers that shape the market during the forecast period.

See How Roll To Roll Flexible Electronics Market Demand is Rising in APAC Request Free Sample

The geographic landscape is shaped by regional specialization, with APAC leading high volume fabrication at 38.4% of the opportunity share, driven by consumer electronics.

In North America, which accounts for 36.4% of the growth potential, the focus is on advanced applications like medical diagnostics integration and printed organic electronics. Innovations in electrochromic technology are enabling new smart packaging solutions and energy-efficient solutions.

European hubs are advancing large area electronics, particularly in photovoltaic cells fabrication using thin functional films.

The development of functional film layers and reliable flexible interconnects for large area film based devices is critical across all regions, supporting diverse film based electronic components and showing a market-wide year-over-year growth of 9.7%.

Market Dynamics

Our researchers analyzed the data with 2025 as the base year, along with the key drivers, trends, and challenges. A holistic analysis of drivers will help companies refine their marketing strategies to gain a competitive advantage.

  • Strategic focus is shifting toward achieving cost-effective flexible display production and enabling high throughput flexible electronics production. Key initiatives include reducing defects in r2r processing and improving yield rates in r2r to make scalable manufacturing viable. In materials science, advancements in polyimide films for flexible circuits and new formulations of conductive inks for printed electronics are critical.
  • Similarly, progress in atomic layer deposition on polymers and the development of nanoscale coatings for flexible films are enhancing device durability. Application-specific development is also accelerating. The creation of stretchable electronics for wearable tech and robust flexible pcb for automotive systems highlights this trend.
  • Other key areas include flexible electronics for medical diagnostics and the refinement of barrier films for oled displays. Manufacturing methods are also evolving, with a focus on roll based photovoltaic cell manufacturing and improved thin film transistor fabrication methods.
  • The development of functional coatings for flexible sensors, coupled with innovations like electrochromic displays via continuous printing and precision patterning for flexible electronics, is crucial. Integrating these complex systems through large area film device integration and addressing material advancements for flexible substrates ensures the market’s forward momentum.
  • For instance, firms adopting hybrid systems for iot applications report operational efficiencies nearly double those of traditional batch processing.

What are the key market drivers leading to the rise in the adoption of Roll To Roll Flexible Electronics Industry?

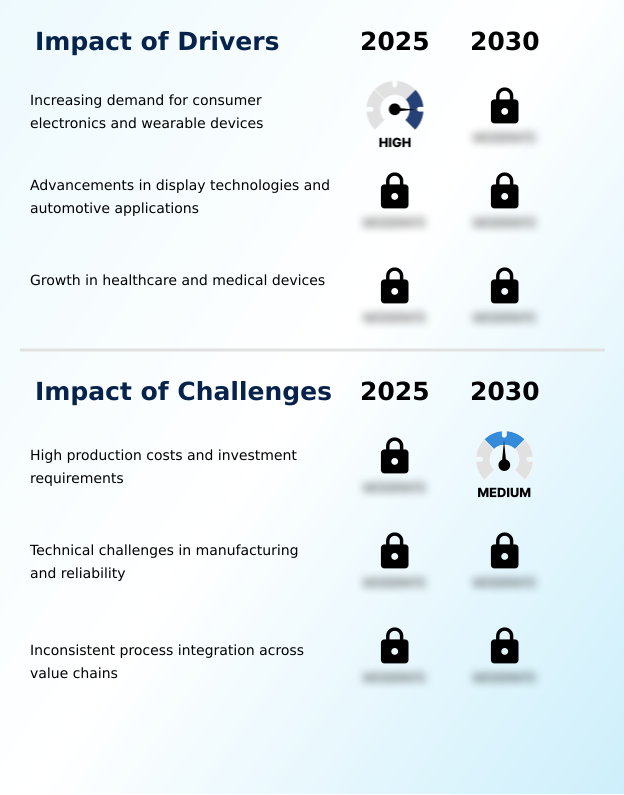
  • The increasing demand for consumer electronics and wearable devices serves as a key driver for market growth.

  • Demand for roll to roll flexible electronics is driven by the adoption of lightweight bendable components in consumer devices.
  • Scalable manufacturing processes enable the cost-effective production of flexible printed circuits and organic light emitting diode (OLED) screens, with roll based processing increasing throughput by up to 25%.
  • Advanced material properties are enhancing the performance of printed electronic components, including flexible antennas for improved connectivity. In automotive display applications, functional coatings are essential for protecting high-resolution screens while maintaining flexibility.
  • These innovations contribute to devices with prolonged battery life, showing energy efficiency gains of 12% compared to conventional counterparts.

What are the market trends shaping the Roll To Roll Flexible Electronics Industry?

  • The integration of hybrid electronics systems is emerging as a prominent market trend. This approach combines printed flexible components with conventional silicon-based elements to enhance functionality.

  • The integration of hybrid electronics systems represents a significant shift, enabling next-generation electronics with advanced capabilities. This approach combines thin film transistors with conformable electronic layers, fostering innovation in stretchable electronics and printed display solutions. Process optimization strategies are critical, improving yield rate improvement by over 15% in some pilot lines.
  • Manufacturers are refining precision die cutting techniques for multilayer flexible circuits and developing new functional inks to support complex wearable device integration. These advancements are crucial for the internet of things ecosystems, where performance and form factor are paramount, leading to a 10% reduction in component-level defects.

What challenges does the Roll To Roll Flexible Electronics Industry face during its growth?

  • High production costs and significant investment requirements present a key challenge affecting the industry's growth trajectory.

  • Achieving cost-effective production in high-throughput manufacturing remains a central challenge, primarily due to the capital-intensive nature of advanced manufacturing infrastructure. The complexity of continuous roll based processing, including thin film deposition and precision patterning techniques, requires significant investment in digital manufacturing systems. While vacuum deposition systems offer high quality, their operational costs can be prohibitive.
  • Developing stable semiconductor ink formulations and effective nanoscale coating solutions is crucial for reliable flexible circuit assembly. Adopting sustainable manufacturing processes helps mitigate these costs, with some facilities achieving a 15% reduction in material waste, but integrating these methods without compromising performance remains a key hurdle for the industry.

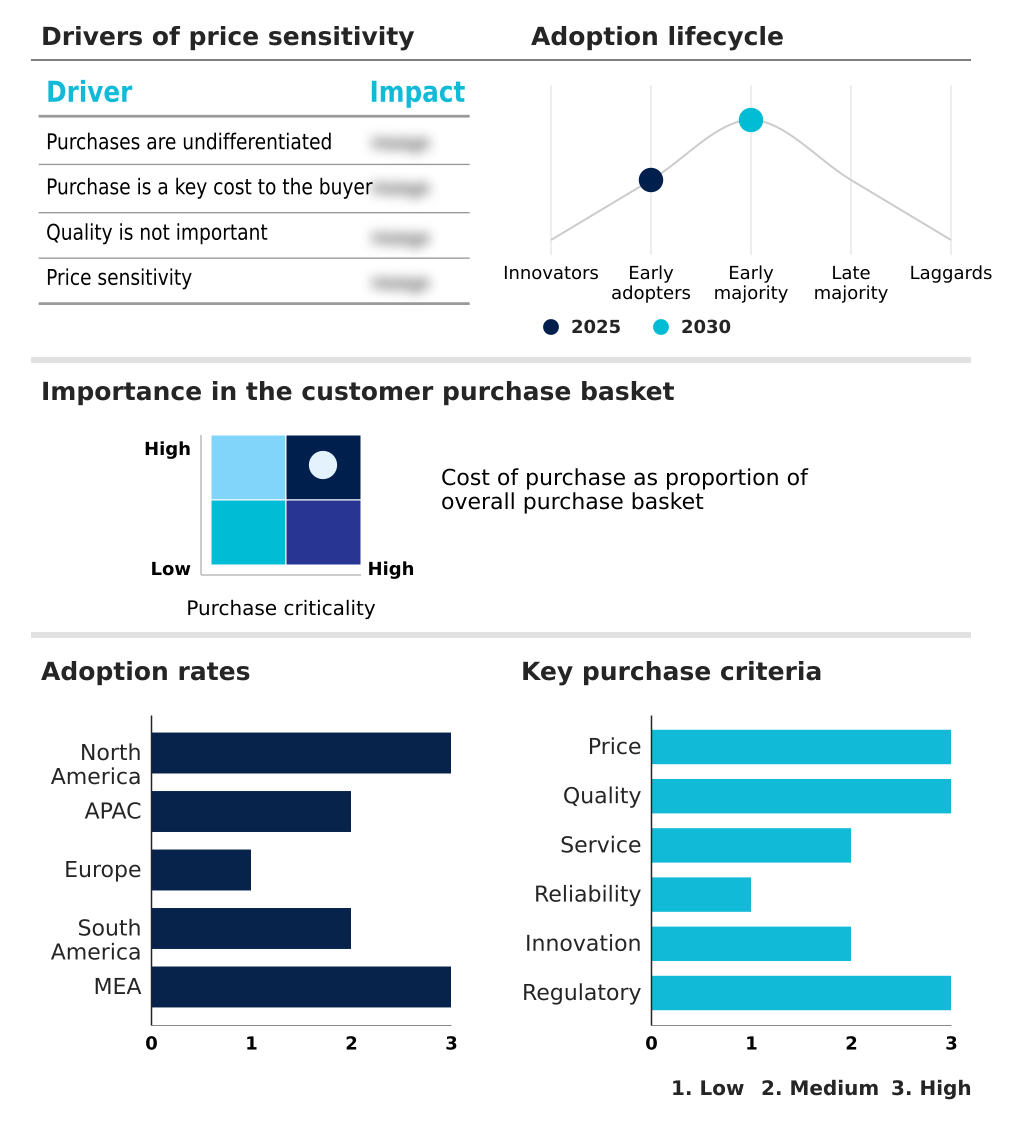
Exclusive Technavio Analysis on Customer Landscape

The roll to roll flexible electronics market forecasting report includes the adoption lifecycle of the market, covering from the innovator’s stage to the laggard’s stage. It focuses on adoption rates in different regions based on penetration. Furthermore, the roll to roll flexible electronics market report also includes key purchase criteria and drivers of price sensitivity to help companies evaluate and develop their market growth analysis strategies.

Customer Landscape of Roll To Roll Flexible Electronics Industry

Competitive Landscape

Companies are implementing various strategies, such as strategic alliances, roll to roll flexible electronics market forecast, partnerships, mergers and acquisitions, geographical expansion, and product/service launches, to enhance their presence in the industry.

3M Co. - Provides essential materials and assembly components, including polymer films and adhesives, facilitating scalable manufacturing for flexible circuits, sensors, and printed electronic applications.

The industry research and growth report includes detailed analyses of the competitive landscape of the market and information about key companies, including:

  • 3M Co.
  • Applied Materials Inc.
  • BASF SE
  • DuPont de Nemours Inc.
  • E Ink Holdings Inc.
  • Forge Nano Inc.
  • Fujikura Co. Ltd.
  • Henkel AG and Co. KGaA
  • LG Electronics Inc.
  • Marian Inc.
  • Molex LLC
  • Multek Corp.
  • Nissha Co. Ltd.
  • Sumitomo Electric Industries
  • Ynvisible Interactive Inc

Qualitative and quantitative analysis of companies has been conducted to help clients understand the wider business environment as well as the strengths and weaknesses of key industry players. Data is qualitatively analyzed to categorize companies as pure play, category-focused, industry-focused, and diversified; it is quantitatively analyzed to categorize companies as dominant, leading, strong, tentative, and weak.

Recent Development and News in Roll to roll flexible electronics market

  • In February 2025, DuPont announced advancements in high-performance polyimide films designed for flexible electronics manufacturing, emphasizing improved thermal stability and mechanical durability to support continuous roll-based processing.
  • In March 2025, Applied Materials expanded its advanced materials engineering operations in the US, focusing on web coating and flexible electronics manufacturing platforms with enhanced process analytics and automation.
  • In April 2025, E Ink unveiled its Marquee technology, a four-particle color system that delivers vibrant, energy-efficient displays with extended temperature ranges suitable for outdoor and wearable applications.
  • In January 2025, Henkel expanded its manufacturing facility in South Dakota, targeting electric vehicle and electronics innovations with advanced adhesives for flexible components.

Dive into Technavio’s robust research methodology, blending expert interviews, extensive data synthesis, and validated models for unparalleled Roll To Roll Flexible Electronics Market insights. See full methodology.

Market Scope
Page number 299
Base year 2025
Historic period 2020-2024
Forecast period 2026-2030
Growth momentum & CAGR Accelerate at a CAGR of 10.4%
Market growth 2026-2030 USD 5402.6 million
Market structure Fragmented
YoY growth 2025-2026(%) 9.7%
Key countries US, Canada, Mexico, China, Japan, India, South Korea, Indonesia, Australia, Germany, UK, France, Italy, Spain, The Netherlands, Brazil, Argentina, Chile, UAE, Israel, Saudi Arabia, South Africa and Turkey
Competitive landscape Leading Companies, Market Positioning of Companies, Competitive Strategies, and Industry Risks

Request Free Sample

Research Analyst Overview

  • The roll to roll flexible electronics market is defined by rapid material and process innovation. Core technologies include roll based processing and continuous roll based processing for fabricating components like flexible printed circuits, flexible hybrid electronics, and printed electronic components on flexible substrates, often polymer substrates.
  • Key materials such as conductive inks, functional inks, electrophoretic materials, and semiconductor ink formulations are applied through thin film deposition and atomic layer deposition. Systems use vacuum deposition systems and precision patterning techniques for creating thin film transistors and functional film layers.
  • Products range from printed display solutions, including organic light emitting diode (OLED) and those using electrochromic technology, to printed sensors, flexible antennas, and stretchable electronics. Assembly relies on flexible interconnects, precision die cutting, and advanced flexible circuit assembly. Innovations in high performance polyimide films, nanoscale coating solutions, and functional coatings enhance durability.
  • This technological convergence enables large area film based devices, film based electronic components, and multilayer flexible circuits, impacting boardroom decisions on product roadmaps, where a shift to flexible formats can reduce component weight by 40%.

What are the Key Data Covered in this Roll To Roll Flexible Electronics Market Research and Growth Report?

  • What is the expected growth of the Roll To Roll Flexible Electronics Market between 2026 and 2030?

    • USD 5.40 billion, at a CAGR of 10.4%

  • What segmentation does the market report cover?

    • The report is segmented by End-user (Consumer electronics, Energy, Healthcare, and Others), Application (Displays, Sensors, Batteries, Photovoltaics, and Others), Material (Substrates, Inks, and Others) and Geography (North America, APAC, Europe, South America, Middle East and Africa)

  • Which regions are analyzed in the report?

    • North America, APAC, Europe, South America and Middle East and Africa

  • What are the key growth drivers and market challenges?

    • Increasing demand for consumer electronics and wearable devices, High production costs and investment requirements

  • Who are the major players in the Roll To Roll Flexible Electronics Market?

    • 3M Co., Applied Materials Inc., BASF SE, DuPont de Nemours Inc., E Ink Holdings Inc., Forge Nano Inc., Fujikura Co. Ltd., Henkel AG and Co. KGaA, LG Electronics Inc., Marian Inc., Molex LLC, Multek Corp., Nissha Co. Ltd., Sumitomo Electric Industries and Ynvisible Interactive Inc

Market Research Insights

  • Market dynamics are shaped by the convergence of high-throughput manufacturing and demand for lightweight bendable components. The integration into automotive display applications and smart packaging solutions is accelerating, with adoption rates in these sectors increasing by over 15% annually. Scalable manufacturing processes are crucial, enabling cost-effective production and a notable 10% reduction in material waste.
  • Advanced material properties are central to creating energy-efficient solutions with prolonged battery life, supporting the expansion of internet of things ecosystems. Innovations in flexible display technologies are meeting demand for high-resolution screens. This evolution, supported by a robust advanced manufacturing infrastructure and digital manufacturing systems, is driving miniaturization trends across all end-user segments, from medical diagnostics integration to next-generation electronics.

We can help! Our analysts can customize this roll to roll flexible electronics market research report to meet your requirements.

Get in touch

1. Executive Summary

1.1 Market overview

Executive Summary - Chart on Market Overview
Executive Summary - Data Table on Market Overview
Executive Summary - Chart on Global Market Characteristics
Executive Summary - Chart on Market by Geography
Executive Summary - Chart on Market Segmentation by End-user
Executive Summary - Chart on Market Segmentation by Application
Executive Summary - Chart on Market Segmentation by Material
Executive Summary - Chart on Incremental Growth
Executive Summary - Data Table on Incremental Growth
Executive Summary - Chart on Company Market Positioning

2. Technavio Analysis

2.1 Analysis of price sensitivity, lifecycle, customer purchase basket, adoption rates, and purchase criteria

2.2 Criticality of inputs and Factors of differentiation

Chart on Overview on criticality of inputs and factors of differentiation

2.3 Factors of disruption

Chart on Overview on factors of disruption

2.4 Impact of drivers and challenges

Chart on Impact of drivers and challenges in 2025 and 2030

3. Market Landscape

3.1 Market ecosystem

Chart on Parent Market
Data Table on - Parent Market

3.2 Market characteristics

Chart on Market characteristics analysis

3.3 Value chain analysis

Chart on Value chain analysis

4. Market Sizing

4.1 Market definition

Data Table on Offerings of companies included in the market definition

4.2 Market segment analysis

Market segments

4.3 Market size 2025

4.4 Market outlook: Forecast for 2025-2030

Chart on Global - Market size and forecast 2025-2030 ($ million)
Data Table on Global - Market size and forecast 2025-2030 ($ million)
Chart on Global Market: Year-over-year growth 2025-2030 (%)
Data Table on Global Market: Year-over-year growth 2025-2030 (%)

5. Historic Market Size

5.1 Global Roll To Roll Flexible Electronics Market 2020 - 2024

Historic Market Size - Data Table on Global Roll To Roll Flexible Electronics Market 2020 - 2024 ($ million)

5.2 End-user segment analysis 2020 - 2024

Historic Market Size - End-user Segment 2020 - 2024 ($ million)

5.3 Application segment analysis 2020 - 2024

Historic Market Size - Application Segment 2020 - 2024 ($ million)

5.4 Material segment analysis 2020 - 2024

Historic Market Size - Material Segment 2020 - 2024 ($ million)

5.5 Geography segment analysis 2020 - 2024

Historic Market Size - Geography Segment 2020 - 2024 ($ million)

5.6 Country segment analysis 2020 - 2024

Historic Market Size - Country Segment 2020 - 2024 ($ million)

6. Qualitative Analysis

6.1 Impact of AI in Global Roll to Roll Flexible Electronics Market

7. Five Forces Analysis

7.1 Five forces summary

Five forces analysis - Comparison between 2025 and 2030

7.2 Bargaining power of buyers

Bargaining power of buyers - Impact of key factors 2025 and 2030

7.3 Bargaining power of suppliers

Bargaining power of suppliers - Impact of key factors in 2025 and 2030

7.4 Threat of new entrants

Threat of new entrants - Impact of key factors in 2025 and 2030

7.5 Threat of substitutes

Threat of substitutes - Impact of key factors in 2025 and 2030

7.6 Threat of rivalry

Threat of rivalry - Impact of key factors in 2025 and 2030

7.7 Market condition

Chart on Market condition - Five forces 2025 and 2030

8. Market Segmentation by End-user

8.1 Market segments

Chart on End-user - Market share 2025-2030 (%)
Data Table on End-user - Market share 2025-2030 (%)

8.2 Comparison by End-user

Chart on Comparison by End-user
Data Table on Comparison by End-user

8.3 Consumer electronics - Market size and forecast 2025-2030

Chart on Consumer electronics - Market size and forecast 2025-2030 ($ million)
Data Table on Consumer electronics - Market size and forecast 2025-2030 ($ million)
Chart on Consumer electronics - Year-over-year growth 2025-2030 (%)
Data Table on Consumer electronics - Year-over-year growth 2025-2030 (%)

8.4 Energy - Market size and forecast 2025-2030

Chart on Energy - Market size and forecast 2025-2030 ($ million)
Data Table on Energy - Market size and forecast 2025-2030 ($ million)
Chart on Energy - Year-over-year growth 2025-2030 (%)
Data Table on Energy - Year-over-year growth 2025-2030 (%)

8.5 Healthcare - Market size and forecast 2025-2030

Chart on Healthcare - Market size and forecast 2025-2030 ($ million)
Data Table on Healthcare - Market size and forecast 2025-2030 ($ million)
Chart on Healthcare - Year-over-year growth 2025-2030 (%)
Data Table on Healthcare - Year-over-year growth 2025-2030 (%)

8.6 Others - Market size and forecast 2025-2030

Chart on Others - Market size and forecast 2025-2030 ($ million)
Data Table on Others - Market size and forecast 2025-2030 ($ million)
Chart on Others - Year-over-year growth 2025-2030 (%)
Data Table on Others - Year-over-year growth 2025-2030 (%)

8.7 Market opportunity by End-user

Market opportunity by End-user ($ million)
Data Table on Market opportunity by End-user ($ million)

9. Market Segmentation by Application

9.1 Market segments

Chart on Application - Market share 2025-2030 (%)
Data Table on Application - Market share 2025-2030 (%)

9.2 Comparison by Application

Chart on Comparison by Application
Data Table on Comparison by Application

9.3 Displays - Market size and forecast 2025-2030

Chart on Displays - Market size and forecast 2025-2030 ($ million)
Data Table on Displays - Market size and forecast 2025-2030 ($ million)
Chart on Displays - Year-over-year growth 2025-2030 (%)
Data Table on Displays - Year-over-year growth 2025-2030 (%)

9.4 Sensors - Market size and forecast 2025-2030

Chart on Sensors - Market size and forecast 2025-2030 ($ million)
Data Table on Sensors - Market size and forecast 2025-2030 ($ million)
Chart on Sensors - Year-over-year growth 2025-2030 (%)
Data Table on Sensors - Year-over-year growth 2025-2030 (%)

9.5 Batteries - Market size and forecast 2025-2030

Chart on Batteries - Market size and forecast 2025-2030 ($ million)
Data Table on Batteries - Market size and forecast 2025-2030 ($ million)
Chart on Batteries - Year-over-year growth 2025-2030 (%)
Data Table on Batteries - Year-over-year growth 2025-2030 (%)

9.6 Photovoltaics - Market size and forecast 2025-2030

Chart on Photovoltaics - Market size and forecast 2025-2030 ($ million)
Data Table on Photovoltaics - Market size and forecast 2025-2030 ($ million)
Chart on Photovoltaics - Year-over-year growth 2025-2030 (%)
Data Table on Photovoltaics - Year-over-year growth 2025-2030 (%)

9.7 Others - Market size and forecast 2025-2030

Chart on Others - Market size and forecast 2025-2030 ($ million)
Data Table on Others - Market size and forecast 2025-2030 ($ million)
Chart on Others - Year-over-year growth 2025-2030 (%)
Data Table on Others - Year-over-year growth 2025-2030 (%)

9.8 Market opportunity by Application

Market opportunity by Application ($ million)
Data Table on Market opportunity by Application ($ million)

10. Market Segmentation by Material

10.1 Market segments

Chart on Material - Market share 2025-2030 (%)
Data Table on Material - Market share 2025-2030 (%)

10.2 Comparison by Material

Chart on Comparison by Material
Data Table on Comparison by Material

10.3 Substrates - Market size and forecast 2025-2030

Chart on Substrates - Market size and forecast 2025-2030 ($ million)
Data Table on Substrates - Market size and forecast 2025-2030 ($ million)
Chart on Substrates - Year-over-year growth 2025-2030 (%)
Data Table on Substrates - Year-over-year growth 2025-2030 (%)

10.4 Inks - Market size and forecast 2025-2030

Chart on Inks - Market size and forecast 2025-2030 ($ million)
Data Table on Inks - Market size and forecast 2025-2030 ($ million)
Chart on Inks - Year-over-year growth 2025-2030 (%)
Data Table on Inks - Year-over-year growth 2025-2030 (%)

10.5 Others - Market size and forecast 2025-2030

Chart on Others - Market size and forecast 2025-2030 ($ million)
Data Table on Others - Market size and forecast 2025-2030 ($ million)
Chart on Others - Year-over-year growth 2025-2030 (%)
Data Table on Others - Year-over-year growth 2025-2030 (%)

10.6 Market opportunity by Material

Market opportunity by Material ($ million)
Data Table on Market opportunity by Material ($ million)

11. Customer Landscape

11.1 Customer landscape overview

Analysis of price sensitivity, lifecycle, customer purchase basket, adoption rates, and purchase criteria

12. Geographic Landscape

12.1 Geographic segmentation

Chart on Market share by geography 2025-2030 (%)
Data Table on Market share by geography 2025-2030 (%)

12.2 Geographic comparison

Chart on Geographic comparison
Data Table on Geographic comparison

12.3 North America - Market size and forecast 2025-2030

Chart on North America - Market size and forecast 2025-2030 ($ million)
Data Table on North America - Market size and forecast 2025-2030 ($ million)
Chart on North America - Year-over-year growth 2025-2030 (%)
Data Table on North America - Year-over-year growth 2025-2030 (%)
Chart on Regional Comparison - North America
Data Table on Regional Comparison - North America

12.3.1 US - Market size and forecast 2025-2030

Chart on US - Market size and forecast 2025-2030 ($ million)
Data Table on US - Market size and forecast 2025-2030 ($ million)
Chart on US - Year-over-year growth 2025-2030 (%)
Data Table on US - Year-over-year growth 2025-2030 (%)

12.3.2 Canada - Market size and forecast 2025-2030

Chart on Canada - Market size and forecast 2025-2030 ($ million)
Data Table on Canada - Market size and forecast 2025-2030 ($ million)
Chart on Canada - Year-over-year growth 2025-2030 (%)
Data Table on Canada - Year-over-year growth 2025-2030 (%)

12.3.3 Mexico - Market size and forecast 2025-2030

Chart on Mexico - Market size and forecast 2025-2030 ($ million)
Data Table on Mexico - Market size and forecast 2025-2030 ($ million)
Chart on Mexico - Year-over-year growth 2025-2030 (%)
Data Table on Mexico - Year-over-year growth 2025-2030 (%)

12.4 APAC - Market size and forecast 2025-2030

Chart on APAC - Market size and forecast 2025-2030 ($ million)
Data Table on APAC - Market size and forecast 2025-2030 ($ million)
Chart on APAC - Year-over-year growth 2025-2030 (%)
Data Table on APAC - Year-over-year growth 2025-2030 (%)
Chart on Regional Comparison - APAC
Data Table on Regional Comparison - APAC

12.4.1 China - Market size and forecast 2025-2030

Chart on China - Market size and forecast 2025-2030 ($ million)
Data Table on China - Market size and forecast 2025-2030 ($ million)
Chart on China - Year-over-year growth 2025-2030 (%)
Data Table on China - Year-over-year growth 2025-2030 (%)

12.4.2 Japan - Market size and forecast 2025-2030

Chart on Japan - Market size and forecast 2025-2030 ($ million)
Data Table on Japan - Market size and forecast 2025-2030 ($ million)
Chart on Japan - Year-over-year growth 2025-2030 (%)
Data Table on Japan - Year-over-year growth 2025-2030 (%)

12.4.3 India - Market size and forecast 2025-2030

Chart on India - Market size and forecast 2025-2030 ($ million)
Data Table on India - Market size and forecast 2025-2030 ($ million)
Chart on India - Year-over-year growth 2025-2030 (%)
Data Table on India - Year-over-year growth 2025-2030 (%)

12.4.4 South Korea - Market size and forecast 2025-2030

Chart on South Korea - Market size and forecast 2025-2030 ($ million)
Data Table on South Korea - Market size and forecast 2025-2030 ($ million)
Chart on South Korea - Year-over-year growth 2025-2030 (%)
Data Table on South Korea - Year-over-year growth 2025-2030 (%)

12.4.5 Indonesia - Market size and forecast 2025-2030

Chart on Indonesia - Market size and forecast 2025-2030 ($ million)
Data Table on Indonesia - Market size and forecast 2025-2030 ($ million)
Chart on Indonesia - Year-over-year growth 2025-2030 (%)
Data Table on Indonesia - Year-over-year growth 2025-2030 (%)

12.4.6 Australia - Market size and forecast 2025-2030

Chart on Australia - Market size and forecast 2025-2030 ($ million)
Data Table on Australia - Market size and forecast 2025-2030 ($ million)
Chart on Australia - Year-over-year growth 2025-2030 (%)
Data Table on Australia - Year-over-year growth 2025-2030 (%)

12.5 Europe - Market size and forecast 2025-2030

Chart on Europe - Market size and forecast 2025-2030 ($ million)
Data Table on Europe - Market size and forecast 2025-2030 ($ million)
Chart on Europe - Year-over-year growth 2025-2030 (%)
Data Table on Europe - Year-over-year growth 2025-2030 (%)
Chart on Regional Comparison - Europe
Data Table on Regional Comparison - Europe

12.5.1 Germany - Market size and forecast 2025-2030

Chart on Germany - Market size and forecast 2025-2030 ($ million)
Data Table on Germany - Market size and forecast 2025-2030 ($ million)
Chart on Germany - Year-over-year growth 2025-2030 (%)
Data Table on Germany - Year-over-year growth 2025-2030 (%)

12.5.2 UK - Market size and forecast 2025-2030

Chart on UK - Market size and forecast 2025-2030 ($ million)
Data Table on UK - Market size and forecast 2025-2030 ($ million)
Chart on UK - Year-over-year growth 2025-2030 (%)
Data Table on UK - Year-over-year growth 2025-2030 (%)

12.5.3 France - Market size and forecast 2025-2030

Chart on France - Market size and forecast 2025-2030 ($ million)
Data Table on France - Market size and forecast 2025-2030 ($ million)
Chart on France - Year-over-year growth 2025-2030 (%)
Data Table on France - Year-over-year growth 2025-2030 (%)

12.5.4 Italy - Market size and forecast 2025-2030

Chart on Italy - Market size and forecast 2025-2030 ($ million)
Data Table on Italy - Market size and forecast 2025-2030 ($ million)
Chart on Italy - Year-over-year growth 2025-2030 (%)
Data Table on Italy - Year-over-year growth 2025-2030 (%)

12.5.5 Spain - Market size and forecast 2025-2030

Chart on Spain - Market size and forecast 2025-2030 ($ million)
Data Table on Spain - Market size and forecast 2025-2030 ($ million)
Chart on Spain - Year-over-year growth 2025-2030 (%)
Data Table on Spain - Year-over-year growth 2025-2030 (%)

12.5.6 The Netherlands - Market size and forecast 2025-2030

Chart on The Netherlands - Market size and forecast 2025-2030 ($ million)
Data Table on The Netherlands - Market size and forecast 2025-2030 ($ million)
Chart on The Netherlands - Year-over-year growth 2025-2030 (%)
Data Table on The Netherlands - Year-over-year growth 2025-2030 (%)

12.6 South America - Market size and forecast 2025-2030

Chart on South America - Market size and forecast 2025-2030 ($ million)
Data Table on South America - Market size and forecast 2025-2030 ($ million)
Chart on South America - Year-over-year growth 2025-2030 (%)
Data Table on South America - Year-over-year growth 2025-2030 (%)
Chart on Regional Comparison - South America
Data Table on Regional Comparison - South America

12.6.1 Brazil - Market size and forecast 2025-2030

Chart on Brazil - Market size and forecast 2025-2030 ($ million)
Data Table on Brazil - Market size and forecast 2025-2030 ($ million)
Chart on Brazil - Year-over-year growth 2025-2030 (%)
Data Table on Brazil - Year-over-year growth 2025-2030 (%)

12.6.2 Argentina - Market size and forecast 2025-2030

Chart on Argentina - Market size and forecast 2025-2030 ($ million)
Data Table on Argentina - Market size and forecast 2025-2030 ($ million)
Chart on Argentina - Year-over-year growth 2025-2030 (%)
Data Table on Argentina - Year-over-year growth 2025-2030 (%)

12.6.3 Chile - Market size and forecast 2025-2030

Chart on Chile - Market size and forecast 2025-2030 ($ million)
Data Table on Chile - Market size and forecast 2025-2030 ($ million)
Chart on Chile - Year-over-year growth 2025-2030 (%)
Data Table on Chile - Year-over-year growth 2025-2030 (%)

12.7 Middle East and Africa - Market size and forecast 2025-2030

Chart on Middle East and Africa - Market size and forecast 2025-2030 ($ million)
Data Table on Middle East and Africa - Market size and forecast 2025-2030 ($ million)
Chart on Middle East and Africa - Year-over-year growth 2025-2030 (%)
Data Table on Middle East and Africa - Year-over-year growth 2025-2030 (%)
Chart on Regional Comparison - Middle East and Africa
Data Table on Regional Comparison - Middle East and Africa

12.7.1 UAE - Market size and forecast 2025-2030

Chart on UAE - Market size and forecast 2025-2030 ($ million)
Data Table on UAE - Market size and forecast 2025-2030 ($ million)
Chart on UAE - Year-over-year growth 2025-2030 (%)
Data Table on UAE - Year-over-year growth 2025-2030 (%)

12.7.2 Israel - Market size and forecast 2025-2030

Chart on Israel - Market size and forecast 2025-2030 ($ million)
Data Table on Israel - Market size and forecast 2025-2030 ($ million)
Chart on Israel - Year-over-year growth 2025-2030 (%)
Data Table on Israel - Year-over-year growth 2025-2030 (%)

12.7.3 Saudi Arabia - Market size and forecast 2025-2030

Chart on Saudi Arabia - Market size and forecast 2025-2030 ($ million)
Data Table on Saudi Arabia - Market size and forecast 2025-2030 ($ million)
Chart on Saudi Arabia - Year-over-year growth 2025-2030 (%)
Data Table on Saudi Arabia - Year-over-year growth 2025-2030 (%)

12.7.4 South Africa - Market size and forecast 2025-2030

Chart on South Africa - Market size and forecast 2025-2030 ($ million)
Data Table on South Africa - Market size and forecast 2025-2030 ($ million)
Chart on South Africa - Year-over-year growth 2025-2030 (%)
Data Table on South Africa - Year-over-year growth 2025-2030 (%)

12.7.5 Turkey - Market size and forecast 2025-2030

Chart on Turkey - Market size and forecast 2025-2030 ($ million)
Data Table on Turkey - Market size and forecast 2025-2030 ($ million)
Chart on Turkey - Year-over-year growth 2025-2030 (%)
Data Table on Turkey - Year-over-year growth 2025-2030 (%)

12.8 Market opportunity by geography

Market opportunity by geography ($ million)
Data Tables on Market opportunity by geography ($ million)

13. Drivers, Challenges, and Opportunity

13.1 Market drivers

Increasing demand for consumer electronics and wearable devices
Advancements in display technologies and automotive applications
Growth in healthcare and medical devices

13.2 Market challenges

High production costs and investment requirements
Technical challenges in manufacturing and reliability
Inconsistent process integration across value chains

13.3 Impact of drivers and challenges

Impact of drivers and challenges in 2025 and 2030

13.4 Market opportunities

Integration of hybrid electronics systems
Emphasis on sustainable and eco-friendly manufacturing
Expansion of applications in automotive and smart infrastructure

14. Competitive Landscape

14.1 Overview

14.2

Overview on criticality of inputs and factors of differentiation

14.3 Landscape disruption

Overview on factors of disruption

14.4 Industry risks

Impact of key risks on business

15. Competitive Analysis

15.1 Companies profiled

Companies covered

15.2 Company ranking index

15.3 Market positioning of companies

Matrix on companies position and classification

15.4 3M Co.

3M Co. - Overview
3M Co. - Business segments
3M Co. - Key news
3M Co. - Key offerings
3M Co. - Segment focus
SWOT

15.5 Applied Materials Inc.

Applied Materials Inc. - Overview
Applied Materials Inc. - Business segments
Applied Materials Inc. - Key offerings
Applied Materials Inc. - Segment focus
SWOT

15.6 BASF SE

BASF SE - Overview
BASF SE - Business segments
BASF SE - Key news
BASF SE - Key offerings
BASF SE - Segment focus
SWOT

15.7 DuPont de Nemours Inc.

DuPont de Nemours Inc. - Overview
DuPont de Nemours Inc. - Business segments
DuPont de Nemours Inc. - Key news
DuPont de Nemours Inc. - Key offerings
DuPont de Nemours Inc. - Segment focus
SWOT

15.8 E Ink Holdings Inc.

E Ink Holdings Inc. - Overview
E Ink Holdings Inc. - Business segments
E Ink Holdings Inc. - Key news
E Ink Holdings Inc. - Key offerings
E Ink Holdings Inc. - Segment focus
SWOT

15.9 Forge Nano Inc.

Forge Nano Inc. - Overview
Forge Nano Inc. - Product / Service
Forge Nano Inc. - Key offerings
SWOT

15.10 Fujikura Co. Ltd.

Fujikura Co. Ltd. - Overview
Fujikura Co. Ltd. - Business segments
Fujikura Co. Ltd. - Key news
Fujikura Co. Ltd. - Key offerings
Fujikura Co. Ltd. - Segment focus
SWOT

15.11 Henkel AG and Co. KGaA

Henkel AG and Co. KGaA - Overview
Henkel AG and Co. KGaA - Business segments
Henkel AG and Co. KGaA - Key news
Henkel AG and Co. KGaA - Key offerings
Henkel AG and Co. KGaA - Segment focus
SWOT

15.12 LG Electronics Inc.

LG Electronics Inc. - Overview
LG Electronics Inc. - Product / Service
LG Electronics Inc. - Key offerings
SWOT

15.13 Marian Inc.

Marian Inc. - Overview
Marian Inc. - Product / Service
Marian Inc. - Key offerings
SWOT

15.14 Molex LLC

Molex LLC - Overview
Molex LLC - Product / Service
Molex LLC - Key offerings
SWOT

15.15 Multek Corp.

Multek Corp. - Overview
Multek Corp. - Product / Service
Multek Corp. - Key offerings
SWOT

15.16 Nissha Co. Ltd.

Nissha Co. Ltd. - Overview
Nissha Co. Ltd. - Business segments
Nissha Co. Ltd. - Key offerings
Nissha Co. Ltd. - Segment focus
SWOT

15.17 Sumitomo Electric Industries

Sumitomo Electric Industries - Overview
Sumitomo Electric Industries - Business segments
Sumitomo Electric Industries - Key news
Sumitomo Electric Industries - Key offerings
Sumitomo Electric Industries - Segment focus
SWOT

15.18 Ynvisible Interactive Inc

Ynvisible Interactive Inc - Overview
Ynvisible Interactive Inc - Product / Service
Ynvisible Interactive Inc - Key offerings
SWOT

16. Appendix

16.1 Scope of the report

Market definition
Objectives
Notes and caveats

16.2 Inclusions and exclusions checklist

Inclusions checklist
Exclusions checklist

16.3 Currency conversion rates for US$

16.4 Research methodology

16.5 Data procurement

Information sources

16.6 Data validation

16.7 Validation techniques employed for market sizing

16.8 Data synthesis

16.9 360 degree market analysis

16.10 List of abbreviations

Research Methodology

Technavio presents a detailed picture of the market by way of study, synthesis, and summation of data from multiple sources. The analysts have presented the various facets of the market with a particular focus on identifying the key industry influencers. The data thus presented is comprehensive, reliable, and the result of extensive research, both primary and secondary.

INFORMATION SOURCES

Primary sources

  • Manufacturers and suppliers
  • Channel partners
  • Industry experts
  • Strategic decision makers

Secondary sources

  • Industry journals and periodicals
  • Government data
  • Financial reports of key industry players
  • Historical data
  • Press releases

DATA ANALYSIS

Data Synthesis

  • Collation of data
  • Estimation of key figures
  • Analysis of derived insights

Data Validation

  • Triangulation with data models
  • Reference against proprietary databases
  • Corroboration with industry experts

REPORT WRITING

Qualitative

  • Market drivers
  • Market challenges
  • Market trends
  • Five forces analysis

Quantitative

  • Market size and forecast
  • Market segmentation
  • Geographical insights
  • Competitive landscape

Interested in this report?

Get your sample now to see our research methodology and insights!

Download Now

Frequently Asked Questions

Roll To Roll Flexible Electronics market growth will increase by USD 5402.6 million during 2026-2030.

The Roll To Roll Flexible Electronics market is expected to grow at a CAGR of 10.4% during 2026-2030.

Roll To Roll Flexible Electronics market is segmented by End-user (Consumer electronics, Energy, Healthcare, Others) Application (Displays, Sensors, Batteries, Photovoltaics, Others) Material (Substrates, Inks, Others)

3M Co., Applied Materials Inc., BASF SE, DuPont de Nemours Inc., E Ink Holdings Inc., Forge Nano Inc., Fujikura Co. Ltd., Henkel AG and Co. KGaA, LG Electronics Inc., Marian Inc., Molex LLC, Multek Corp., Nissha Co. Ltd., Sumitomo Electric Industries, Ynvisible Interactive Inc are a few of the key vendors in the Roll To Roll Flexible Electronics market.

APAC will register the highest growth rate of 38.4% among the other regions. Therefore, the Roll To Roll Flexible Electronics market in APAC is expected to garner significant business opportunities for the vendors during the forecast period.

US, Canada, Mexico, China, Japan, India, South Korea, Indonesia, Australia, Germany, UK, France, Italy, Spain, The Netherlands, Brazil, Argentina, Chile, UAE, Israel, Saudi Arabia, South Africa, Turkey

  • Increasing demand for consumer electronics and wearable devices is the driving factor this market.

The Roll To Roll Flexible Electronics market vendors should focus on grabbing business opportunities from the End-user segment as it accounted for the largest market share in the base year.