North America Rolling Stock Market Size 2025-2029
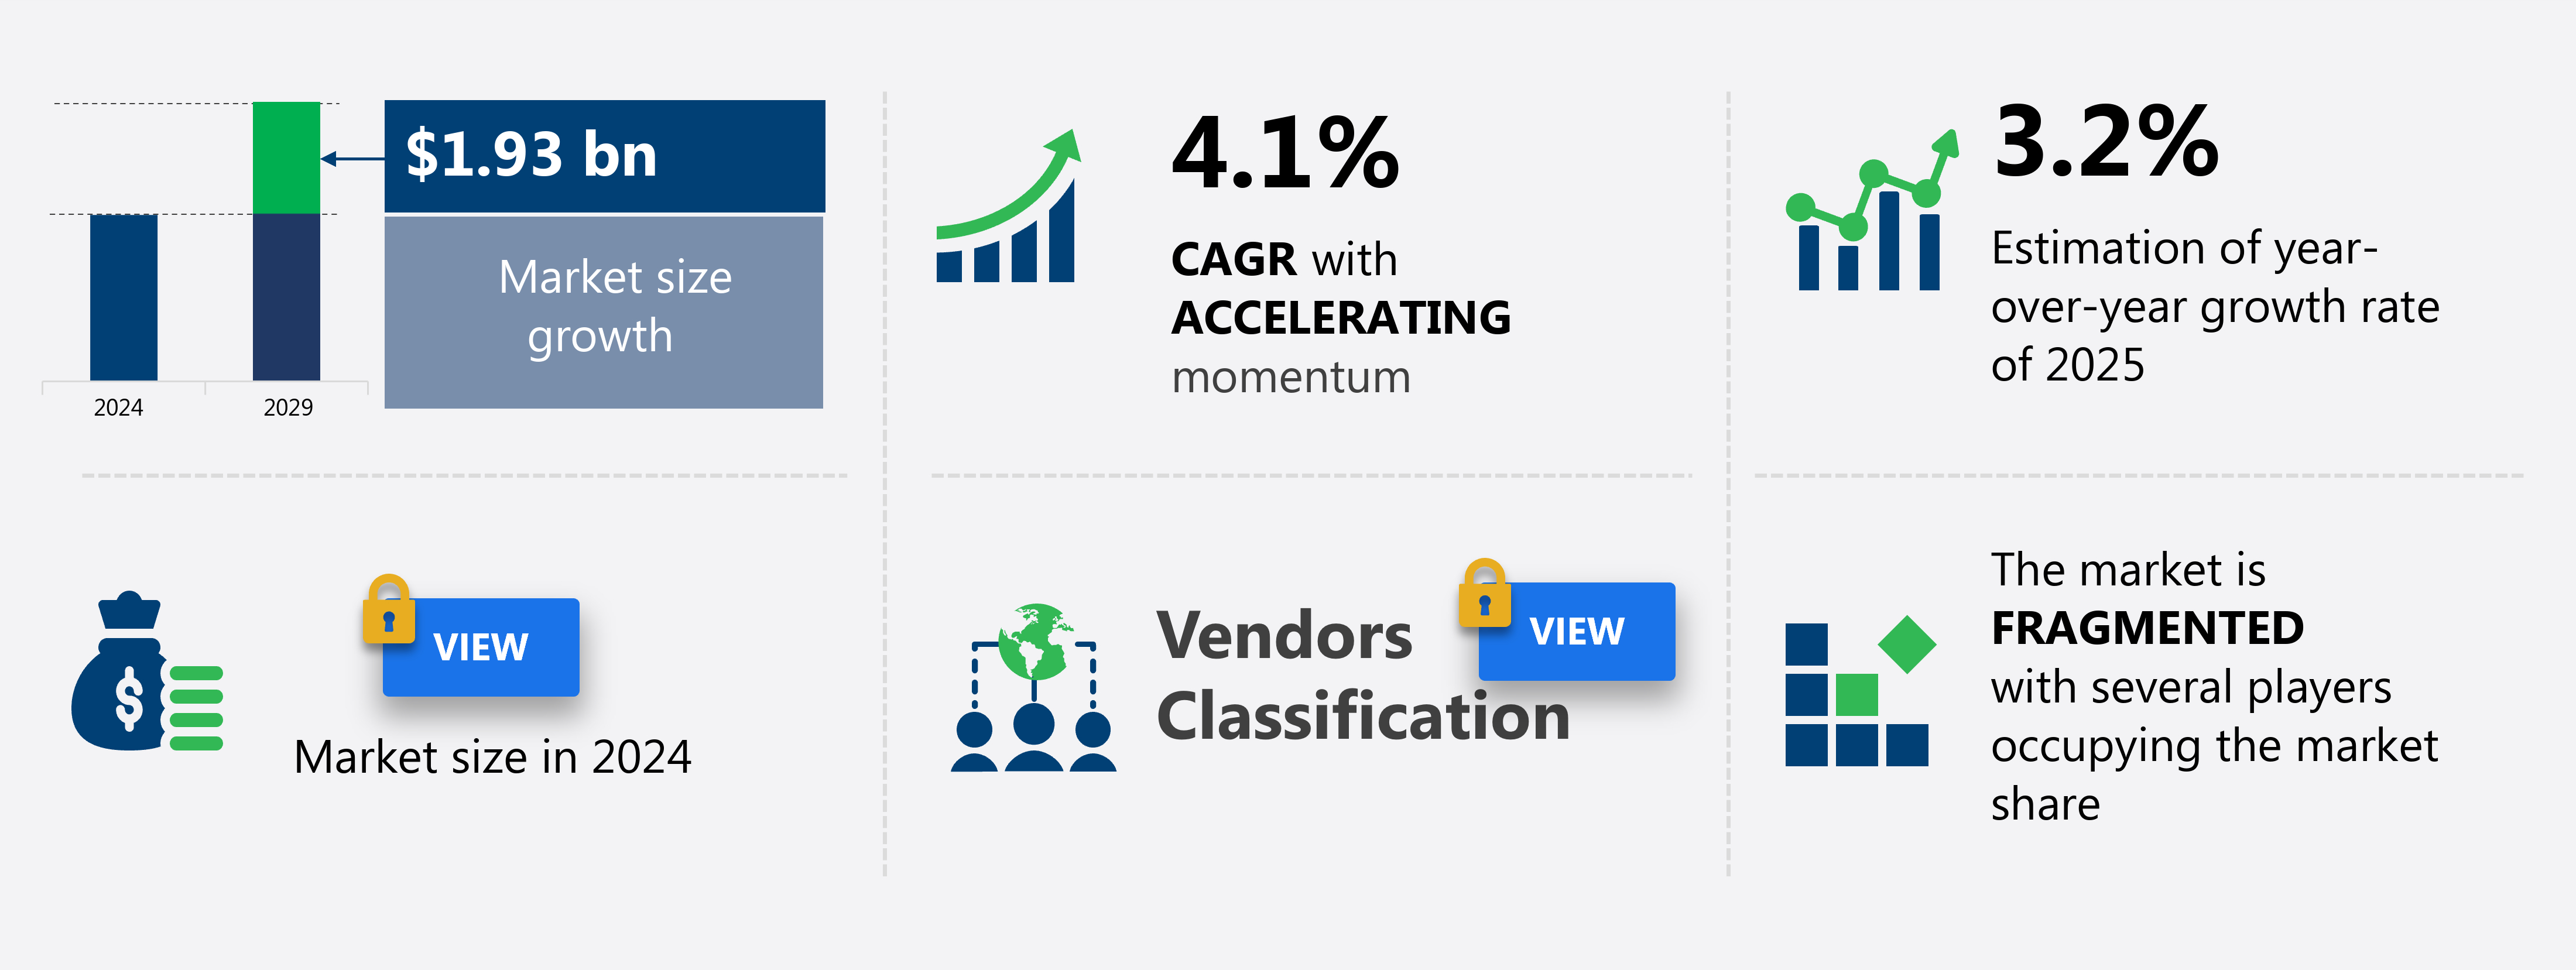
The North America rolling stock market size is forecast to increase by USD 1.93 billion at a CAGR of 4.1% between 2024 and 2029.
- The market is driven by the surging demand for freight wagons, underpinned by the low transportation cost of freight. This dynamic is particularly notable in the context of the growing demand for raw materials and finished goods, necessitating the transportation of large volumes over long distances. However, the market faces significant challenges. Stringent safety and environmental regulations for rolling stock pose substantial hurdles for manufacturers and operators. These regulations require substantial investments in research and development, as well as the adoption of advanced technologies to ensure compliance.
- Additionally, the need for continuous innovation to meet evolving customer needs and regulatory requirements adds to the market's complexity. Companies seeking to capitalize on market opportunities must navigate these challenges effectively, focusing on the development of safe, environmentally friendly, and cost-effective rolling stock solutions.
What will be the size of the North America Rolling Stock Market during the forecast period?
Explore in-depth regional segment analysis with market size data - historical 2019-2023 and forecasts 2025-2029 - in the full report.
Request Free Sample
- The North American railway market is experiencing significant advancements, with railroad electrification gaining momentum. Body shells and suspension systems are being upgraded for enhanced passenger comfort, while tunnel boring technology facilitates the expansion of rail networks. Axle assemblies, trucks (bogies), and wheel sets undergo continuous improvement for optimal track stability and condition monitoring. Climate control systems ensure passenger comfort in extreme temperatures, and accessibility features cater to diverse user needs. Seating capacity is a key consideration in train scheduling and route optimization. Railroad construction incorporates advanced braking systems, fire suppression systems, and security measures. Power substations and overhead catenery are essential components of electric traction motors, enabling efficient energy transfer.
- Track alignment and geometry are crucial for ensuring optimal train performance and safety. Bridge construction and track renewal are ongoing processes to maintain the integrity of the railway infrastructure. Suspension systems, body shells, and wheel sets are integral to maintaining track stability, while axle assemblies and trucks (bogies) facilitate smooth train movement. Railroad electrification, passenger information systems, and route optimization contribute to the overall efficiency and productivity of the railway sector. Accessibility features, climate control, and passenger comfort are essential considerations for enhancing the user experience. Braking systems, track alignment, and track renewal are critical for ensuring safety and reliability.
- Suspension systems, axle assemblies, and wheel sets undergo continuous improvement for optimal train performance. Railway electrification, tunnel boring, and bridge construction are driving the expansion of railway networks. Seating capacity, train scheduling, and route optimization are essential for efficient rail operations. Track condition monitoring, climate control, and passenger information systems are key components of modern railway infrastructure. Fire suppression systems, security systems, and suspension systems are integral to ensuring train safety and passenger comfort. Track alignment, track renewal, and axle assemblies are crucial for maintaining optimal train performance. Electric traction motors, overhead catenery, and power substations facilitate efficient energy transfer and train movement.
- The North American railway market is witnessing advancements in railroad electrification, suspension systems, and passenger comfort. Bridge construction, track renewal, and train scheduling are essential for maintaining the integrity and efficiency of railway infrastructure. Axle assemblies, wheel sets, and braking systems are critical components for optimal train performance. Climate control, passenger comfort, and accessibility features are essential considerations for modern railway infrastructure. Railroad electrification, track alignment, and route optimization are key drivers of railway expansion and efficiency. Suspension systems, axle assemblies, and wheel sets are integral to maintaining optimal train performance and safety.
How is this market segmented?
The market research report provides comprehensive data (region-wise segment analysis), with forecasts and estimates in "USD billion" for the period 2025-2029, as well as historical data from 2019-2023 for the following segments.
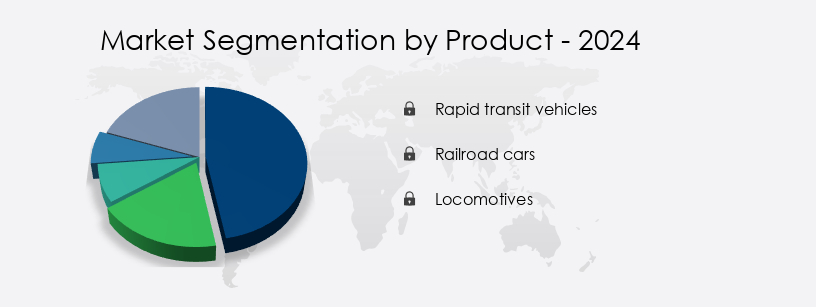
- Product
- Rapid transit vehicles
- Railroad cars
- Locomotives
- Type
- Rail freight
- Rail passenger
- Component
- Wheels and axles
- Suspension systems
- Braking systems
- Power and transmission systems
- Others
- Propulsion
- Diesel
- Electric
- Hybrid
- Application
- Passenger Transportation
- Freight Transportation
- End-User
- Public Transportation
- Private Operators
- Industrial Use
- Geography
- North America
- US
- Canada
- Mexico
- North America
By Product Insights
The rapid transit vehicles segment is estimated to witness significant growth during the forecast period.
In North America, the rolling stock market encompasses various segments, including maintenance of rapid transit vehicles and intermodal transportation, track maintenance adhering to AAR standards, rolling stock design featuring railroad spikes and electric multiple units, commuter rail prioritizing structural integrity, fleet management systems, and track gauges. The railroad industry upholds regulations from the Federal Railroad Administration (FRA) for rolling stock lifespan and railroad crossings. Signaling systems, diesel-electric locomotives, freight cars, and intermodal containers focus on fuel efficiency and environmental impact. High-capacity railroad bridges, networks, yards, and passenger transportation systems, such as light rail, passenger cars, and automatic train operation, are integral to the market.
Rolling stock technology advances with positive train control, track switches, and data acquisition systems, ensuring safety and efficiency. The railroad industry continues to evolve, incorporating first class amenities, corrosion resistance, cab cars, and freight transportation solutions. Rolling stock leasing is a significant aspect, offering flexibility for businesses. With increasing investments in urban transit systems, the demand for rapid transit vehicles is surging. Simultaneously, the focus on improving public transport networks to reduce environmental pollution from private vehicles is propelling market growth.
The Rapid transit vehicles segment was valued at USD billion in 2019 and showed a gradual increase during the forecast period.
Market Dynamics
Our researchers analyzed the data with 2024 as the base year, along with the key drivers, trends, and challenges. A holistic analysis of drivers will help companies refine their marketing strategies to gain a competitive advantage.
What are the North America Rolling Stock Market drivers leading to the rise in adoption of the Industry?
- The primary factor fueling market growth is the heightened demand for freight wagons.
- In North America, railroads play a pivotal role in intercity commodity transportation. The preference for railroad shipment is due to its safety and increasing demand for freight transport in countries like the US and Canada. As a result, there is a growing trend towards longer trains with increased axle loads. The demand for freight cars is anticipated to surpass deliveries during the forecast period, particularly for types such as gondolas, hoppers, flat cars, and tank cars. Diesel-electric locomotives continue to dominate the market, powering these freight trains. Railroad networks are expanding, requiring the construction of railroad bridges and the maintenance of railroad tracks and railroad yards.
- In the realm of passenger transportation, light rail systems and high-speed trains, such as bullet trains, are gaining popularity. These trains utilize advanced technologies like data acquisition systems, remote monitoring, and signal towers to ensure fuel efficiency and minimize environmental impact. The rail industry is continually evolving, with innovations in technology and infrastructure shaping its future.
What are the North America Rolling Stock Market trends shaping the Industry?
- The current market trend favors the low transportation cost of freight. This cost reduction is a significant factor in increasing competitiveness and efficiency within the logistics industry.
- Rail transport plays a significant role in North American freight transportation due to its cost-effectiveness and efficiency. Compared to other modes of transportation, rail can transport larger quantities of cargo over longer distances, making it six to seven times more efficient than road transport. This results in a reduction of pollution by 30-80%. The cost of rail travel is slightly higher than vehicle travel, but the benefits outweigh the difference. Freight rail companies have continually invested in increasing the tonnage per train, reducing costs for their customers. In addition to freight, passenger rail transport is also gaining popularity in North America.
- Passenger Car types include cab cars, intercity rail, and high-speed rail. Rolling stock technology, such as positive train control and automatic train operation, enhances safety and efficiency. Maintenance facilities ensure the rolling stock remains in optimal condition, reducing downtime and improving reliability. Regulations, such as emissions regulations, also impact the rail industry. Heavy haul and tank cars must comply with these regulations to ensure safe transportation of goods. Diesel locomotives are being replaced with more eco-friendly alternatives to meet these regulations. Railroad safety is a top priority, with ongoing research and development in this area. Rolling stock technology, such as cab cars with improved corrosion resistance and track switch sensors, contribute to enhanced safety.
How does North America Rolling Stock Market faces challenges face during its growth?
- The rolling stock industry faces significant growth restrictions due to stringent safety and environmental regulations. These regulations, which are mandatory for ensuring passenger and cargo safety as well as minimizing environmental impact, pose a considerable challenge to industry expansion.
- The North American rolling stock market is subject to rigorous safety and environmental regulations, necessitating substantial investments in technology and infrastructure. These regulations prioritize passenger, crew, and cargo safety, compelling manufacturers to incorporate advanced safety systems and technologies. These investments can be financially demanding, potentially impacting operational efficiency and cost-effectiveness for both manufacturers and operators. Moreover, railroad infrastructure components, such as locomotive types, railroad ties, railroad grade crossings, and track ballast, require continuous upkeep and replacement. The implementation of wireless communication systems, train control systems, and high-speed rail trains further necessitates ongoing investment. In the context of subway systems, weight distribution and locomotive horsepower are crucial factors in ensuring efficient and reliable operations.
- Electric locomotives and hopper cars are essential components of the rolling stock landscape, catering to various industries and transportation needs. Rolling stock leasing also plays a significant role in the industry, offering flexibility and cost savings for operators. In conclusion, the North American rolling stock market faces challenges in balancing the need for regulatory compliance, technological advancements, and operational efficiency. Manufacturers and operators must navigate these complexities while maintaining a focus on cost-effectiveness and profitability.
Exclusive North America Rolling Stock Market Customer Landscape
The market forecasting report includes the adoption lifecycle of the market, covering from the innovator's stage to the laggard's stage. It focuses on adoption rates in different regions based on penetration. Furthermore, the report also includes key purchase criteria and drivers of price sensitivity to help companies evaluate and develop their market growth analysis strategies.
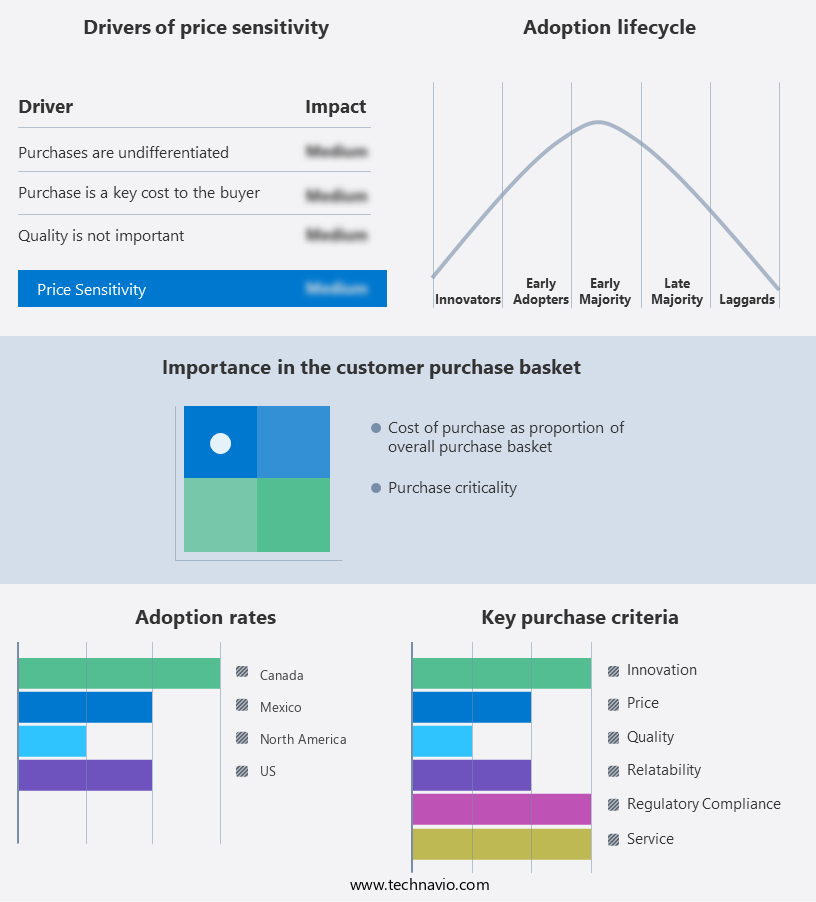
Customer Landscape
Key Companies & Market Insights
Companies are implementing various strategies, such as strategic alliances, market forecast partnerships, mergers and acquisitions, geographical expansion, and product/service launches, to enhance their presence in the market.
The market research and growth report includes detailed analyses of the competitive landscape of the market and information about key companies, including:
- ALSTOM SA
- American Industrial Transport Inc.
- Bombardier Inc.
- Brookville Equipment Corp.
- Caterpillar Inc.
- COLMAR Technik S.p.a.
- CRRC Corp. Ltd.
- FreightCar America Inc.
- General Electric Co.
- Hitachi Ltd.
- Hyundai Motor Co.
- National Steel Car Ltd.
- Railserve Inc.
- Siemens AG
- Stadler Rail Ag
- The Greenbrier Companies Inc.
- Trinity Industries Inc.
- United Rentals Inc.
- Western Train Co.
- Westinghouse Air Brake Technologies Corp.
Qualitative and quantitative analysis of companies has been conducted to help clients understand the wider business environment as well as the strengths and weaknesses of key market players. Data is qualitatively analyzed to categorize companies as pure play, category-focused, industry-focused, and diversified; it is quantitatively analyzed to categorize companies as dominant, leading, strong, tentative, and weak.
Recent Development and News in Rolling Stock Market In North America
- In January 2024, Bombardier Transportation announced the launch of its innovative BOMBARDIER PRIMOVE battery-electric multiple unit (BEMU) in the United States, marking a significant advancement in sustainable rolling stock solutions (Bombardier Transportation press release, 2024). This zero-emission train is expected to revolutionize the North American rail market with its extended range and quick-charge capability.
- In March 2025, General Electric (GE) Rail and Wabtec signed a strategic partnership to develop advanced EcoSmart locomotives, combining GE's locomotive manufacturing expertise with Wabtec's technology and digital solutions (GE press release, 2025). This collaboration aims to create more fuel-efficient and environmentally friendly locomotives, strengthening their competitive position in the North American rail industry.
- In May 2024, Amtrak received a USD1.3 billion grant from the Infrastructure Investment and Jobs Act to modernize its Northeast Corridor fleet, representing a major government initiative to enhance the passenger rail system in the region (Amtrak press release, 2024). This investment will lead to the acquisition of new rolling stock and infrastructure upgrades, improving the travel experience and efficiency for millions of passengers.
Research Analyst Overview
The market is characterized by its continuous evolution and dynamic nature, with various sectors continually adapting to meet the changing demands of freight and passenger transportation. Rolling stock design and maintenance play a crucial role in ensuring structural integrity and fleet management systems, adhering to industry standards such as AAR and FRA regulations. Freight transportation requires freight car types with high capacity and fuel efficiency, including hopper cars and tank cars, which must meet emissions regulations. Intermodal transportation relies on the seamless integration of railroad networks, track gauges, and signaling systems, as well as the use of electric multiple units and cab cars.
Passenger transportation, including commuter rail and intercity rail, prioritizes comfort and safety, with applications of positive train control, automatic train operation, and data acquisition systems. High-speed rail and bullet trains incorporate advanced rolling stock technology, such as wireless communication and weight distribution, to optimize performance and reduce environmental impact. Maintenance facilities and track maintenance are essential components of the railroad industry, ensuring the longevity of rolling stock and railroad infrastructure, including railroad ties, track switches, and railroad bridges. The ongoing unfolding of market activities and evolving patterns highlights the importance of rolling stock technology, railroad safety, and cab cars in meeting the demands of the ever-evolving transportation landscape.
Dive into Technavio's robust research methodology, blending expert interviews, extensive data synthesis, and validated models for unparalleled Rolling Stock Market in North America insights. See full methodology.
|
Market Scope |
|
|
Report Coverage |
Details |
|
Page number |
195 |
|
Base year |
2024 |
|
Historic period |
2019-2023 |
|
Forecast period |
2025-2029 |
|
Growth momentum & CAGR |
Accelerate at a CAGR of 4.1% |
|
Market growth 2025-2029 |
USD 1.93 billion |
|
Market structure |
Fragmented |
|
YoY growth 2024-2025(%) |
3.2 |
|
Competitive landscape |
Leading Companies, Market Positioning of Companies, Competitive Strategies, and Industry Risks |
What are the Key Data Covered in this Market Research Report?
- CAGR of the market during the forecast period
- Detailed information on factors that will drive the market growth and forecasting between 2025 and 2029
- Precise estimation of the size of the market and its contribution of the market in focus to the parent market
- Accurate predictions about upcoming market growth and trends and changes in consumer behaviour
- Growth of the market across North America
- Thorough analysis of the market's competitive landscape and detailed information about companies
- Comprehensive analysis of factors that will challenge the growth of market companies
We can help! Our analysts can customize this market research report to meet your requirements Get in touch
 RIA -
RIA - 
