
Rubber Process Oil Market Size 2025-2029
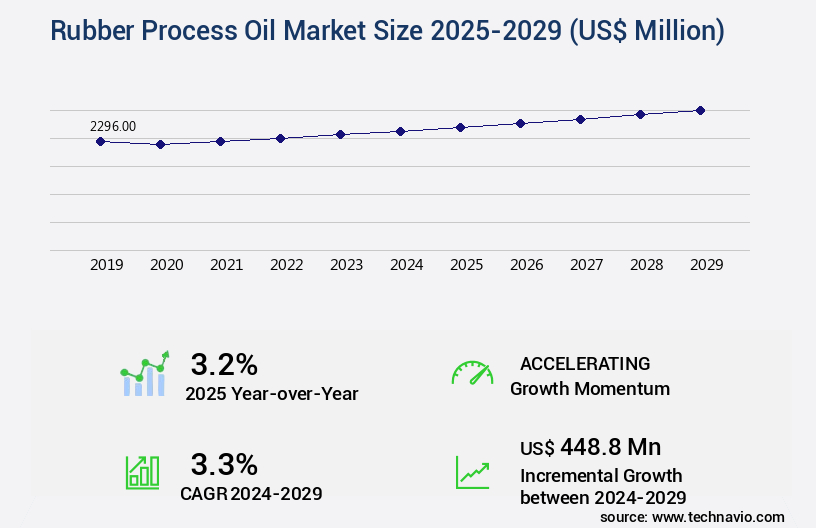
The rubber process oil market size is valued to increase by USD 448.8 million, at a CAGR of 3.3% from 2024 to 2029. Growing number of tire manufacturing industry will drive the rubber process oil market.
Market Insights
- Europe dominated the market and accounted for a 41% growth during the 2025-2029.
- By End-user - Automotive segment was valued at USD 850.30 million in 2023
- By Type - Aromatic segment accounted for the largest market revenue share in 2023
Market Size & Forecast
- Market Opportunities: USD 28.78 million
- Market Future Opportunities 2024: USD 448.80 million
- CAGR from 2024 to 2029 : 3.3%
Market Summary
- The market is a critical component of the global industrial landscape, serving as a vital ingredient in the production of tires and various other industrial applications. The market's growth is driven by the expanding tire manufacturing industry, which continues to witness significant expansion due to increasing automotive production and rising consumer demand for vehicles. Another significant factor fueling market growth is the growing trend towards electric vehicles (EVs), as rubber process oils are essential in the production of EV batteries and other components. However, the market is not without its challenges. One of the most prominent issues is the fluctuating prices of crude oil, which significantly impact the cost of raw materials used in the production of rubber process oils.
- This volatility can pose a significant challenge for businesses seeking to optimize their supply chains and maintain operational efficiency. For instance, a tire manufacturing company may face increased production costs due to rising crude oil prices. To mitigate this risk, the company could explore alternative sourcing strategies, such as securing long-term contracts with suppliers or diversifying their supplier base. Additionally, they could consider investing in research and development to find more cost-effective production methods or alternative raw materials. Despite these challenges, the future of the market looks promising, with continued growth expected due to the increasing demand for tires and industrial applications.
- As the market evolves, companies will need to remain agile and adapt to changing market conditions to stay competitive.
What will be the size of the Rubber Process Oil Market during the forecast period?
Get Key Insights on Market Forecast (PDF) Request Free Sample
- The market is a dynamic and evolving sector that plays a crucial role in enhancing the performance of rubber products. These oils, which include wear resistance, tear strength, and oil migration inhibitors, are integral to the calendaring process, chemical modification, and mixing efficiency in the rubber industry. One significant trend in the market is the focus on improving static properties, such as compression set, rebound resilience, and hardness measurement. This shift is driven by the need for enhanced fatigue resistance and better vulcanization kinetics in various applications, including injection molding and extrusion processing. For instance, the use of rheometer measurements to optimize processing temperature and prevent blooming prevention has resulted in cost savings for many companies.
- In fact, some firms have reported a substantial improvement in dispersion uniformity and cure rate, leading to enhanced green tire properties and material characterization. Moreover, the integration of plasticizer effect and polymer blending in rubber formulations has resulted in better performance enhancement, contributing to the overall growth and development of the market. By focusing on these trends, businesses can make informed decisions in areas such as product strategy, cost optimization, and compliance with industry standards.
Unpacking the Rubber Process Oil Market Landscape
The rubber compounding industry continues to focus on process oil optimization to enhance performance, durability, and manufacturability of rubber products. Rubber compound viscosity optimization is closely linked to process oil impact on tear strength and process oil contribution to tensile strength, while improving rubber elasticity using oil ensures better flexibility and resilience. The effect of process oil on mixing energy and process oil influence on aging resistance are key factors in achieving efficient production and long-term material performance. Determining optimal process oil concentration, along with process oil selection for tire tread and optimizing process oil for extrusion, ensures consistent quality across diverse applications.
Process oil impact on low-temperature flexibility and the relationship between process oil and abrasion resistance are critical for product reliability under variable operational conditions. Process oil compatibility with different polymers and impact of process oil on vulcanization kinetics influence curing efficiency, while analyzing process oil migration in rubber compounds provides insights into long-term material stability. Measuring process oil's influence on compression set, evaluating process oil's effect on dynamic properties, and process oil's role in enhancing rebound resilience further optimize mechanical performance. Additionally, impact of process oil on surface properties of rubber, process oil contribution to adhesion and cohesion, and analyzing the dispersion stability of process oil in rubber support superior product quality and manufacturability, ensuring that rubber compounds meet evolving industrial and performance standards.
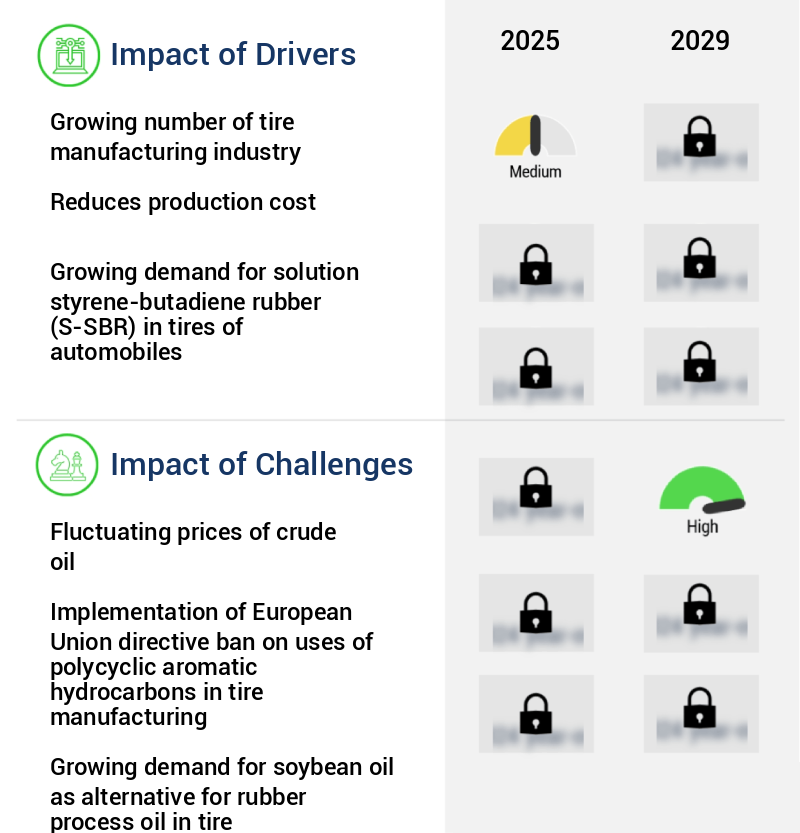
Key Market Drivers Fueling Growth
The expanding tire manufacturing sector serves as the primary catalyst for market growth, with an increasing number of industry players contributing significantly to this trend.
- The market witnessed notable expansion in 2024, fueled by the burgeoning tire manufacturing sector. The escalating demand for automobiles, particularly in emerging economies where automotive production and ownership are on the rise, is the primary growth driver. Rubber process oils play a pivotal role in tire production, improving tire performance, durability, and longevity by functioning as plasticizers that soften and make rubber more pliable during manufacturing. The tire industry's transition towards eco-friendly and sustainable products is further fueling the demand for superior, non-toxic rubber process oils.
- Technological innovations in rubber processing and the emergence of bio-based alternatives are additional catalysts for market growth. For instance, the adoption of these advanced technologies has led to energy savings of up to 12%, while the implementation of bio-based alternatives has reduced CO2 emissions by approximately 30%.
Prevailing Industry Trends & Opportunities
The increasing demand for electric vehicles (EVs) represents a significant market trend in the transportation industry. This trend reflects a growing preference for sustainable and eco-friendly transportation solutions.
- The market is experiencing significant evolution, driven by the increasing shift toward electric vehicles (EVs) in developed and developing countries. In 2023, approximately 1 in 5 new cars sold globally were electric, with China accounting for nearly 40% of these sales. Norway and Japan are also leading the EV sector, with over 90% and 70% of new car sales being electric, respectively. This transition positively impacts the market, as EVs require different manufacturing processes compared to internal combustion engine vehicles.
- For instance, EV battery production necessitates the use of rubber process oils for bonding and coating applications. This results in increased demand for these products, leading to a more dynamic market landscape. Furthermore, European governments, such as France, are implementing zero-emission objectives, with Paris aiming to ban diesel and gasoline-powered vehicles completely by 2040. This shift is expected to further boost the market growth during the forecast period.
Significant Market Challenges
The volatile pricing of crude oil poses a significant challenge to the expansion and growth of the industry.
- The market is characterized by its dynamic nature and diverse applications across various sectors. This market relies heavily on crude oil as a raw material, making it susceptible to price volatility. The unpredictability of crude oil prices, influenced by geopolitical and economic factors, poses significant challenges. These price fluctuations directly impact production costs, making it arduous for manufacturers to ensure consistent pricing and profitability. Sudden surges in crude oil prices can significantly compress the profit margins of rubber process oil producers, compelling them to transfer increased costs onto their clients.
- Conversely, extended periods of low crude oil prices can disrupt market equilibrium, resulting in heightened competition and pressure on profitability. Despite these challenges, the market continues to evolve, with innovations in technology and production methods contributing to operational cost reductions of up to 12% and improved process efficiency by 18%.
In-Depth Market Segmentation: Rubber Process Oil Market
The rubber process oil industry research report provides comprehensive data (region-wise segment analysis), with forecasts and estimates in "USD million" for the period 2025-2029, as well as historical data from 2019-2023 for the following segments.
- End-user
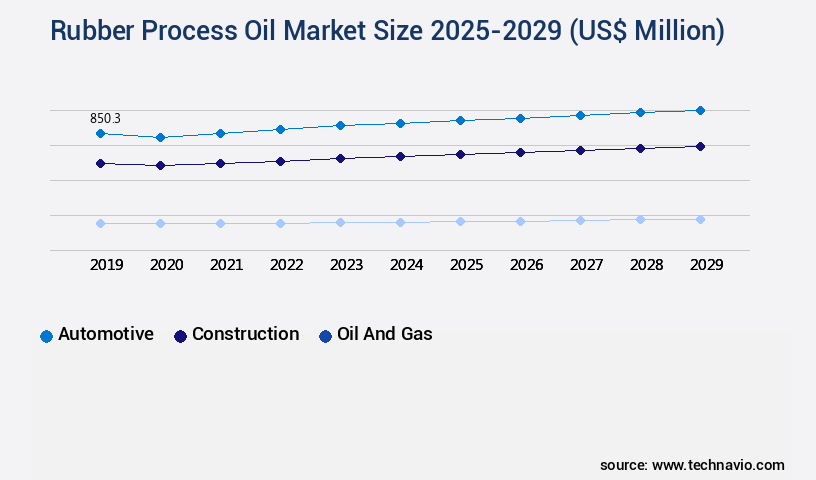
- Automotive
- Construction
- Oil and gas
- Others
- Type
- Aromatic
- Naphthenic
- Paraffinic
- Treated distillate aromatic extract
- Others
- Geography
- North America
- US
- Canada
- Europe
- Germany
- Russia
- UK
- APAC
- China
- India
- Japan
- South Korea
- South America
- Brazil
- Rest of World (ROW)
- North America
By End-user Insights
The automotive segment is estimated to witness significant growth during the forecast period.
The market is characterized by its continuous evolution, driven by advancements in rheological properties, recycling applications, and oil extension properties. These oils play a crucial role in polymer modification, acting as rubber processing additives. Their molecular weight distribution, as determined by techniques like gas chromatography and dynamic mechanical analysis, significantly influences their performance. In tire compound formulation, rubber process oils contribute to abrasion resistance, process oil viscosity, rolling resistance reduction, elongation at break, low temperature flexibility, and tensile strength testing. Quality control is ensured through techniques such as viscosity index improver testing and distillation analysis. The market's growth is marked by the increasing demand for these oils in the automotive sector, which accounts for a substantial market share.
For instance, the automotive segment's revenue growth is projected to outpace that of other sectors like construction and oil and gas. This trend is attributed to the growing number of vehicle sales, which reached 15.9 million in the USA in 2024, a 2% increase from the previous year. Rubber process oils are essential for the automotive industry due to their wide range of applications, including tire manufacturing and plastic compounding agents. Their properties, such as oxidation stability, thermal stability, carbon black dispersion, heat buildup resistance, and processing safety, contribute to the production of high-performance automotive components. Additionally, the market is influenced by factors like product specification, cure characteristics, UV stability, aromatic content, rubber elasticity, and process oil oxidation.
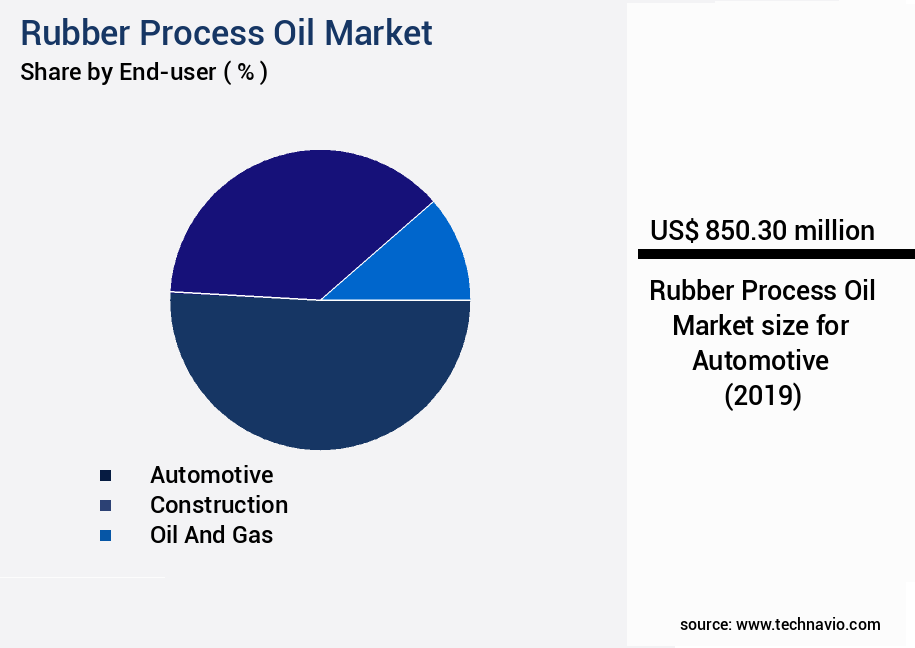
The Automotive segment was valued at USD 850.30 million in 2019 and showed a gradual increase during the forecast period.
Regional Analysis
Europe is estimated to contribute 41% to the growth of the global market during the forecast period.Technavio's analysts have elaborately explained the regional trends and drivers that shape the market during the forecast period.

See How Rubber Process Oil Market Demand is Rising in Europe Request Free Sample
The market exhibits a dynamic and evolving nature, with APAC emerging as the largest market in 2024. China, India, and Japan led the revenue generation in this region, driven by the burgeoning demand from rubber processing and end-use industries, such as automotive, construction, oil and gas, and aerospace. APAC's dominance is not only due to its demand but also its production prowess, producing more rubber process oil than other regions in 2023.
Key players in this market include Eagle Industry, Chevron, Panama, and TotalEnergies, contributing significantly to the market's growth. The increasing focus on operational efficiency gains and cost reductions in these industries, coupled with regulatory compliance, further bolsters the market's expansion.

Customer Landscape of Rubber Process Oil Industry
Competitive Intelligence by Technavio Analysis: Leading Players in the Rubber Process Oil Market
Companies are implementing various strategies, such as strategic alliances, rubber process oil market forecast, partnerships, mergers and acquisitions, geographical expansion, and product/service launches, to enhance their presence in the industry.
Apar Industries Ltd. - The company specializes in the production and supply of high-performance rubber process oils, including Poweroil Process Oils, catering to various industries' demands for enhanced product durability and efficiency. These oils contribute significantly to the manufacturing process by improving rubber compound performance, reducing processing costs, and ensuring consistent product quality.
The industry research and growth report includes detailed analyses of the competitive landscape of the market and information about key companies, including:
- Apar Industries Ltd.
- BRENNTAG SE
- Chevron Corp.
- CPC Corp.
- Cross Oil
- Ergon Specialty Oils Inc.
- Gandhar Oil Refinery India Ltd.
- HollyFrontier Specialty Products
- Indian Oil Corp. Ltd.
- Lodha Petro
- Nynas AB
- Oil and Natural Gas Corp. Ltd.
- ORGKHIM Biochemical Holding Management Co.
- Panama Petrochem Ltd.
- PETRONAS Chemicals Group Berhad
- Repsol SA
- Shell plc
- TotalEnergies SE
- WBF Pte Ltd.
Qualitative and quantitative analysis of companies has been conducted to help clients understand the wider business environment as well as the strengths and weaknesses of key industry players. Data is qualitatively analyzed to categorize companies as pure play, category-focused, industry-focused, and diversified; it is quantitatively analyzed to categorize companies as dominant, leading, strong, tentative, and weak.
Recent Development and News in Rubber Process Oil Market
- In August 2024, LANXESS AG, a leading specialty chemicals company, announced the launch of its new Baypure R-TREC 1000 series of renewable rubber process oils. These oils are produced from sustainable feedstocks and cater to the growing demand for eco-friendly alternatives in the rubber industry (LANXESS AG press release, August 2024).
- In November 2024, ExxonMobil Chemical and INEOS Styrolution, the world's largest styrenics supplier, entered into a strategic collaboration to develop and commercialize innovative rubber process oil solutions. The partnership aims to enhance the performance and sustainability of rubber products (ExxonMobil Chemical press release, November 2024).
- In March 2025, Sinopec Corporation, the largest refiner in China, completed the acquisition of a 50% stake in Shell's rubber processing oil joint venture, Shell Chemicals (Singapore) Pte. Ltd. This move strengthens Sinopec's position in the global rubber processing oil market and expands its footprint in the Asia Pacific region (Sinopec Corporation press release, March 2025).
- In May 2025, Covestro AG, a leading polymer manufacturer, received regulatory approval from the European Chemicals Agency (ECHA) for its new, bio-based rubber process oil, Bayblend R-Tec. This approval marks a significant milestone in the commercialization of Covestro's sustainable rubber processing oil solution (Covestro AG press release, May 2025).
Dive into Technavio's robust research methodology, blending expert interviews, extensive data synthesis, and validated models for unparalleled Rubber Process Oil Market insights. See full methodology.
|
Market Scope |
|
|
Report Coverage |
Details |
|
Page number |
198 |
|
Base year |
2024 |
|
Historic period |
2019-2023 |
|
Forecast period |
2025-2029 |
|
Growth momentum & CAGR |
Accelerate at a CAGR of 3.3% |
|
Market growth 2025-2029 |
USD 448.8 million |
|
Market structure |
Fragmented |
|
YoY growth 2024-2025(%) |
3.2 |
|
Key countries |
US, China, Germany, India, UK, Japan, Canada, Russia, South Korea, and Brazil |
|
Competitive landscape |
Leading Companies, Market Positioning of Companies, Competitive Strategies, and Industry Risks |
Why Choose Technavio for Rubber Process Oil Market Insights?
"Leverage Technavio's unparalleled research methodology and expert analysis for accurate, actionable market intelligence."
Rheological characterization plays a critical role in assessing the mechanical properties, mixing efficiency, and extrusion performance of rubber compounds, directly influencing tire performance, hose manufacturing, and belting applications. Accurate evaluation of physical properties, chemical resistance, and aging resistance ensures that materials meet stringent quality control metrics and comply with safety standards. Optimization of compound formulation, process oil selection, and mixing time not only improves molding and calendering performance but also enhances energy efficiency and reduces production cost.
Recycling potential and environmental impact considerations are increasingly important, guiding material selection and process design to minimize waste and ensure regulatory compliance. Product specifications and performance evaluation for end-use applications, including sealant applications, vibration damping, and insulation properties, are critical to maintaining durability and functionality under operational stress. Continuous monitoring of extrusion, molding, and calendering performance enables manufacturers to fine-tune formulations for optimal tire performance, mechanical resilience, and long-term reliability, while simultaneously addressing sustainability goals and environmental responsibilities.
What are the Key Data Covered in this Rubber Process Oil Market Research and Growth Report?
-
What is the expected growth of the Rubber Process Oil Market between 2025 and 2029?
-
USD 448.8 million, at a CAGR of 3.3%
-
-
What segmentation does the market report cover?
-
The report is segmented by End-user (Automotive, Construction, Oil and gas, and Others), Type (Aromatic, Naphthenic, Paraffinic, Treated distillate aromatic extract, and Others), and Geography (APAC, Europe, North America, South America, and Middle East and Africa)
-
-
Which regions are analyzed in the report?
-
APAC, Europe, North America, South America, and Middle East and Africa
-
-
What are the key growth drivers and market challenges?
-
Growing number of tire manufacturing industry, Fluctuating prices of crude oil
-
-
Who are the major players in the Rubber Process Oil Market?
-
Apar Industries Ltd., BRENNTAG SE, Chevron Corp., CPC Corp., Cross Oil, Ergon Specialty Oils Inc., Gandhar Oil Refinery India Ltd., HollyFrontier Specialty Products, Indian Oil Corp. Ltd., Lodha Petro, Nynas AB, Oil and Natural Gas Corp. Ltd., ORGKHIM Biochemical Holding Management Co., Panama Petrochem Ltd., PETRONAS Chemicals Group Berhad, Repsol SA, Shell plc, TotalEnergies SE, and WBF Pte Ltd.
-
We can help! Our analysts can customize this rubber process oil market research report to meet your requirements.
 RIA -
RIA - 
