Rugby Apparel Market Analysis, Size, and Forecast 2024-2028: Europe (France, Germany, Italy, Spain, UK), APAC (China, India, Japan, South Korea), North America (US, Canada, and Mexico), Middle East and Africa (UAE), and South America (Brazil)

Rugby Apparel Market Analysis, Size, and Forecast 2024-2028:
Europe (France, Germany, Italy, Spain, UK), APAC (China, India, Japan, South Korea), North America (US, Canada, and Mexico), Middle East and Africa (UAE), and South America (Brazil)

Published: Jun 2024 156 Pages SKU: IRTNTR72776

Market Overview at a Glance

$354.8 Mn
Market Opportunity
4.5%
CAGR
4.23
YoY growth 2023-2024(%)

Rugby Apparel Market Size 2024-2028

The rugby apparel market size is forecast to increase by USD 354.8 million at a CAGR of 4.5% between 2023 and 2028.

  • The market has witnessed significant growth in recent years, transitioning from a niche to a mainstream sport. This shift is driven by increasing global popularity and the widespread adoption of digital and social media marketing strategies, which have expanded the sport's and sports apparel reach and engagement. However, the market faces challenges as well. The growing awareness and activism against sweatshop labor practices pose a significant threat to the industry's reputation and profitability. Companies must address these concerns by ensuring ethical manufacturing processes and transparent supply chains to maintain consumer trust and loyalty.
  • As the market continues to evolve, it is crucial for rugby apparel brands to stay informed about consumer preferences, emerging trends, and ethical manufacturing standards to capitalize on opportunities and navigate challenges effectively.

What will be the Size of the Rugby Apparel Market during the forecast period?

Rugby Apparel Market Size

 Request Free Sample

  • Marketing campaigns, social media marketing, and influencer marketing are crucial for brand loyalty and fan engagement. Recycled fabrics and ethical sourcing are gaining traction, as consumers demand sustainable materials and ethical production practices. Competitor analysis, pricing strategies, and distribution networks shape the market landscape. Training apparel, wearable technology, and performance tracking are key areas of innovation, with injury prevention and customer feedback shaping future product development. Amateur rugby and youth rugby sectors are also adopting these trends, as the line between professional and amateur rugby continues to blur. Public relations and customer experience remain essential components of brand reputation management.
  • Design trends and retail strategies are influenced by the ongoing digital transformation, with e-commerce platforms and supply chain management optimizing the shopping experience. The market's continuous dynamism ensures a robust and exciting future for all stakeholders.

How is this Rugby Apparel Industry segmented?

The rugby apparel industry research report provides comprehensive data (region-wise segment analysis), with forecasts and estimates in "USD million" for the period 2024-2028, as well as historical data from 2018-2022 for the following segments.

  • End-user
    • Male
    • Female
  • Distribution Channel
    • Offline
    • Online
  • Material
    • Polyester
    • Cotton
    • Blends
    • Performance Fabrics
  • Product Type
    • Jerseys
    • Shorts
    • Protective Gear
    • Socks
  • Geography
    • North America
      • US
      • Canada
      • Mexico
    • Europe
      • France
      • Germany
      • Italy
      • Spain
      • UK
    • Middle East and Africa
      • UAE
    • APAC
      • China
      • India
      • Japan
      • South Korea
    • South America
      • Brazil
    • Rest of World (ROW)

By End-user Insights

The male segment is estimated to witness significant growth during the forecast period.

The market is witnessing significant growth, driven by the increasing popularity of rugby among fans worldwide. Technology integration plays a crucial role in this industry, with smart fabrics and wearable technology enhancing athletic performance and injury prevention. Major sportswear brands, such as Adidas, Nike, and Under Armour, dominate the market, offering a wide range of rugby apparel for men, including althletic footwear, shorts, hoodies, jerseys, and training gear. Product innovation is a key trend, with waterproof jackets, hydration packs, and elbow pads becoming essential items for players. Marketing campaigns and sports marketing strategies are also critical in engaging fans and boosting sales.

Sponsorship deals with rugby clubs and schools further fuel market growth. Online shopping and content marketing have become essential retail strategies, with e-commerce platforms and social media marketing enabling easy access to rugby apparel. Brand loyalty is strong among rugby fans, with performance wear and team kits being highly sought after. Competitor analysis and pricing strategies are essential for brands to maintain a strong market presence. Women's rugby is also gaining popularity, with ethical sourcing and sustainable materials becoming increasingly important in the production of rugby apparel. Fashion trends and influencer marketing are also influencing the market, with online retailers offering a wide range of rugby apparel to cater to diverse customer needs and preferences.

Supply chain management and distribution networks are crucial for ensuring timely delivery and customer experience. Performance tracking and data analytics help brands improve their product offerings and meet the evolving needs of rugby players. Injury prevention and moisture management are key concerns for players, leading to the increasing popularity of protective gear, such as shoulder pads, shin guards, and scrum caps. The market for rugby apparel is expected to continue its growth trajectory, driven by these trends and the passion and dedication of rugby fans.

Rugby Apparel Market Size

Request Free Sample

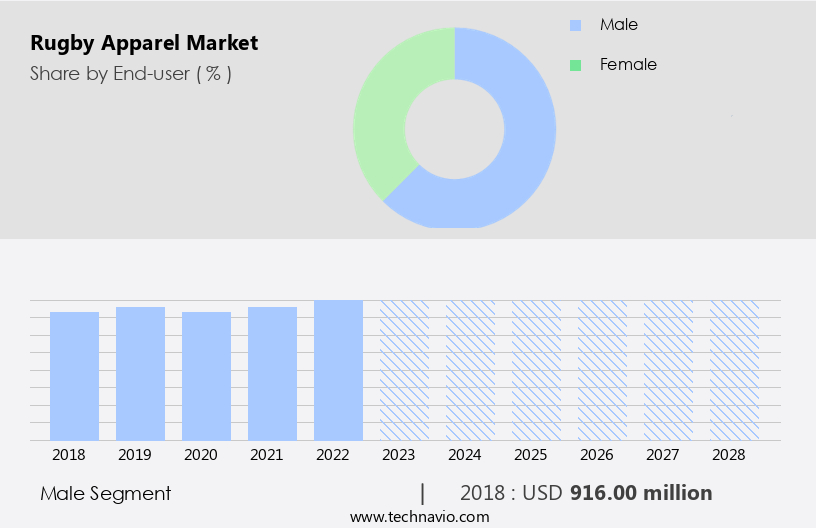
The Male segment was valued at USD 916.00 million in 2018 and showed a gradual increase during the forecast period.

Regional Analysis

Europe is estimated to contribute 30% to the growth of the global market during the forecast period.Technavio's analysts have elaborately explained the regional trends and drivers that shape the market during the forecast period.

Rugby Apparel Market Share by Geography

 Request Free Sample

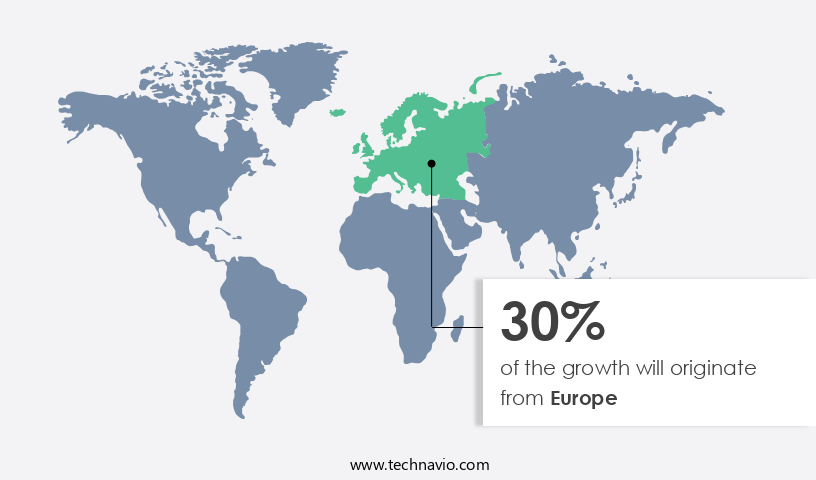
The market in Europe, home to the highest number of rugby players globally, is experiencing significant growth. Driven primarily by the UK, which accounts for over 30% of the world's rugby population, the market is fueled by the increasing participation of women and ethnic minorities in England. This growth is further propelled by the demand for rugby apparel, including waterproof jackets, rugby boots, and protective gear like elbow pads and shin guards. However, concerns over injuries, particularly concussions, are causing some to abandon the sport. Sponsorship deals and marketing campaigns from rugby clubs and sportswear brands, such as Canterbury by Pentland Brands and Adidas, play a crucial role in promoting the sport and driving sales.

Product innovation, including smart fabrics and moisture management technologies, is a key trend, as is the integration of wearable technology for performance tracking and injury prevention. Online shopping and e-commerce platforms are increasingly popular, with content marketing and social media marketing playing essential roles in fan engagement and brand loyalty. The market is also witnessing a shift towards sustainable materials and ethical sourcing. Competitor analysis and pricing strategies are critical factors for sportswear brands looking to gain a competitive edge. In the realm of amateur rugby, team kits and training apparel are in high demand, with performance wear and brand reputation being key considerations.

Distribution networks and supply chain management are essential for efficient delivery and customer experience. Influencer marketing and fashion trends are also influencing consumer preferences. Despite the challenges, the market is poised for continued growth, with a focus on improving athletic performance, customer experience, and injury prevention. Data analytics and search engine optimization are vital tools for brands looking to understand their customers and reach new audiences.

Market Dynamics

Our researchers analyzed the data with 2023 as the base year, along with the key drivers, trends, and challenges. A holistic analysis of drivers will help companies refine their marketing strategies to gain a competitive advantage.

The Global Rugby Apparel Market thrives with rugby jerseys for teams and performance rugby wear. Rugby apparel trends 2024 highlight moisture-wicking rugby fabrics and customized rugby uniforms. Rugby apparel for fans and rugby shorts for training drive demand, per rugby apparel market forecast. Eco-friendly rugby clothing leverages rugby apparel for youth leagues, while rugby gear for professional clubs ensures quality. Rugby apparel for retail and rugby socks for performance enhance accessibility. Rugby apparel for sustainability, advanced apparel technologies, and rugby apparel supply chain optimize growth. Rugby apparel for regulatory standards, rugby apparel for global markets, rugby apparel for brand loyalty, rugby apparel for player safety, and rugby apparel for B2B sectors fuel expansion through 2028.

What are the key market drivers leading to the rise in the adoption of Rugby Apparel Industry?

  • The transformation from a niche to mainstream sport serves as the primary catalyst for market growth. 
  • The market is experiencing significant growth due to the increasing popularity of the sport, particularly in regions where participation levels are lower, such as APAC. Fueling this trend is the inclusion of rugby in the Olympic Games 2022, which has brought more attention to the sport and attracted new fans. Additionally, the rise of development programs and increasing female participation are encouraging more rugby teams and clubs to form, leading to a greater demand for rugby apparel. Professional rugby teams and players are also driving the market through sponsorships and social media platforms. These influencer marketing strategies help to increase brand awareness and reach a wider audience.
  • Moreover, the growing trend of rugby apparel being sold at large retailers and online platforms is making it more accessible to consumers. Customer experience is a crucial factor in the market. Design trends, pricing strategies, and retail strategies are essential to meet the demands of consumers. Comfortable and functional shin guards and scrum caps are essential for players, while fashion trends influence the choices of casual consumers. Online retailers offer convenience and competitive pricing, making them a popular choice for many consumers. In conclusion, the market is poised for growth due to the increasing popularity of the sport, the influence of professional teams and players, and the accessibility of rugby apparel through various distribution networks.
  • The market dynamics, including design trends, pricing strategies, and retail strategies, are essential to meet the demands of consumers and maintain a positive customer experience.

What are the market trends shaping the Rugby Apparel Industry?

  • Digital and social media marketing is currently a significant market trend. This form of marketing utilizes online platforms, such as websites, social media channels, and search engines, to connect with and engage audiences.
  • The market has experienced significant growth due to technology integration and innovative product offerings. Sportswear brands, such as Nike, Adidas, and New Balance, have capitalized on this trend by incorporating smart fabrics, waterproof jackets, and hydration packs into their rugby apparel lines. These advancements cater to the needs of rugby fans, providing them with protective gear like elbow pads and rugby boots that enhance their performance and safety. Marketing campaigns on social media platforms,social media platforms, including Instagram, Facebook, and Twitter, have become essential tools for these brands to increase product visibility and reach a wider audience. These campaigns often emphasize themes of inclusivity and women's rugby participation.
  • By utilizing technology and social media, these brands have fostered a harmonious relationship with their customers, creating immersive experiences that strike a chord with rugby enthusiasts. Moreover, sponsorship deals with rugby schools and teams further strengthen the market's growth. As the popularity of rugby continues to surge, companies are investing in product innovation to cater to the evolving demands of rugby fans. The integration of technology and marketing strategies has proven to be a winning combination for these brands, ensuring their continued success in the market.

What challenges does the Rugby Apparel Industry face during its growth?

  • The expansion of anti-sweatshop campaigns poses a significant challenge to the growth of the industry. These campaigns, which aim to improve working conditions and labor rights in factories, have gained increasing momentum and can significantly impact the profitability and expansion plans of companies in the sector. 
  • The market is driven by various factors, including the increasing popularity of online shopping, content marketing, and sports marketing strategies. Consumers seek high-performance fabrics, such as wicking and moisture management materials, for improved athletic performance during games. Data analytics plays a significant role in understanding consumer preferences and tailoring marketing efforts accordingly. Rugby clubs and teams require team kits, often made from sustainable and ethical sources, to engage fans and promote a positive brand image. Recycled fabrics and ethical sourcing are becoming essential considerations for both consumers and clubs. Product reviews and competitor analysis are crucial for companies to stay competitive and meet evolving consumer demands.
  • Search engine optimization is essential for online retailers to attract and retain customers. Brands must focus on creating immersive and harmonious shopping experiences to strike a balance between athletic performance and fan engagement. Anti-sweatshop campaigns, which address labor inequalities and unacceptable working conditions, can impact brand reputation and consumer base if not addressed ethically. Overall, the market is dynamic and requires a strategic approach to meet the evolving needs of consumers and rugby clubs alike.

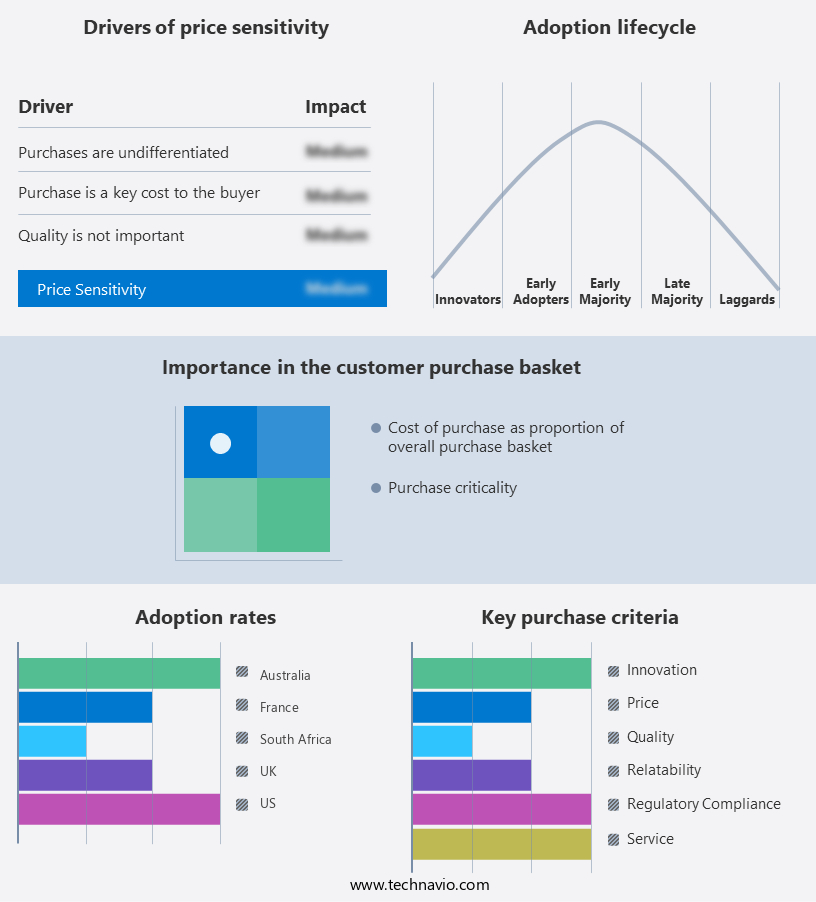
Exclusive Customer Landscape

The rugby apparel market forecasting report includes the adoption lifecycle of the market, covering from the innovator's stage to the laggard's stage. It focuses on adoption rates in different regions based on penetration. Furthermore, the rugby apparel market report also includes key purchase criteria and drivers of price sensitivity to help companies evaluate and develop their market growth analysis strategies.

Rugby Apparel Market Share by Geography

 Customer Landscape

Key Companies & Market Insights

Companies are implementing various strategies, such as strategic alliances, rugby apparel market forecast, partnerships, mergers and acquisitions, geographical expansion, and product/service launches, to enhance their presence in the industry.

Canterbury of New Zealand - This company specializes in providing high-quality rugby kits and teamwear for individuals of all genders and age groups. Our product offerings cater to the unique needs of rugby players, ensuring optimal performance and comfort during games. Through innovative design and advanced materials, we aim to elevate the rugby experience for athletes worldwide. Our commitment to excellence is reflected in every stitch and seam, making US a trusted partner for teams and individuals seeking top-tier rugby apparel.

The industry research and growth report includes detailed analyses of the competitive landscape of the market and information about key companies, including:

  • Canterbury of New Zealand
  • Gilbert Rugby
  • Macron S.p.A.
  • BLK Sport
  • KooGa Australia
  • Under Armour Inc.
  • Nike Inc.
  • Adidas America Inc.
  • Asics America Corporation
  • Mizuno USA Inc.
  • Castore
  • Lowe & Fletcher
  • VX3 Sportswear
  • Sondico
  • Kappa
  • Le Coq Sportif
  • Peak Pulse
  • First XV
  • Stormers Apparel
  • Paladin Sports

Qualitative and quantitative analysis of companies has been conducted to help clients understand the wider business environment as well as the strengths and weaknesses of key industry players. Data is qualitatively analyzed to categorize companies as pure play, category-focused, industry-focused, and diversified; it is quantitatively analyzed to categorize companies as dominant, leading, strong, tentative, and weak.

Recent Development and News in Rugby Apparel Market

  • In February 2024, Adidas unveiled its new rugby apparel collection, featuring advanced technologies such as Climachill and Climawarm, aiming to enhance player performance and comfort (Adidas Press Release, 2024). 
  • In May 2025, Under Armour announced a strategic partnership with the English Premiership Rugby club, Harlequins, to become their official kit supplier, expanding its presence in the European rugby market (Under Armour Press Release, 2025). 
  • In October 2024, Canterbury, a leading rugby apparel brand, secured a significant investment from private equity firm, EQT, to support its global growth plans and product innovation (Canterbury Press Release, 2024). 
  • In March 2025, World Rugby, the international governing body for rugby union and rugby sevens, introduced new regulations allowing teams to wear up to four advertising patches on their jerseys, opening opportunities for apparel brands to increase sponsorship deals (World Rugby Press Release, 2025).

Research Analyst Overview

In the dynamic rugby market, team ssports sponsorships play a significant role in rugby union and league, with brands seeking to align with top teams to boost their visibility. Rugby merchandising thrives during major tournaments, such as the Rugby World Cup and seven-a-side events, fueling demand for performance-optimized apparel. Player safety is a priority, with base layers and heat regulation technologies ensuring comfort and injury prevention. Six-nation rugby leagues and community engagement initiatives foster a strong fan culture. Seven-a-side rugby's popularity drives innovation in performance fabrics, catering to ball handling and strength training needs. Brands invest in sports psychology and brand ambassadors to enhance the rugby lifestyle experience.

The market continues to evolve, driven by the integration of technology and the shifting preferences of rugby fans. Sportswear brands are innovating with smart fabrics, wicking materials, and moisture management to enhance athletic performance and comfort. Online shopping platforms and content marketing strategies are transforming the consumer experience, while data analytics and search engine optimization optimize brand reach. Rugby clubs and schools are leveraging team kits and protective gear to strengthen their identity and ensure safety. Sponsorship deals and brand partnerships fuel industry growth, with waterproof jackets, hydration packs, and elbow pads becoming essential gear for players.

Tradition and heritage intertwine with technical fabrics, creating a unique blend in rugby apparel. Waterproof, breathable materials and injury prevention features cater to grassroots rugby players, while sports nutrition and compression wear support performance optimization. Rugby history and international matches continue to fuel the passion for this sport, keeping the market vibrant and diverse.

Dive into Technavio's robust research methodology, blending expert interviews, extensive data synthesis, and validated models for unparalleled Rugby Apparel Market insights. See full methodology.

Market Scope

Report Coverage

Details

Page number

156

Base year

2023

Historic period

2018-2022

Forecast period

2024-2028

Growth momentum & CAGR

Accelerate at a CAGR of 4.5%

Market growth 2024-2028

USD 354.8 million

Market structure

Fragmented

YoY growth 2023-2024(%)

4.23

Key countries

US, China, Germany, Canada, India, South Korea, France, Japan, Italy, Brazil, UAE, UK, Spain, and Mexico

Competitive landscape

Leading Companies, Market Positioning of Companies, Competitive Strategies, and Industry Risks

Request Free Sample

What are the Key Data Covered in this Rugby Apparel Market Research and Growth Report?

  • CAGR of the Rugby Apparel industry during the forecast period
  • Detailed information on factors that will drive the growth and forecasting between 2024 and 2028
  • Precise estimation of the size of the market and its contribution of the industry in focus to the parent market
  • Accurate predictions about upcoming growth and trends and changes in consumer behaviour
  • Growth of the market across Europe, APAC, North America, Middle East and Africa, and South America
  • Thorough analysis of the market's competitive landscape and detailed information about companies
  • Comprehensive analysis of factors that will challenge the rugby apparel market growth of industry companies

We can help! Our analysts can customize this rugby apparel market research report to meet your requirements.

Get in touch

1 Executive Summary

  • 1.1 Market overview
    • Executive Summary - Chart on Market Overview
    • Executive Summary - Data Table on Market Overview
    • Executive Summary - Chart on Global Market Characteristics
    • Executive Summary - Chart on Market by Geography
    • Executive Summary - Chart on Market Segmentation by End-user
    • Executive Summary - Chart on Market Segmentation by Distribution Channel
    • Executive Summary - Chart on Incremental Growth
    • Executive Summary - Data Table on Incremental Growth
    • Executive Summary - Chart on Company Market Positioning

2 Market Landscape

  • 2.1 Market ecosystem
    • Parent Market
    • Data Table on - Parent Market
  • 2.2 Market characteristics
    • Market characteristics analysis
  • 2.3 Value chain analysis
    • Value Chain Analysis

3 Market Sizing

  • 3.1 Market definition
    • Offerings of companies included in the market definition
  • 3.2 Market segment analysis
    • Market segments
  • 3.3 Market size 2023
    • 3.4 Market outlook: Forecast for 2023-2028
      • Chart on Global - Market size and forecast 2023-2028 ($ million)
      • Data Table on Global - Market size and forecast 2023-2028 ($ million)
      • Chart on Global Market: Year-over-year growth 2023-2028 (%)
      • Data Table on Global Market: Year-over-year growth 2023-2028 (%)

    4 Historic Market Size

    • 4.1 Global Rugby Apparel Market 2018 - 2022
      • Historic Market Size - Data Table on Global Rugby Apparel Market 2018 - 2022 ($ million)
    • 4.2 End-user segment analysis 2018 - 2022
      • Historic Market Size - End-user Segment 2018 - 2022 ($ million)
    • 4.3 Distribution Channel segment analysis 2018 - 2022
      • Historic Market Size - Distribution Channel Segment 2018 - 2022 ($ million)
    • 4.4 Geography segment analysis 2018 - 2022
      • Historic Market Size - Geography Segment 2018 - 2022 ($ million)
    • 4.5 Country segment analysis 2018 - 2022
      • Historic Market Size - Country Segment 2018 - 2022 ($ million)

    5 Five Forces Analysis

    • 5.1 Five forces summary
      • Five forces analysis - Comparison between 2023 and 2028
    • 5.2 Bargaining power of buyers
      • Bargaining power of buyers - Impact of key factors 2023 and 2028
    • 5.3 Bargaining power of suppliers
      • Bargaining power of suppliers - Impact of key factors in 2023 and 2028
    • 5.4 Threat of new entrants
      • Threat of new entrants - Impact of key factors in 2023 and 2028
    • 5.5 Threat of substitutes
      • Threat of substitutes - Impact of key factors in 2023 and 2028
    • 5.6 Threat of rivalry
      • Threat of rivalry - Impact of key factors in 2023 and 2028
    • 5.7 Market condition
      • Chart on Market condition - Five forces 2023 and 2028

    6 Market Segmentation by End-user

    • 6.1 Market segments
      • Chart on End-user - Market share (2023-2028) (%)
      • Data Table on End-user - Market share (2023-2028) (%)
    • 6.2 Comparison by End-user
      • Chart on Comparison by End-user
      • Data Table on Comparison by End-user
    • 6.3 Male - Market size and forecast (2023-2028)
      • Chart on Male - Market size and forecast (2023-2028) ($ million)
      • Data Table on Male - Market size and forecast (2023-2028) ($ million)
      • Chart on Male - Year-over-year growth (2023-2028) (%)
      • Data Table on Male - Year-over-year growth (2023-2028) (%)
    • 6.4 Female - Market size and forecast (2023-2028)
      • Chart on Female - Market size and forecast (2023-2028) ($ million)
      • Data Table on Female - Market size and forecast (2023-2028) ($ million)
      • Chart on Female - Year-over-year growth (2023-2028) (%)
      • Data Table on Female - Year-over-year growth (2023-2028) (%)
    • 6.5 Market opportunity by End-user
      • Market opportunity by End-user ($ million)
      • Data Table on Market opportunity by End-user ($ million)

    7 Market Segmentation by Distribution Channel

    • 7.1 Market segments
      • Chart on Distribution Channel - Market share (2023-2028) (%)
      • Data Table on Distribution Channel - Market share (2023-2028) (%)
    • 7.2 Comparison by Distribution Channel
      • Chart on Comparison by Distribution Channel
      • Data Table on Comparison by Distribution Channel
    • 7.3 Offline - Market size and forecast (2023-2028)
      • Chart on Offline - Market size and forecast (2023-2028) ($ million)
      • Data Table on Offline - Market size and forecast (2023-2028) ($ million)
      • Chart on Offline - Year-over-year growth (2023-2028) (%)
      • Data Table on Offline - Year-over-year growth (2023-2028) (%)
    • 7.4 Online - Market size and forecast (2023-2028)
      • Chart on Online - Market size and forecast (2023-2028) ($ million)
      • Data Table on Online - Market size and forecast (2023-2028) ($ million)
      • Chart on Online - Year-over-year growth (2023-2028) (%)
      • Data Table on Online - Year-over-year growth (2023-2028) (%)
    • 7.5 Market opportunity by Distribution Channel
      • Market opportunity by Distribution Channel ($ million)
      • Data Table on Market opportunity by Distribution Channel ($ million)

    8 Market Segmentation by Material

    • 8.1 Market segments
      • Chart on Material - Market share (2023-2028) (%)
      • Data Table on Material - Market share (2023-2028) (%)
    • 8.2 Comparison by Material
      • Chart on Comparison by Material
      • Data Table on Comparison by Material
    • 8.3 Polyester - Market size and forecast (2023-2028)
      • Chart on Polyester - Market size and forecast (2023-2028) ($ million)
      • Data Table on Polyester - Market size and forecast (2023-2028) ($ million)
      • Chart on Polyester - Year-over-year growth (2023-2028) (%)
      • Data Table on Polyester - Year-over-year growth (2023-2028) (%)
    • 8.4 Cotton - Market size and forecast (2023-2028)
      • Chart on Cotton - Market size and forecast (2023-2028) ($ million)
      • Data Table on Cotton - Market size and forecast (2023-2028) ($ million)
      • Chart on Cotton - Year-over-year growth (2023-2028) (%)
      • Data Table on Cotton - Year-over-year growth (2023-2028) (%)
    • 8.5 Blends - Market size and forecast (2023-2028)
      • Chart on Blends - Market size and forecast (2023-2028) ($ million)
      • Data Table on Blends - Market size and forecast (2023-2028) ($ million)
      • Chart on Blends - Year-over-year growth (2023-2028) (%)
      • Data Table on Blends - Year-over-year growth (2023-2028) (%)
    • 8.6 Performance Fabrics - Market size and forecast (2023-2028)
      • Chart on Performance Fabrics - Market size and forecast (2023-2028) ($ million)
      • Data Table on Performance Fabrics - Market size and forecast (2023-2028) ($ million)
      • Chart on Performance Fabrics - Year-over-year growth (2023-2028) (%)
      • Data Table on Performance Fabrics - Year-over-year growth (2023-2028) (%)
    • 8.7 Market opportunity by Material
      • Market opportunity by Material ($ million)
      • Data Table on Market opportunity by Material ($ million)

    9 Market Segmentation by Product Type

    • 9.1 Market segments
      • Chart on Product Type - Market share (2023-2028) (%)
      • Data Table on Product Type - Market share (2023-2028) (%)
    • 9.2 Comparison by Product Type
      • Chart on Comparison by Product Type
      • Data Table on Comparison by Product Type
    • 9.3 Jerseys - Market size and forecast (2023-2028)
      • Chart on Jerseys - Market size and forecast (2023-2028) ($ million)
      • Data Table on Jerseys - Market size and forecast (2023-2028) ($ million)
      • Chart on Jerseys - Year-over-year growth (2023-2028) (%)
      • Data Table on Jerseys - Year-over-year growth (2023-2028) (%)
    • 9.4 Shorts - Market size and forecast (2023-2028)
      • Chart on Shorts - Market size and forecast (2023-2028) ($ million)
      • Data Table on Shorts - Market size and forecast (2023-2028) ($ million)
      • Chart on Shorts - Year-over-year growth (2023-2028) (%)
      • Data Table on Shorts - Year-over-year growth (2023-2028) (%)
    • 9.5 Protective Gear - Market size and forecast (2023-2028)
      • Chart on Protective Gear - Market size and forecast (2023-2028) ($ million)
      • Data Table on Protective Gear - Market size and forecast (2023-2028) ($ million)
      • Chart on Protective Gear - Year-over-year growth (2023-2028) (%)
      • Data Table on Protective Gear - Year-over-year growth (2023-2028) (%)
    • 9.6 Socks - Market size and forecast (2023-2028)
      • Chart on Socks - Market size and forecast (2023-2028) ($ million)
      • Data Table on Socks - Market size and forecast (2023-2028) ($ million)
      • Chart on Socks - Year-over-year growth (2023-2028) (%)
      • Data Table on Socks - Year-over-year growth (2023-2028) (%)
    • 9.7 Market opportunity by Product Type
      • Market opportunity by Product Type ($ million)
      • Data Table on Market opportunity by Product Type ($ million)

    10 Customer Landscape

    • 10.1 Customer landscape overview
      • Analysis of price sensitivity, lifecycle, customer purchase basket, adoption rates, and purchase criteria

    11 Geographic Landscape

    • 11.1 Geographic segmentation
      • Chart on Market share by geography 2023-2028 (%)
      • Data Table on Market share by geography 2023-2028 (%)
    • 11.2 Geographic comparison
      • Chart on Geographic comparison
      • Data Table on Geographic comparison
    • 11.3 Europe - Market size and forecast (2023-2028)
      • Chart on Europe - Market size and forecast (2023-2028) ($ million)
      • Data Table on Europe - Market size and forecast (2023-2028) ($ million)
      • Chart on Europe - Year-over-year growth (2023-2028) (%)
      • Data Table on Europe - Year-over-year growth (2023-2028) (%)
      • Chart on Europe - Market size and forecast 2023-2028 ($ million)
      • Data Table on Europe - Market size and forecast 2023-2028 ($ million)
      • Chart on Europe - Year-over-year growth 2023-2028 (%)
      • Data Table on Europe - Year-over-year growth 2023-2028 (%)
    • 11.4 APAC - Market size and forecast (2023-2028)
      • Chart on APAC - Market size and forecast (2023-2028) ($ million)
      • Data Table on APAC - Market size and forecast (2023-2028) ($ million)
      • Chart on APAC - Year-over-year growth (2023-2028) (%)
      • Data Table on APAC - Year-over-year growth (2023-2028) (%)
      • Chart on APAC - Market size and forecast 2023-2028 ($ million)
      • Data Table on APAC - Market size and forecast 2023-2028 ($ million)
      • Chart on APAC - Year-over-year growth 2023-2028 (%)
      • Data Table on APAC - Year-over-year growth 2023-2028 (%)
    • 11.5 North America - Market size and forecast (2023-2028)
      • Chart on North America - Market size and forecast (2023-2028) ($ million)
      • Data Table on North America - Market size and forecast (2023-2028) ($ million)
      • Chart on North America - Year-over-year growth (2023-2028) (%)
      • Data Table on North America - Year-over-year growth (2023-2028) (%)
      • Chart on North America - Market size and forecast 2023-2028 ($ million)
      • Data Table on North America - Market size and forecast 2023-2028 ($ million)
      • Chart on North America - Year-over-year growth 2023-2028 (%)
      • Data Table on North America - Year-over-year growth 2023-2028 (%)
    • 11.6 Middle East and Africa - Market size and forecast (2023-2028)
      • Chart on Middle East and Africa - Market size and forecast (2023-2028) ($ million)
      • Data Table on Middle East and Africa - Market size and forecast (2023-2028) ($ million)
      • Chart on Middle East and Africa - Year-over-year growth (2023-2028) (%)
      • Data Table on Middle East and Africa - Year-over-year growth (2023-2028) (%)
      • Chart on Middle East and Africa - Market size and forecast 2023-2028 ($ million)
      • Data Table on Middle East and Africa - Market size and forecast 2023-2028 ($ million)
      • Chart on Middle East and Africa - Year-over-year growth 2023-2028 (%)
      • Data Table on Middle East and Africa - Year-over-year growth 2023-2028 (%)
    • 11.7 South America - Market size and forecast (2023-2028)
      • Chart on South America - Market size and forecast (2023-2028) ($ million)
      • Data Table on South America - Market size and forecast (2023-2028) ($ million)
      • Chart on South America - Year-over-year growth (2023-2028) (%)
      • Data Table on South America - Year-over-year growth (2023-2028) (%)
      • Chart on South America - Market size and forecast 2023-2028 ($ million)
      • Data Table on South America - Market size and forecast 2023-2028 ($ million)
      • Chart on South America - Year-over-year growth 2023-2028 (%)
      • Data Table on South America - Year-over-year growth 2023-2028 (%)
    • 11.8 US - Market size and forecast (2023-2028)
      • Chart on US - Market size and forecast (2023-2028) ($ million)
      • Data Table on US - Market size and forecast (2023-2028) ($ million)
      • Chart on US - Year-over-year growth (2023-2028) (%)
      • Data Table on US - Year-over-year growth (2023-2028) (%)
      • Chart on UK - Market size and forecast 2023-2028 ($ million)
      • Data Table on UK - Market size and forecast 2023-2028 ($ million)
      • Chart on UK - Year-over-year growth 2023-2028 (%)
      • Data Table on UK - Year-over-year growth 2023-2028 (%)
    • 11.9 China - Market size and forecast (2023-2028)
      • Chart on China - Market size and forecast (2023-2028) ($ million)
      • Data Table on China - Market size and forecast (2023-2028) ($ million)
      • Chart on China - Year-over-year growth (2023-2028) (%)
      • Data Table on China - Year-over-year growth (2023-2028) (%)
      • Chart on US - Market size and forecast 2023-2028 ($ million)
      • Data Table on US - Market size and forecast 2023-2028 ($ million)
      • Chart on US - Year-over-year growth 2023-2028 (%)
      • Data Table on US - Year-over-year growth 2023-2028 (%)
    • 11.10 Japan - Market size and forecast (2023-2028)
      • Chart on Japan - Market size and forecast (2023-2028) ($ million)
      • Data Table on Japan - Market size and forecast (2023-2028) ($ million)
      • Chart on Japan - Year-over-year growth (2023-2028) (%)
      • Data Table on Japan - Year-over-year growth (2023-2028) (%)
      • Chart on South Africa - Market size and forecast 2023-2028 ($ million)
      • Data Table on South Africa - Market size and forecast 2023-2028 ($ million)
      • Chart on South Africa - Year-over-year growth 2023-2028 (%)
      • Data Table on South Africa - Year-over-year growth 2023-2028 (%)
    • 11.11 Germany - Market size and forecast (2023-2028)
      • Chart on Germany - Market size and forecast (2023-2028) ($ million)
      • Data Table on Germany - Market size and forecast (2023-2028) ($ million)
      • Chart on Germany - Year-over-year growth (2023-2028) (%)
      • Data Table on Germany - Year-over-year growth (2023-2028) (%)
      • Chart on France - Market size and forecast 2023-2028 ($ million)
      • Data Table on France - Market size and forecast 2023-2028 ($ million)
      • Chart on France - Year-over-year growth 2023-2028 (%)
      • Data Table on France - Year-over-year growth 2023-2028 (%)
    • 11.12 France - Market size and forecast (2023-2028)
      • Chart on France - Market size and forecast (2023-2028) ($ million)
      • Data Table on France - Market size and forecast (2023-2028) ($ million)
      • Chart on France - Year-over-year growth (2023-2028) (%)
      • Data Table on France - Year-over-year growth (2023-2028) (%)
      • Chart on Australia - Market size and forecast 2023-2028 ($ million)
      • Data Table on Australia - Market size and forecast 2023-2028 ($ million)
      • Chart on Australia - Year-over-year growth 2023-2028 (%)
      • Data Table on Australia - Year-over-year growth 2023-2028 (%)
    • 11.13 Spain - Market size and forecast (2023-2028)
      • Chart on Spain - Market size and forecast (2023-2028) ($ million)
      • Data Table on Spain - Market size and forecast (2023-2028) ($ million)
      • Chart on Spain - Year-over-year growth (2023-2028) (%)
      • Data Table on Spain - Year-over-year growth (2023-2028) (%)
      • Market opportunity by geography ($ million)
      • Data Tables on Market opportunity by geography ($ million)
    • 11.14 Canada - Market size and forecast (2023-2028)
      • Chart on Canada - Market size and forecast (2023-2028) ($ million)
      • Data Table on Canada - Market size and forecast (2023-2028) ($ million)
      • Chart on Canada - Year-over-year growth (2023-2028) (%)
      • Data Table on Canada - Year-over-year growth (2023-2028) (%)
    • 11.15 India - Market size and forecast (2023-2028)
      • Chart on India - Market size and forecast (2023-2028) ($ million)
      • Data Table on India - Market size and forecast (2023-2028) ($ million)
      • Chart on India - Year-over-year growth (2023-2028) (%)
      • Data Table on India - Year-over-year growth (2023-2028) (%)
    • 11.16 South Korea - Market size and forecast (2023-2028)
      • Chart on South Korea - Market size and forecast (2023-2028) ($ million)
      • Data Table on South Korea - Market size and forecast (2023-2028) ($ million)
      • Chart on South Korea - Year-over-year growth (2023-2028) (%)
      • Data Table on South Korea - Year-over-year growth (2023-2028) (%)
    • 11.17 France - Market size and forecast (2023-2028)
      • Chart on France - Market size and forecast (2023-2028) ($ million)
      • Data Table on France - Market size and forecast (2023-2028) ($ million)
      • Chart on France - Year-over-year growth (2023-2028) (%)
      • Data Table on France - Year-over-year growth (2023-2028) (%)
    • 11.18 Japan - Market size and forecast (2023-2028)
      • Chart on Japan - Market size and forecast (2023-2028) ($ million)
      • Data Table on Japan - Market size and forecast (2023-2028) ($ million)
      • Chart on Japan - Year-over-year growth (2023-2028) (%)
      • Data Table on Japan - Year-over-year growth (2023-2028) (%)
    • 11.19 Italy - Market size and forecast (2023-2028)
      • Chart on Italy - Market size and forecast (2023-2028) ($ million)
      • Data Table on Italy - Market size and forecast (2023-2028) ($ million)
      • Chart on Italy - Year-over-year growth (2023-2028) (%)
      • Data Table on Italy - Year-over-year growth (2023-2028) (%)
    • 11.20 Brazil - Market size and forecast (2023-2028)
      • Chart on Brazil - Market size and forecast (2023-2028) ($ million)
      • Data Table on Brazil - Market size and forecast (2023-2028) ($ million)
      • Chart on Brazil - Year-over-year growth (2023-2028) (%)
      • Data Table on Brazil - Year-over-year growth (2023-2028) (%)
    • 11.21 UAE - Market size and forecast (2023-2028)
      • Chart on UAE - Market size and forecast (2023-2028) ($ million)
      • Data Table on UAE - Market size and forecast (2023-2028) ($ million)
      • Chart on UAE - Year-over-year growth (2023-2028) (%)
      • Data Table on UAE - Year-over-year growth (2023-2028) (%)
    • 11.22 UK - Market size and forecast (2023-2028)
      • Chart on UK - Market size and forecast (2023-2028) ($ million)
      • Data Table on UK - Market size and forecast (2023-2028) ($ million)
      • Chart on UK - Year-over-year growth (2023-2028) (%)
      • Data Table on UK - Year-over-year growth (2023-2028) (%)
    • 11.23 Spain - Market size and forecast (2023-2028)
      • Chart on Spain - Market size and forecast (2023-2028) ($ million)
      • Data Table on Spain - Market size and forecast (2023-2028) ($ million)
      • Chart on Spain - Year-over-year growth (2023-2028) (%)
      • Data Table on Spain - Year-over-year growth (2023-2028) (%)
    • 11.24 Rest of World (ROW) - Market size and forecast (2023-2028)
      • Chart on Rest of World (ROW) - Market size and forecast (2023-2028) ($ million)
      • Data Table on Rest of World (ROW) - Market size and forecast (2023-2028) ($ million)
      • Chart on Rest of World (ROW) - Year-over-year growth (2023-2028) (%)
      • Data Table on Rest of World (ROW) - Year-over-year growth (2023-2028) (%)
    • 11.25 Mexico - Market size and forecast (2023-2028)
      • Chart on Mexico - Market size and forecast (2023-2028) ($ million)
      • Data Table on Mexico - Market size and forecast (2023-2028) ($ million)
      • Chart on Mexico - Year-over-year growth (2023-2028) (%)
      • Data Table on Mexico - Year-over-year growth (2023-2028) (%)

    12 Drivers, Challenges, and Opportunity/Restraints

    • 12.1 Market drivers
      • 12.2 Market challenges
        • 12.3 Impact of drivers and challenges
          • Impact of drivers and challenges in 2023 and 2028
        • 12.4 Market opportunities/restraints

          13 Competitive Landscape

          • 13.1 Overview
            • 13.2 Competitive Landscape
              • Overview on criticality of inputs and factors of differentiation
            • 13.3 Landscape disruption
              • Overview on factors of disruption
            • 13.4 Industry risks
              • Impact of key risks on business

            14 Competitive Analysis

            • 14.1 Companies profiled
              • Companies covered
            • 14.2 Market positioning of companies
              • Matrix on companies position and classification
            • 14.3 Canterbury of New Zealand
              • Canterbury of New Zealand - Overview
              • Canterbury of New Zealand - Product / Service
              • Canterbury of New Zealand - Key offerings
            • 14.4 Gilbert Rugby
              • Gilbert Rugby - Overview
              • Gilbert Rugby - Product / Service
              • Gilbert Rugby - Key offerings
            • 14.5 Macron S.p.A.
              • Macron S.p.A. - Overview
              • Macron S.p.A. - Product / Service
              • Macron S.p.A. - Key offerings
            • 14.6 BLK Sport
              • BLK Sport - Overview
              • BLK Sport - Product / Service
              • BLK Sport - Key offerings
            • 14.7 KooGa Australia
              • KooGa Australia - Overview
              • KooGa Australia - Product / Service
              • KooGa Australia - Key offerings
            • 14.8 Under Armour Inc.
              • Under Armour Inc. - Overview
              • Under Armour Inc. - Product / Service
              • Under Armour Inc. - Key offerings
            • 14.9 Nike Inc.
              • Nike Inc. - Overview
              • Nike Inc. - Product / Service
              • Nike Inc. - Key offerings
            • 14.10 Adidas America Inc.
              • Adidas America Inc. - Overview
              • Adidas America Inc. - Product / Service
              • Adidas America Inc. - Key offerings
            • 14.11 Asics America Corporation
              • Asics America Corporation - Overview
              • Asics America Corporation - Product / Service
              • Asics America Corporation - Key offerings
            • 14.12 Mizuno USA Inc.
              • Mizuno USA Inc. - Overview
              • Mizuno USA Inc. - Product / Service
              • Mizuno USA Inc. - Key offerings
            • 14.13 Castore
              • Castore - Overview
              • Castore - Product / Service
              • Castore - Key offerings
            • 14.14 Lowe & Fletcher
              • Lowe & Fletcher - Overview
              • Lowe & Fletcher - Product / Service
              • Lowe & Fletcher - Key offerings
            • 14.15 VX3 Sportswear
              • VX3 Sportswear - Overview
              • VX3 Sportswear - Product / Service
              • VX3 Sportswear - Key offerings
            • 14.16 Sondico
              • Sondico - Overview
              • Sondico - Product / Service
              • Sondico - Key offerings
            • 14.17 Kappa
              • Kappa - Overview
              • Kappa - Product / Service
              • Kappa - Key offerings
            • 14.18 Le Coq Sportif
              • Le Coq Sportif - Overview
              • Le Coq Sportif - Product / Service
              • Le Coq Sportif - Key offerings
            • 14.19 Peak Pulse
              • Peak Pulse - Overview
              • Peak Pulse - Product / Service
              • Peak Pulse - Key offerings
            • 14.20 First XV
              • First XV - Overview
              • First XV - Product / Service
              • First XV - Key offerings
            • 14.21 Stormers Apparel
              • Stormers Apparel - Overview
              • Stormers Apparel - Product / Service
              • Stormers Apparel - Key offerings
            • 14.22 Paladin Sports
              • Paladin Sports - Overview
              • Paladin Sports - Product / Service
              • Paladin Sports - Key offerings

            15 Appendix

            • 15.1 Scope of the report
              • 15.2 Inclusions and exclusions checklist
                • Inclusions checklist
                • Exclusions checklist
              • 15.3 Currency conversion rates for US$
                • Currency conversion rates for US$
              • 15.4 Research methodology
                • Research methodology
              • 15.5 Data procurement
                • Information sources
              • 15.6 Data validation
                • Data validation
              • 15.7 Validation techniques employed for market sizing
                • Validation techniques employed for market sizing
              • 15.8 Data synthesis
                • Data synthesis
              • 15.9 360 degree market analysis
                • 360 degree market analysis
              • 15.10 List of abbreviations
                • List of abbreviations

              Research Methodology

              Technavio presents a detailed picture of the market by way of study, synthesis, and summation of data from multiple sources. The analysts have presented the various facets of the market with a particular focus on identifying the key industry influencers. The data thus presented is comprehensive, reliable, and the result of extensive research, both primary and secondary.

              INFORMATION SOURCES

              Primary sources

              • Manufacturers and suppliers
              • Channel partners
              • Industry experts
              • Strategic decision makers

              Secondary sources

              • Industry journals and periodicals
              • Government data
              • Financial reports of key industry players
              • Historical data
              • Press releases

              DATA ANALYSIS

              Data Synthesis

              • Collation of data
              • Estimation of key figures
              • Analysis of derived insights

              Data Validation

              • Triangulation with data models
              • Reference against proprietary databases
              • Corroboration with industry experts

              REPORT WRITING

              Qualitative

              • Market drivers
              • Market challenges
              • Market trends
              • Five forces analysis

              Quantitative

              • Market size and forecast
              • Market segmentation
              • Geographical insights
              • Competitive landscape

              Interested in this report?

              Get your sample now to see our research methodology and insights!

              Download Now

              Frequently Asked Questions

              Rugby Apparel market growth will increase by $ 354.8 mn during 2024-2028.

              The Rugby Apparel market is expected to grow at a CAGR of 4.5% during 2024-2028.

              Rugby Apparel market is segmented by End-user( Male, Female) Distribution Channel( Offline, Online)

              Canterbury of New Zealand, Gilbert Rugby, Macron S.p.A., BLK Sport, KooGa Australia, Under Armour Inc., Nike Inc., Adidas America Inc., Asics America Corporation, Mizuno USA Inc., Castore, Lowe & Fletcher, VX3 Sportswear, Sondico, Kappa, Le Coq Sportif, Peak Pulse, First XV, Stormers Apparel, Paladin Sports are a few of the key vendors in the Rugby Apparel market.

              Europe will register the highest growth rate of 30% among the other regions. Therefore, the Rugby Apparel market in Europe is expected to garner significant business opportunities for the vendors during the forecast period.

              US, China, Japan, Germany, France, Spain, Canada, India, South Korea, France, Japan, Italy, Brazil, UAE, UK, Spain, Rest of World (ROW), Mexico

              • Transformation from niche to mainstream sportSports such as football is the driving factor this market.
              • basketball is the driving factor this market.
              • hockey is the driving factor this market.
              • and baseball are more popular based on participation statistics. Rugby is also evolving into a mainstream sport is the driving factor this market.
              • owing to its inclusion in the Olympic Games 2022. Due to the prominence of development programs and an increase in female participation due to prevailing awareness is the driving factor this market.
              • more rugby teams and clubs are inclined toward the sport. There is also a relative growth in social media platforms is the driving factor this market.
              • professional sponsorships is the driving factor this market.
              • and the prominence of rugby apparel being sold at large retailers. These aspects are expected to increase awareness among people about the sport that can help the sport reach mainstream popularity is the driving factor this market.
              • especially in APAC countries is the driving factor this market.
              • where the participation level is relatively low when compared with the Americas and MEA. While the market in Europe would continue dominating and growing during the forecast period is the driving factor this market.
              • the market in APAC and the Americas is expected to witness considerable growth during the forecast period. is the driving factor this market.

              The Rugby Apparel market vendors should focus on grabbing business opportunities from the Male segment as it accounted for the largest market share in the base year.
              RIA - Research AI Assistant
              Ask RIA