Salmon Market Analysis, Size, and Forecast 2026-2030: APAC (China, Japan, and India), Europe (UK, France, and Italy), North America (US, Canada, and Mexico), South America (Brazil and Argentina), Middle East and Africa (UAE, Saudi Arabia, and South Africa), and Rest of World (ROW)

Salmon Market Analysis, Size, and Forecast 2026-2030:
APAC (China, Japan, and India), Europe (UK, France, and Italy), North America (US, Canada, and Mexico), South America (Brazil and Argentina), Middle East and Africa (UAE, Saudi Arabia, and South Africa), and Rest of World (ROW)

Published: Jan 2026 281 Pages SKU: IRTNTR74128

Market Overview at a Glance

$5.93 B
Market Opportunity
4.6%
CAGR 2025 - 2030
44.2%
APAC Growth
$19.63 B
Offline segment 2024

Salmon Market Size 2026-2030

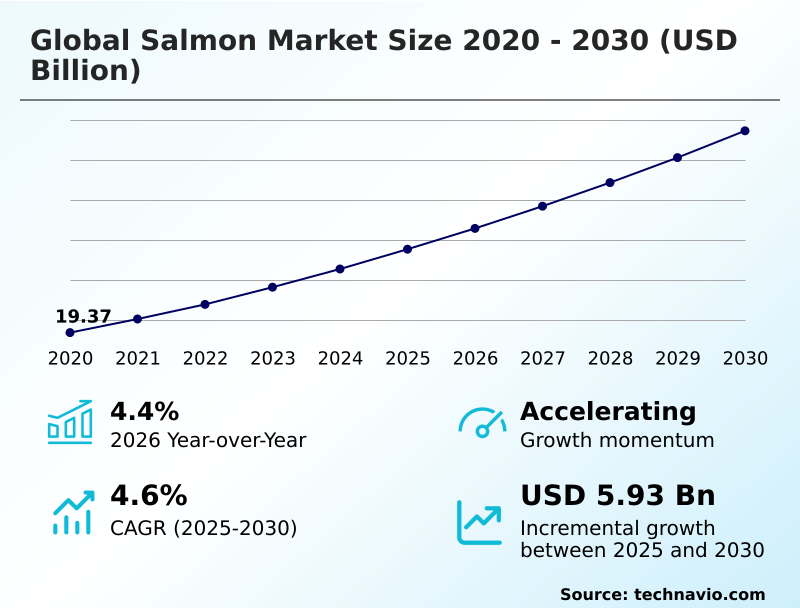
The salmon market size is valued to increase by USD 5.93 billion, at a CAGR of 4.6% from 2025 to 2030. Rising health consciousness will drive the salmon market.

Major Market Trends & Insights

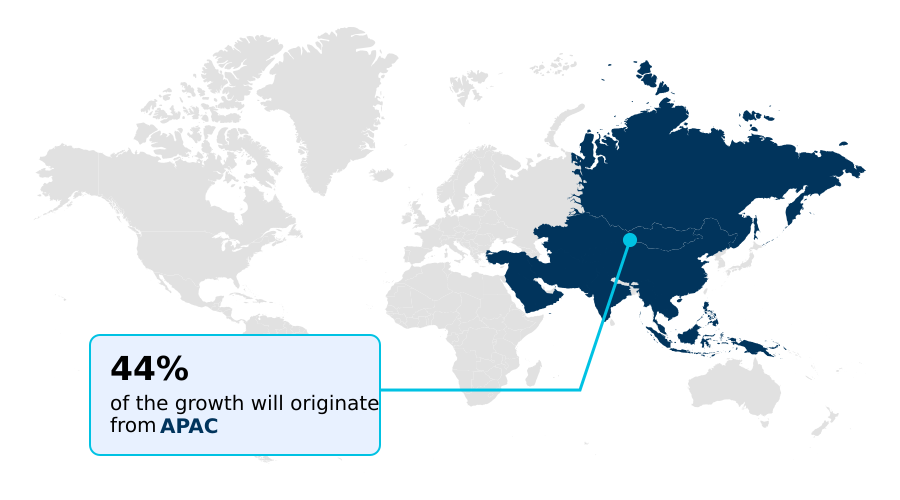
  • APAC dominated the market and accounted for a 44.2% growth during the forecast period.
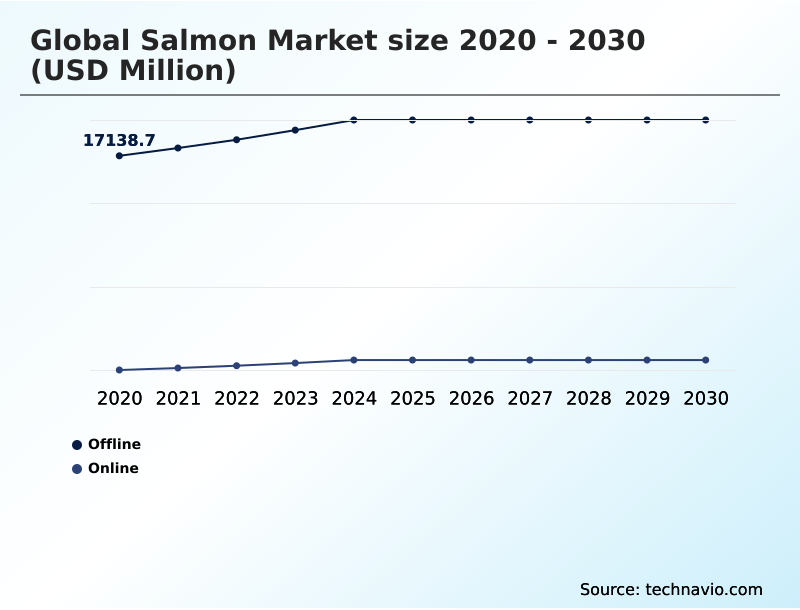
  • By Distribution Channel - Offline segment was valued at USD 19.63 billion in 2024
  • By Product Type - Fresh segment accounted for the largest market revenue share in 2024

Market Size & Forecast

  • Market Opportunities: USD 10.09 billion
  • Market Future Opportunities: USD 5.93 billion
  • CAGR from 2025 to 2030 : 4.6%

Market Summary

  • The salmon market is defined by a complex interplay of aquaculture innovation and evolving consumer preferences. Growth is fueled by heightened health consciousness, with consumers actively seeking nutrient-rich proteins high in omega-3 fatty acids. This has led to a significant trend where consumer trends driving organic salmon demand and sustainably sourced products are reshaping retail and foodservice strategies.
  • However, the industry grapples with significant operational hurdles. The impact of feed costs on salmon profitability is a primary concern, as fluctuations in raw material prices for fishmeal and plant proteins directly squeeze margins.
  • For instance, a vertically integrated producer must constantly re-evaluate its feed formulation strategies to balance cost, growth rates, and final product quality, a decision that affects the entire supply chain from hatchery to market. Furthermore, stringent environmental regulations and the biological risks associated with disease management in high-density farming operations add layers of complexity.
  • The market's future trajectory hinges on balancing these production challenges with the robust, health-driven demand for both farmed and wild-caught salmon. Success will depend on technological advancements in areas like recirculating aquaculture systems and alternative feed ingredients.

What will be the Size of the Salmon Market during the forecast period?

Get Key Insights on Market Forecast (PDF) Request Free Sample

How is the Salmon Market Segmented?

The salmon industry research report provides comprehensive data (region-wise segment analysis), with forecasts and estimates in "USD million" for the period 2026-2030, as well as historical data from 2020-2024 for the following segments.

  • Distribution channel
    • Offline
    • Online
  • Product type
    • Fresh
    • Frozen
    • Processed
  • End-user
    • Foodservice
    • Retail
    • Industrial or processed food
  • Geography
    • APAC
      • China
      • Japan
      • India
    • Europe
      • UK
      • France
      • Italy
    • North America
      • US
      • Canada
      • Mexico
    • South America
      • Brazil
      • Argentina
    • Middle East and Africa
      • UAE
      • Saudi Arabia
      • South Africa
    • Rest of World (ROW)

By Distribution Channel Insights

The offline segment is estimated to witness significant growth during the forecast period.

Market segmentation reflects diverse consumer needs and ongoing seafood industry innovations. The fresh segment, dominated by fish displaying ideal anadromous fish characteristics, holds the largest share due to preferences in foodservice and retail.

The processed seafood market segment is expanding through new product forms. Distribution is split between offline channels, where consumers assess quality firsthand, and growing online platforms.

Aquaculture investment trends show a significant shift toward advanced salmon farming technology and aquaculture technology like enhanced aquaculture effluent treatment systems. A key focus is on seafood traceability solutions, which address major seafood industry challenges around authenticity.

Looking forward, emerging segments like precision fermentation seafood and cell-cultured seafood represent long-term disruptive forces that could redefine the ray-finned fish classification market landscape.

Request Free Sample

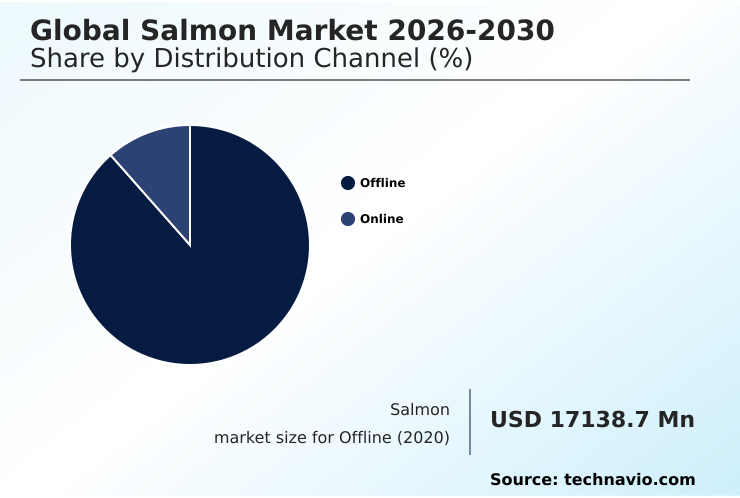
The Offline segment was valued at USD 19.63 billion in 2024 and showed a gradual increase during the forecast period.

Request Free Sample

Regional Analysis

APAC is estimated to contribute 44.2% to the growth of the global market during the forecast period.Technavio’s analysts have elaborately explained the regional trends and drivers that shape the market during the forecast period.

See How Salmon Market Demand is Rising in APAC Request Free Sample

The geographic landscape is shaped by varied regional seafood market dynamics. APAC is a growth engine, driven by rising demand that supports both offline seafood sales and a burgeoning online salmon delivery market.

The region is also a hub for investment in land-based aquaculture projects using recirculating aquaculture systems to ensure a stable supply of aquatic product offerings.

In Europe, the focus is on optimizing existing production through genetic management in aquaculture and advanced post-smolt strategies. North American producers leverage sophisticated cold chain infrastructure and frozen seafood logistics to serve a mature market.

Meanwhile, producers in key regions are pioneering technologies like submerged cage technology, which have been shown to improve fish welfare and cut mortality rates by 15%, demonstrating a clear trend toward technological solutions for sustainable growth, including for industrial processed food.

Market Dynamics

Our researchers analyzed the data with 2025 as the base year, along with the key drivers, trends, and challenges. A holistic analysis of drivers will help companies refine their marketing strategies to gain a competitive advantage.

  • The global salmon market is navigating a complex environment where strategic decisions are heavily influenced by several interconnected factors. A primary concern is the impact of feed costs on salmon profitability, forcing producers to explore alternative proteins.
  • Simultaneously, consumer trends driving organic salmon demand are pushing for more sustainable and transparent production methods, making sustainability certifications for farmed salmon a key differentiator. The role of omega-3 in seafood market growth cannot be overstated, as health consciousness driving seafood consumption continues to fuel demand.
  • Operationally, the industry is focused on innovations in recirculating aquaculture systems to overcome the limitations and environmental concerns of traditional methods. This is particularly relevant given the challenges in skilled labor for aquaculture. A critical debate involves the comparison of fresh vs frozen salmon quality, where advancements in freezing technology are closing the gap.
  • From a supply chain perspective, ensuring efficient supply chain logistics for fresh salmon is paramount, especially with the expansion of growth of online salmon distribution channels. The industry also faces stringent regulations in wild salmon capture, which impacts supply and pricing. Moreover, technological advancements in salmon processing are creating new opportunities for the market potential for value-added salmon products.
  • One area seeing significant investment is the development of traceability systems in the seafood industry. Companies adopting advanced traceability have reported a 25% faster response time to recall events compared to those with manual systems.
  • Looking ahead, the future of cell-cultured salmon substitutes presents both a challenge and an opportunity, while the comparison of land-based farming vs open net pen continues to shape long-term investment strategies. Producers must also master managing biological risks in salmon farming and make strategic investment in post-smolt production facilities to improve survival rates.
  • Finally, understanding the regional demand for different salmon species and the impact of el nino on fishmeal supply is crucial for navigating market volatility.

What are the key market drivers leading to the rise in the adoption of Salmon Industry?

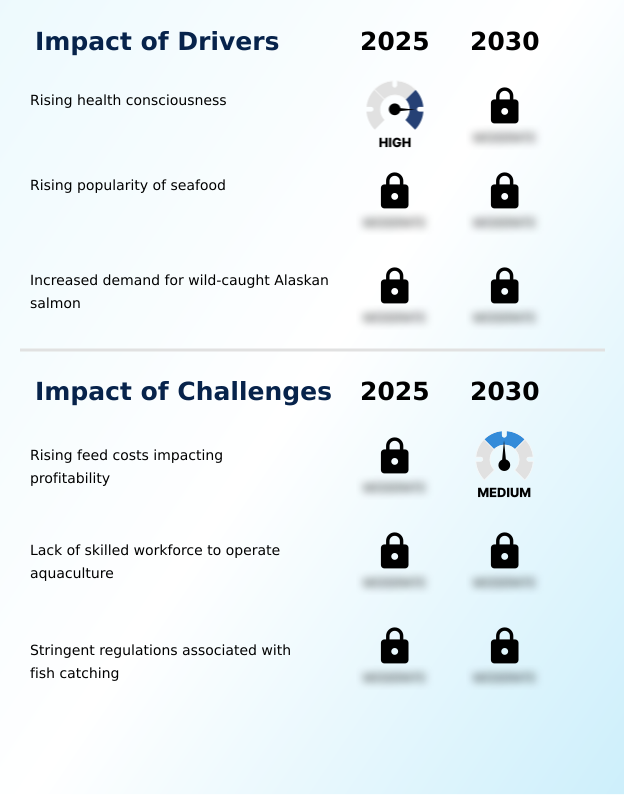
  • Rising health consciousness among consumers is a key driver propelling market growth.

  • Market growth is fundamentally driven by shifting consumer dietary preferences toward nutrient-rich seafood. Salmon, a prime lean protein source, aligns perfectly with health-focused trends like keto and mediterranean diets.
  • This is fueling demand across channels, from foodservice salmon sourcing to retail. To meet this demand, producers are refining aquaculture farming techniques while balancing supply from wild-capture fisheries.
  • The emphasis on salmon farming sustainability is critical, with sustainability certifications becoming a key purchasing criterion. These certifications improve market access and can lead to a 5% price premium.
  • Enhanced supply chain traceability is also vital for verifying the origin of different salmonid family species, whether it's premium tasmanian atlantic salmon or a comparison of atlantic salmon vs coho salmon.

What are the market trends shaping the Salmon Industry?

  • The robust demand for omega-3 fatty acids is an influential trend shaping the market, driven by consumer prioritization of functional foods and nutraceuticals.

  • Key trends are shaping the market, driven by rising seafood consumption trends and strong organic salmon demand. The focus on the health benefits of salmon has led to innovative omega-3 wellness programs and a preference for heart-healthy food choices, boosting sales of retail salmon products.
  • This has spurred innovation in value-added processing, with a wider array of marinated salmon fillets and smoked salmon varieties available. The debate over fresh vs frozen salmon continues, but advancements in freezing are improving quality.
  • The growth in packaged meat consumption is also influencing the development of new processed salmon products, while demand for high-quality, sushi-grade salmon remains robust, with some specialty retailers seeing a 20% year-over-year increase in this category.

What challenges does the Salmon Industry face during its growth?

  • Rising feed costs, which significantly impact profitability, present a key challenge to industry growth.

  • The industry faces significant challenges, led by salmon price volatility linked to operational costs. Detailed salmon feed cost analysis reveals that prices for key ingredients like fishmeal and fish oil are a primary concern, prompting a search for viable alternative seafood proteins and plant-based protein feed.
  • Concurrently, the environmental impact of aquaculture from traditional open net pen operations is under scrutiny. Effective biological risk mitigation is crucial, requiring robust disease management protocols to handle gill health issues and persistent sea lice combat, which can impact feed conversion ratio by up to 12%.
  • Furthermore, a deficit in aquaculture workforce skills and increasingly stringent fish catching regulations for wild stocks add layers of complexity, constraining supply and impacting profitability across the sector.

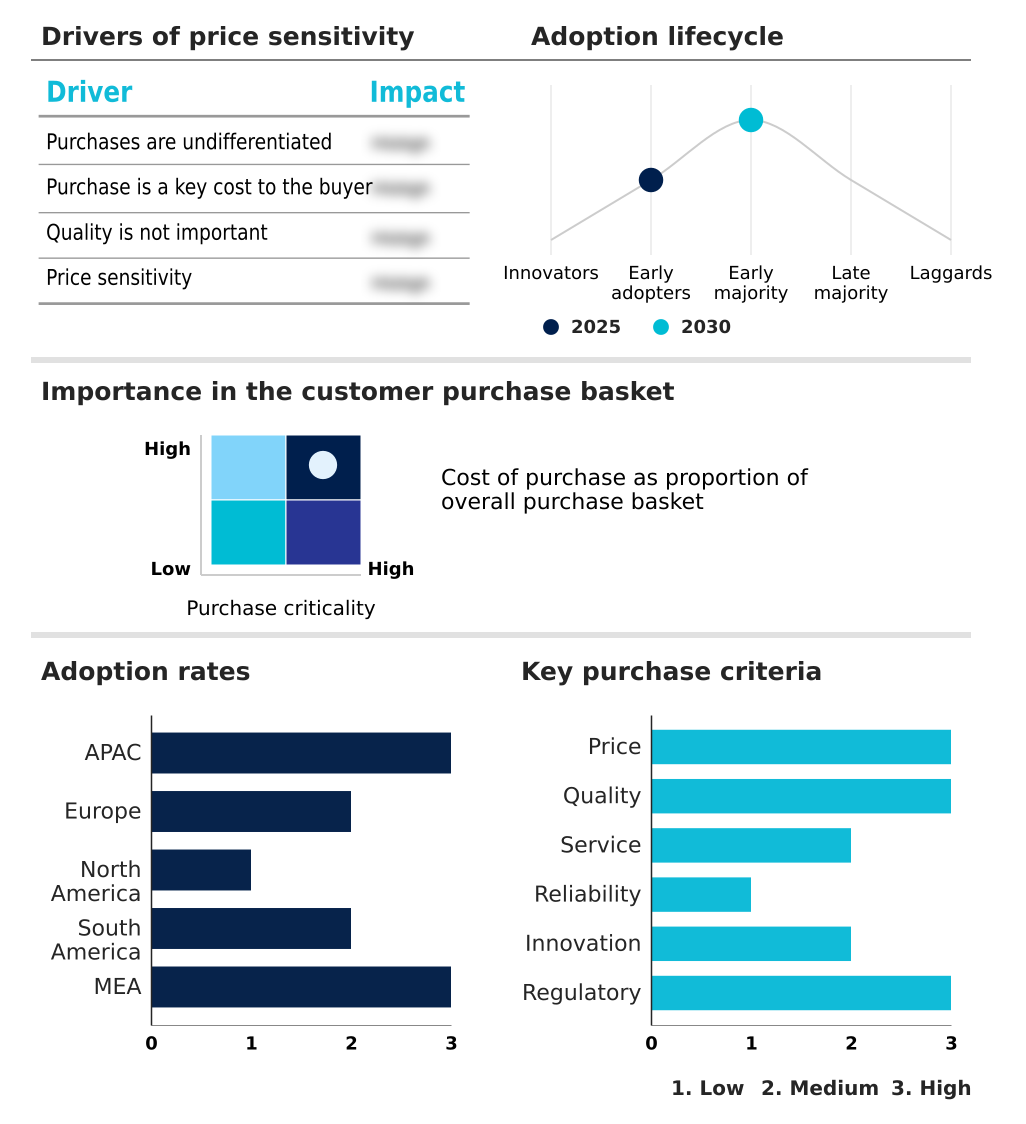
Exclusive Technavio Analysis on Customer Landscape

The salmon market forecasting report includes the adoption lifecycle of the market, covering from the innovator’s stage to the laggard’s stage. It focuses on adoption rates in different regions based on penetration. Furthermore, the salmon market report also includes key purchase criteria and drivers of price sensitivity to help companies evaluate and develop their market growth analysis strategies.

Customer Landscape of Salmon Industry

Competitive Landscape

Companies are implementing various strategies, such as strategic alliances, salmon market forecast, partnerships, mergers and acquisitions, geographical expansion, and product/service launches, to enhance their presence in the industry.

Agrosuper SA - A diversified portfolio includes distinct Atlantic and Pacific salmon varieties, targeting domestic and export channels through specialized, branded product lines.

The industry research and growth report includes detailed analyses of the competitive landscape of the market and information about key companies, including:

  • Agrosuper SA
  • Alsaker Fjordbruk AS
  • AquaChile
  • Austevoll Seafood ASA
  • BLUMAR
  • Captainfresh
  • Cermaq Group
  • Cooke Aquaculture Inc.
  • Grieg Seafood ASA
  • Huon Aquaculture
  • Leroy Seafood Group ASA
  • Mowi ASA
  • Multiexport Foods S.A.
  • Nordlaks
  • PF Bakkafrost
  • SalMar ASA

Qualitative and quantitative analysis of companies has been conducted to help clients understand the wider business environment as well as the strengths and weaknesses of key industry players. Data is qualitatively analyzed to categorize companies as pure play, category-focused, industry-focused, and diversified; it is quantitatively analyzed to categorize companies as dominant, leading, strong, tentative, and weak.

Recent Development and News in Salmon market

  • In August 2024, Leroy Seafood Group ASA successfully harvested its first batch of salmon using advanced submerged cage technology designed to combat sea lice.
  • In November 2024, Mowi ASA strengthened its position in Northern Norway by acquiring a controlling stake in the aquaculture firm Nova Sea.
  • In March 2025, SalMar ASA consolidated its focus on offshore aquaculture by transitioning SalMar Aker Ocean into a wholly owned subsidiary.
  • In May 2025, Mowi launched its premium 'Mowi Signature' line of fresh, never-frozen Atlantic salmon, specifically tailored for the US foodservice market.

Dive into Technavio’s robust research methodology, blending expert interviews, extensive data synthesis, and validated models for unparalleled Salmon Market insights. See full methodology.

Market Scope
Page number 281
Base year 2025
Historic period 2020-2024
Forecast period 2026-2030
Growth momentum & CAGR Accelerate at a CAGR of 4.6%
Market growth 2026-2030 USD 5927.2 million
Market structure Fragmented
YoY growth 2025-2026(%) 4.4%
Key countries China, Japan, India, South Korea, Australia, Indonesia, Belgium, UK, France, Denmark, Italy, The Netherlands, US, Canada, Mexico, Brazil, Chile, Argentina, UAE, Saudi Arabia, South Africa, Turkey and Morocco
Competitive landscape Leading Companies, Market Positioning of Companies, Competitive Strategies, and Industry Risks

Request Free Sample

Research Analyst Overview

  • The salmon market is undergoing a significant transformation, moving beyond traditional wild-capture fisheries toward sophisticated aquaculture farming techniques. At the core of this shift are recirculating aquaculture systems and other forms of land-based salmon farming, which promise greater control over production and biological risk mitigation.
  • Producers are focused on the genetic management in aquaculture of salmonid family species to enhance desirable traits, such as high omega-3 fatty acid content and resilience to common gill health issues. A critical boardroom decision revolves around investment in post-smolt strategies, which can reduce at-sea mortality.
  • For instance, farms implementing advanced submerged cage technology have achieved a 15% reduction in treatment costs. Feed composition, including fishmeal and fish oil versus plant-based protein feed, remains a pivotal cost factor, influencing the entire operational model from feed conversion ratio to aquaculture effluent treatment.
  • The push for sustainable aquaculture practices is paramount, impacting everything from sourcing to the final processed salmon products.
  • Firms that master disease management protocols and invest in superior cold chain infrastructure are better positioned to deliver high-quality sushi-grade salmon and other value-added processing items, ultimately defining their competitive edge in a market increasingly shaped by both technological innovation and consumer demands for transparency through robust supply chain traceability.
  • The industry is also watching the development of precision fermentation seafood and cell-cultured seafood as potential long-term disruptors to traditional open net pen operations.

What are the Key Data Covered in this Salmon Market Research and Growth Report?

  • What is the expected growth of the Salmon Market between 2026 and 2030?

    • USD 5.93 billion, at a CAGR of 4.6%

  • What segmentation does the market report cover?

    • The report is segmented by Distribution Channel (Offline, and Online), Product Type (Fresh, Frozen, and Processed), End-user (Foodservice, Retail, and Industrial or processed food) and Geography (APAC, Europe, North America, South America, Middle East and Africa)

  • Which regions are analyzed in the report?

    • APAC, Europe, North America, South America and Middle East and Africa

  • What are the key growth drivers and market challenges?

    • Rising health consciousness, Rising feed costs impacting profitability

  • Who are the major players in the Salmon Market?

    • Agrosuper SA, Alsaker Fjordbruk AS, AquaChile, Austevoll Seafood ASA, BLUMAR, Captainfresh, Cermaq Group, Cooke Aquaculture Inc., Grieg Seafood ASA, Huon Aquaculture, Leroy Seafood Group ASA, Mowi ASA, Multiexport Foods S.A., Nordlaks, PF Bakkafrost and SalMar ASA

Market Research Insights

  • The market is driven by evolving consumer dietary preferences and a clear pivot toward heart-healthy food choices. The rising popularity of keto and mediterranean diets has significantly boosted demand, with some retailers reporting a 15% increase in salmon sales velocity when marketed with health-centric messaging. This trend impacts both foodservice salmon sourcing and retail salmon products.
  • While the comparison of Atlantic salmon vs Coho salmon influences regional preferences, the overarching demand for organic salmon is a powerful market force. Producers are responding by investing in salmon farming technology and seafood traceability solutions, with certified sustainable farms demonstrating up to a 10% lower mortality rate compared to non-certified operations.
  • This focus on sustainability and health is reshaping the entire value chain.

We can help! Our analysts can customize this salmon market research report to meet your requirements.

Get in touch

1. Executive Summary

1.1 Market overview

Executive Summary - Chart on Market Overview
Executive Summary - Data Table on Market Overview
Executive Summary - Chart on Global Market Characteristics
Executive Summary - Chart on Market by Geography
Executive Summary - Chart on Market Segmentation by Distribution Channel
Executive Summary - Chart on Market Segmentation by Product Type
Executive Summary - Chart on Market Segmentation by End-user
Executive Summary - Chart on Incremental Growth
Executive Summary - Data Table on Incremental Growth
Executive Summary - Chart on Company Market Positioning

2. Technavio Analysis

2.1 Analysis of price sensitivity, lifecycle, customer purchase basket, adoption rates, and purchase criteria

2.2 Criticality of inputs and Factors of differentiation

Chart on Overview on criticality of inputs and factors of differentiation

2.3 Factors of disruption

Chart on Overview on factors of disruption

2.4 Impact of drivers and challenges

Chart on Impact of drivers and challenges in 2025 and 2030

3. Market Landscape

3.1 Market ecosystem

Chart on Parent Market
Data Table on - Parent Market

3.2 Market characteristics

Chart on Market characteristics analysis

3.3 Value chain analysis

Chart on Value chain analysis

4. Market Sizing

4.1 Market definition

Data Table on Offerings of companies included in the market definition

4.2 Market segment analysis

Market segments

4.3 Market size 2025

4.4 Market outlook: Forecast for 2025-2030

Chart on Global - Market size and forecast 2025-2030 ($ million)
Data Table on Global - Market size and forecast 2025-2030 ($ million)
Chart on Global Market: Year-over-year growth 2025-2030 (%)
Data Table on Global Market: Year-over-year growth 2025-2030 (%)

5. Historic Market Size

5.1 Global Salmon Market 2020 - 2024

Historic Market Size - Data Table on Global Salmon Market 2020 - 2024 ($ million)

5.2 Distribution Channel segment analysis 2020 - 2024

Historic Market Size - Distribution Channel Segment 2020 - 2024 ($ million)

5.3 Product Type segment analysis 2020 - 2024

Historic Market Size - Product Type Segment 2020 - 2024 ($ million)

5.4 End-user segment analysis 2020 - 2024

Historic Market Size - End-user Segment 2020 - 2024 ($ million)

5.5 Geography segment analysis 2020 - 2024

Historic Market Size - Geography Segment 2020 - 2024 ($ million)

5.6 Country segment analysis 2020 - 2024

Historic Market Size - Country Segment 2020 - 2024 ($ million)

6. Qualitative Analysis

6.1 Impact if Ai in Global Salmon Market

7. Five Forces Analysis

7.1 Five forces summary

Five forces analysis - Comparison between 2025 and 2030

7.2 Bargaining power of buyers

Bargaining power of buyers - Impact of key factors 2025 and 2030

7.3 Bargaining power of suppliers

Bargaining power of suppliers - Impact of key factors in 2025 and 2030

7.4 Threat of new entrants

Threat of new entrants - Impact of key factors in 2025 and 2030

7.5 Threat of substitutes

Threat of substitutes - Impact of key factors in 2025 and 2030

7.6 Threat of rivalry

Threat of rivalry - Impact of key factors in 2025 and 2030

7.7 Market condition

Chart on Market condition - Five forces 2025 and 2030

8. Market Segmentation by Distribution Channel

8.1 Market segments

Chart on Distribution Channel - Market share 2025-2030 (%)
Data Table on Distribution Channel - Market share 2025-2030 (%)

8.2 Comparison by Distribution Channel

Chart on Comparison by Distribution Channel
Data Table on Comparison by Distribution Channel

8.3 Offline - Market size and forecast 2025-2030

Chart on Offline - Market size and forecast 2025-2030 ($ million)
Data Table on Offline - Market size and forecast 2025-2030 ($ million)
Chart on Offline - Year-over-year growth 2025-2030 (%)
Data Table on Offline - Year-over-year growth 2025-2030 (%)

8.4 Online - Market size and forecast 2025-2030

Chart on Online - Market size and forecast 2025-2030 ($ million)
Data Table on Online - Market size and forecast 2025-2030 ($ million)
Chart on Online - Year-over-year growth 2025-2030 (%)
Data Table on Online - Year-over-year growth 2025-2030 (%)

8.5 Market opportunity by Distribution Channel

Market opportunity by Distribution Channel ($ million)
Data Table on Market opportunity by Distribution Channel ($ million)

9. Market Segmentation by Product Type

9.1 Market segments

Chart on Product Type - Market share 2025-2030 (%)
Data Table on Product Type - Market share 2025-2030 (%)

9.2 Comparison by Product Type

Chart on Comparison by Product Type
Data Table on Comparison by Product Type

9.3 Fresh - Market size and forecast 2025-2030

Chart on Fresh - Market size and forecast 2025-2030 ($ million)
Data Table on Fresh - Market size and forecast 2025-2030 ($ million)
Chart on Fresh - Year-over-year growth 2025-2030 (%)
Data Table on Fresh - Year-over-year growth 2025-2030 (%)

9.4 Frozen - Market size and forecast 2025-2030

Chart on Frozen - Market size and forecast 2025-2030 ($ million)
Data Table on Frozen - Market size and forecast 2025-2030 ($ million)
Chart on Frozen - Year-over-year growth 2025-2030 (%)
Data Table on Frozen - Year-over-year growth 2025-2030 (%)

9.5 Processed - Market size and forecast 2025-2030

Chart on Processed - Market size and forecast 2025-2030 ($ million)
Data Table on Processed - Market size and forecast 2025-2030 ($ million)
Chart on Processed - Year-over-year growth 2025-2030 (%)
Data Table on Processed - Year-over-year growth 2025-2030 (%)

9.6 Market opportunity by Product Type

Market opportunity by Product Type ($ million)
Data Table on Market opportunity by Product Type ($ million)

10. Market Segmentation by End-user

10.1 Market segments

Chart on End-user - Market share 2025-2030 (%)
Data Table on End-user - Market share 2025-2030 (%)

10.2 Comparison by End-user

Chart on Comparison by End-user
Data Table on Comparison by End-user

10.3 Foodservice - Market size and forecast 2025-2030

Chart on Foodservice - Market size and forecast 2025-2030 ($ million)
Data Table on Foodservice - Market size and forecast 2025-2030 ($ million)
Chart on Foodservice - Year-over-year growth 2025-2030 (%)
Data Table on Foodservice - Year-over-year growth 2025-2030 (%)

10.4 Retail - Market size and forecast 2025-2030

Chart on Retail - Market size and forecast 2025-2030 ($ million)
Data Table on Retail - Market size and forecast 2025-2030 ($ million)
Chart on Retail - Year-over-year growth 2025-2030 (%)
Data Table on Retail - Year-over-year growth 2025-2030 (%)

10.5 Industrial or processed food - Market size and forecast 2025-2030

Chart on Industrial or processed food - Market size and forecast 2025-2030 ($ million)
Data Table on Industrial or processed food - Market size and forecast 2025-2030 ($ million)
Chart on Industrial or processed food - Year-over-year growth 2025-2030 (%)
Data Table on Industrial or processed food - Year-over-year growth 2025-2030 (%)

10.6 Market opportunity by End-user

Market opportunity by End-user ($ million)
Data Table on Market opportunity by End-user ($ million)

11. Customer Landscape

11.1 Customer landscape overview

Analysis of price sensitivity, lifecycle, customer purchase basket, adoption rates, and purchase criteria

12. Geographic Landscape

12.1 Geographic segmentation

Chart on Market share by geography 2025-2030 (%)
Data Table on Market share by geography 2025-2030 (%)

12.2 Geographic comparison

Chart on Geographic comparison
Data Table on Geographic comparison

12.3 APAC - Market size and forecast 2025-2030

Chart on APAC - Market size and forecast 2025-2030 ($ million)
Data Table on APAC - Market size and forecast 2025-2030 ($ million)
Chart on APAC - Year-over-year growth 2025-2030 (%)
Data Table on APAC - Year-over-year growth 2025-2030 (%)
Chart on Regional Comparison - APAC
Data Table on Regional Comparison - APAC

12.3.1 China - Market size and forecast 2025-2030

Chart on China - Market size and forecast 2025-2030 ($ million)
Data Table on China - Market size and forecast 2025-2030 ($ million)
Chart on China - Year-over-year growth 2025-2030 (%)
Data Table on China - Year-over-year growth 2025-2030 (%)

12.3.2 Japan - Market size and forecast 2025-2030

Chart on Japan - Market size and forecast 2025-2030 ($ million)
Data Table on Japan - Market size and forecast 2025-2030 ($ million)
Chart on Japan - Year-over-year growth 2025-2030 (%)
Data Table on Japan - Year-over-year growth 2025-2030 (%)

12.3.3 India - Market size and forecast 2025-2030

Chart on India - Market size and forecast 2025-2030 ($ million)
Data Table on India - Market size and forecast 2025-2030 ($ million)
Chart on India - Year-over-year growth 2025-2030 (%)
Data Table on India - Year-over-year growth 2025-2030 (%)

12.3.4 South Korea - Market size and forecast 2025-2030

Chart on South Korea - Market size and forecast 2025-2030 ($ million)
Data Table on South Korea - Market size and forecast 2025-2030 ($ million)
Chart on South Korea - Year-over-year growth 2025-2030 (%)
Data Table on South Korea - Year-over-year growth 2025-2030 (%)

12.3.5 Australia - Market size and forecast 2025-2030

Chart on Australia - Market size and forecast 2025-2030 ($ million)
Data Table on Australia - Market size and forecast 2025-2030 ($ million)
Chart on Australia - Year-over-year growth 2025-2030 (%)
Data Table on Australia - Year-over-year growth 2025-2030 (%)

12.3.6 Indonesia - Market size and forecast 2025-2030

Chart on Indonesia - Market size and forecast 2025-2030 ($ million)
Data Table on Indonesia - Market size and forecast 2025-2030 ($ million)
Chart on Indonesia - Year-over-year growth 2025-2030 (%)
Data Table on Indonesia - Year-over-year growth 2025-2030 (%)

12.4 Europe - Market size and forecast 2025-2030

Chart on Europe - Market size and forecast 2025-2030 ($ million)
Data Table on Europe - Market size and forecast 2025-2030 ($ million)
Chart on Europe - Year-over-year growth 2025-2030 (%)
Data Table on Europe - Year-over-year growth 2025-2030 (%)
Chart on Regional Comparison - Europe
Data Table on Regional Comparison - Europe

12.4.1 Belgium - Market size and forecast 2025-2030

Chart on Belgium - Market size and forecast 2025-2030 ($ million)
Data Table on Belgium - Market size and forecast 2025-2030 ($ million)
Chart on Belgium - Year-over-year growth 2025-2030 (%)
Data Table on Belgium - Year-over-year growth 2025-2030 (%)

12.4.2 UK - Market size and forecast 2025-2030

Chart on UK - Market size and forecast 2025-2030 ($ million)
Data Table on UK - Market size and forecast 2025-2030 ($ million)
Chart on UK - Year-over-year growth 2025-2030 (%)
Data Table on UK - Year-over-year growth 2025-2030 (%)

12.4.3 France - Market size and forecast 2025-2030

Chart on France - Market size and forecast 2025-2030 ($ million)
Data Table on France - Market size and forecast 2025-2030 ($ million)
Chart on France - Year-over-year growth 2025-2030 (%)
Data Table on France - Year-over-year growth 2025-2030 (%)

12.4.4 Denmark - Market size and forecast 2025-2030

Chart on Denmark - Market size and forecast 2025-2030 ($ million)
Data Table on Denmark - Market size and forecast 2025-2030 ($ million)
Chart on Denmark - Year-over-year growth 2025-2030 (%)
Data Table on Denmark - Year-over-year growth 2025-2030 (%)

12.4.5 Italy - Market size and forecast 2025-2030

Chart on Italy - Market size and forecast 2025-2030 ($ million)
Data Table on Italy - Market size and forecast 2025-2030 ($ million)
Chart on Italy - Year-over-year growth 2025-2030 (%)
Data Table on Italy - Year-over-year growth 2025-2030 (%)

12.4.6 The Netherlands - Market size and forecast 2025-2030

Chart on The Netherlands - Market size and forecast 2025-2030 ($ million)
Data Table on The Netherlands - Market size and forecast 2025-2030 ($ million)
Chart on The Netherlands - Year-over-year growth 2025-2030 (%)
Data Table on The Netherlands - Year-over-year growth 2025-2030 (%)

12.5 North America - Market size and forecast 2025-2030

Chart on North America - Market size and forecast 2025-2030 ($ million)
Data Table on North America - Market size and forecast 2025-2030 ($ million)
Chart on North America - Year-over-year growth 2025-2030 (%)
Data Table on North America - Year-over-year growth 2025-2030 (%)
Chart on Regional Comparison - North America
Data Table on Regional Comparison - North America

12.5.1 US - Market size and forecast 2025-2030

Chart on US - Market size and forecast 2025-2030 ($ million)
Data Table on US - Market size and forecast 2025-2030 ($ million)
Chart on US - Year-over-year growth 2025-2030 (%)
Data Table on US - Year-over-year growth 2025-2030 (%)

12.5.2 Canada - Market size and forecast 2025-2030

Chart on Canada - Market size and forecast 2025-2030 ($ million)
Data Table on Canada - Market size and forecast 2025-2030 ($ million)
Chart on Canada - Year-over-year growth 2025-2030 (%)
Data Table on Canada - Year-over-year growth 2025-2030 (%)

12.5.3 Mexico - Market size and forecast 2025-2030

Chart on Mexico - Market size and forecast 2025-2030 ($ million)
Data Table on Mexico - Market size and forecast 2025-2030 ($ million)
Chart on Mexico - Year-over-year growth 2025-2030 (%)
Data Table on Mexico - Year-over-year growth 2025-2030 (%)

12.6 South America - Market size and forecast 2025-2030

Chart on South America - Market size and forecast 2025-2030 ($ million)
Data Table on South America - Market size and forecast 2025-2030 ($ million)
Chart on South America - Year-over-year growth 2025-2030 (%)
Data Table on South America - Year-over-year growth 2025-2030 (%)
Chart on Regional Comparison - South America
Data Table on Regional Comparison - South America

12.6.1 Brazil - Market size and forecast 2025-2030

Chart on Brazil - Market size and forecast 2025-2030 ($ million)
Data Table on Brazil - Market size and forecast 2025-2030 ($ million)
Chart on Brazil - Year-over-year growth 2025-2030 (%)
Data Table on Brazil - Year-over-year growth 2025-2030 (%)

12.6.2 Chile - Market size and forecast 2025-2030

Chart on Chile - Market size and forecast 2025-2030 ($ million)
Data Table on Chile - Market size and forecast 2025-2030 ($ million)
Chart on Chile - Year-over-year growth 2025-2030 (%)
Data Table on Chile - Year-over-year growth 2025-2030 (%)

12.6.3 Argentina - Market size and forecast 2025-2030

Chart on Argentina - Market size and forecast 2025-2030 ($ million)
Data Table on Argentina - Market size and forecast 2025-2030 ($ million)
Chart on Argentina - Year-over-year growth 2025-2030 (%)
Data Table on Argentina - Year-over-year growth 2025-2030 (%)

12.7 Middle East and Africa - Market size and forecast 2025-2030

Chart on Middle East and Africa - Market size and forecast 2025-2030 ($ million)
Data Table on Middle East and Africa - Market size and forecast 2025-2030 ($ million)
Chart on Middle East and Africa - Year-over-year growth 2025-2030 (%)
Data Table on Middle East and Africa - Year-over-year growth 2025-2030 (%)
Chart on Regional Comparison - Middle East and Africa
Data Table on Regional Comparison - Middle East and Africa

12.7.1 UAE - Market size and forecast 2025-2030

Chart on UAE - Market size and forecast 2025-2030 ($ million)
Data Table on UAE - Market size and forecast 2025-2030 ($ million)
Chart on UAE - Year-over-year growth 2025-2030 (%)
Data Table on UAE - Year-over-year growth 2025-2030 (%)

12.7.2 Saudi Arabia - Market size and forecast 2025-2030

Chart on Saudi Arabia - Market size and forecast 2025-2030 ($ million)
Data Table on Saudi Arabia - Market size and forecast 2025-2030 ($ million)
Chart on Saudi Arabia - Year-over-year growth 2025-2030 (%)
Data Table on Saudi Arabia - Year-over-year growth 2025-2030 (%)

12.7.3 South Africa - Market size and forecast 2025-2030

Chart on South Africa - Market size and forecast 2025-2030 ($ million)
Data Table on South Africa - Market size and forecast 2025-2030 ($ million)
Chart on South Africa - Year-over-year growth 2025-2030 (%)
Data Table on South Africa - Year-over-year growth 2025-2030 (%)

12.7.4 Turkey - Market size and forecast 2025-2030

Chart on Turkey - Market size and forecast 2025-2030 ($ million)
Data Table on Turkey - Market size and forecast 2025-2030 ($ million)
Chart on Turkey - Year-over-year growth 2025-2030 (%)
Data Table on Turkey - Year-over-year growth 2025-2030 (%)

12.7.5 Morocco - Market size and forecast 2025-2030

Chart on Morocco - Market size and forecast 2025-2030 ($ million)
Data Table on Morocco - Market size and forecast 2025-2030 ($ million)
Chart on Morocco - Year-over-year growth 2025-2030 (%)
Data Table on Morocco - Year-over-year growth 2025-2030 (%)

12.8 Market opportunity by geography

Market opportunity by geography ($ million)
Data Tables on Market opportunity by geography ($ million)

13. Drivers, Challenges, and Opportunity

13.1 Market drivers

Rising health consciousness
Rising popularity of seafood
Increased demand for wild-caught Alaskan salmon

13.2 Market challenges

Rising feed costs impacting profitability
Lack of skilled workforce to operate aquaculture
Stringent regulations associated with fish catching

13.3 Impact of drivers and challenges

Impact of drivers and challenges in 2025 and 2030

13.4 Market opportunities

Robust demand for omega-3 fatty acids
High demand for organic salmon
Rising consumption of packaged meat products

14. Competitive Landscape

14.1 Overview

14.2

Overview on criticality of inputs and factors of differentiation

14.3 Landscape disruption

Overview on factors of disruption

14.4 Industry risks

Impact of key risks on business

15. Competitive Analysis

15.1 Companies profiled

Companies covered

15.2 Company ranking index

15.3 Market positioning of companies

Matrix on companies position and classification

15.4 Agrosuper SA

Agrosuper SA - Overview
Agrosuper SA - Business segments
Agrosuper SA - Key offerings
Agrosuper SA - Segment focus
SWOT

15.5 Alsaker Fjordbruk AS

Alsaker Fjordbruk AS - Overview
Alsaker Fjordbruk AS - Product / Service
Alsaker Fjordbruk AS - Key offerings
SWOT

15.6 AquaChile

AquaChile - Overview
AquaChile - Product / Service
AquaChile - Key offerings
SWOT

15.7 Austevoll Seafood ASA

Austevoll Seafood ASA - Overview
Austevoll Seafood ASA - Business segments
Austevoll Seafood ASA - Key offerings
Austevoll Seafood ASA - Segment focus
SWOT

15.8 BLUMAR

BLUMAR - Overview
BLUMAR - Product / Service
BLUMAR - Key offerings
SWOT

15.9 Cermaq Group

Cermaq Group - Overview
Cermaq Group - Product / Service
Cermaq Group - Key offerings
SWOT

15.10 Cooke Aquaculture Inc.

Cooke Aquaculture Inc. - Overview
Cooke Aquaculture Inc. - Product / Service
Cooke Aquaculture Inc. - Key offerings
SWOT

15.11 Grieg Seafood ASA

Grieg Seafood ASA - Overview
Grieg Seafood ASA - Business segments
Grieg Seafood ASA - Key offerings
Grieg Seafood ASA - Segment focus
SWOT

15.12 Huon Aquaculture

Huon Aquaculture - Overview
Huon Aquaculture - Product / Service
Huon Aquaculture - Key offerings
SWOT

15.13 Leroy Seafood Group ASA

Leroy Seafood Group ASA - Overview
Leroy Seafood Group ASA - Product / Service
Leroy Seafood Group ASA - Key offerings
SWOT

15.14 Mowi ASA

Mowi ASA - Overview
Mowi ASA - Business segments
Mowi ASA - Key offerings
Mowi ASA - Segment focus
SWOT

15.15 Multiexport Foods S.A.

Multiexport Foods S.A. - Overview
Multiexport Foods S.A. - Product / Service
Multiexport Foods S.A. - Key offerings
SWOT

15.16 Nordlaks

Nordlaks - Overview
Nordlaks - Product / Service
Nordlaks - Key offerings
SWOT

15.17 PF Bakkafrost

PF Bakkafrost - Overview
PF Bakkafrost - Product / Service
PF Bakkafrost - Key offerings
SWOT

15.18 SalMar ASA

SalMar ASA - Overview
SalMar ASA - Business segments
SalMar ASA - Key offerings
SalMar ASA - Segment focus
SWOT

16. Appendix

16.1 Scope of the report

Market definition
Objectives
Notes and caveats

16.2 Inclusions and exclusions checklist

Inclusions checklist
Exclusions checklist

16.3 Currency conversion rates for US$

16.4 Research methodology

16.5 Data procurement

Information sources

16.6 Data validation

16.7 Validation techniques employed for market sizing

16.8 Data synthesis

16.9 360 degree market analysis

16.10 List of abbreviations

Research Methodology

Technavio presents a detailed picture of the market by way of study, synthesis, and summation of data from multiple sources. The analysts have presented the various facets of the market with a particular focus on identifying the key industry influencers. The data thus presented is comprehensive, reliable, and the result of extensive research, both primary and secondary.

INFORMATION SOURCES

Primary sources

  • Manufacturers and suppliers
  • Channel partners
  • Industry experts
  • Strategic decision makers

Secondary sources

  • Industry journals and periodicals
  • Government data
  • Financial reports of key industry players
  • Historical data
  • Press releases

DATA ANALYSIS

Data Synthesis

  • Collation of data
  • Estimation of key figures
  • Analysis of derived insights

Data Validation

  • Triangulation with data models
  • Reference against proprietary databases
  • Corroboration with industry experts

REPORT WRITING

Qualitative

  • Market drivers
  • Market challenges
  • Market trends
  • Five forces analysis

Quantitative

  • Market size and forecast
  • Market segmentation
  • Geographical insights
  • Competitive landscape

Interested in this report?

Get your sample now to see our research methodology and insights!

Download Now

Frequently Asked Questions

Salmon market growth will increase by USD 5927.2 million during 2026-2030.

The Salmon market is expected to grow at a CAGR of 4.6% during 2026-2030.

Salmon market is segmented by Distribution channel (Offline, Online) Product type (Fresh, Frozen, Processed) End-user (Foodservice, Retail, Industrial or processed food)

Agrosuper SA, Alsaker Fjordbruk AS, AquaChile, Austevoll Seafood ASA, BLUMAR, Captainfresh, Cermaq Group, Cooke Aquaculture Inc., Grieg Seafood ASA, Huon Aquaculture, Leroy Seafood Group ASA, Mowi ASA, Multiexport Foods S.A., Nordlaks, PF Bakkafrost, SalMar ASA are a few of the key vendors in the Salmon market.

APAC will register the highest growth rate of 44.2% among the other regions. Therefore, the Salmon market in APAC is expected to garner significant business opportunities for the vendors during the forecast period.

China, Japan, India, South Korea, Australia, Indonesia, Belgium, UK, France, Denmark, Italy, The Netherlands, US, Canada, Mexico, Brazil, Chile, Argentina, UAE, Saudi Arabia, South Africa, Turkey, Morocco

  • Rising health consciousness is the driving factor this market.

The Salmon market vendors should focus on grabbing business opportunities from the Distribution channel segment as it accounted for the largest market share in the base year.